- Financial Statement Analysis: Lecture Outline

Содержание
- 2. Financial Statement Analysis: Lecture Outline Review of Financial Statements Review of Ratios Types of Ratios Examples
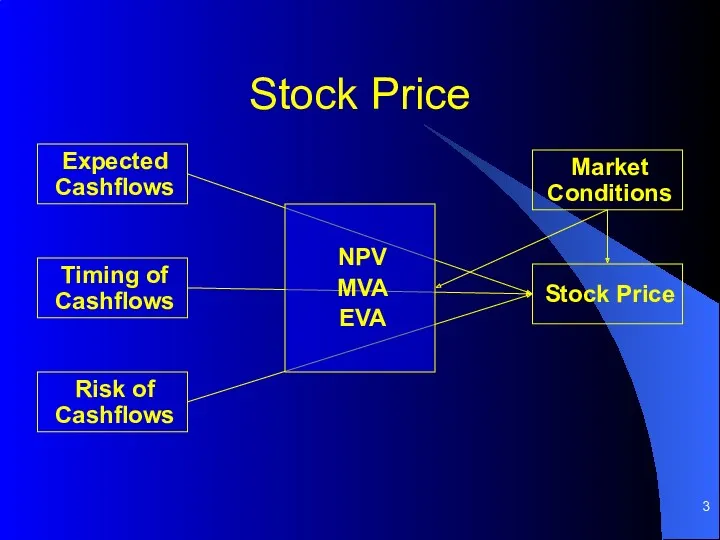
- 3. Stock Price Risk of Cashflows Timing of Cashflows Expected Cashflows Stock Price Market Conditions NPV MVA
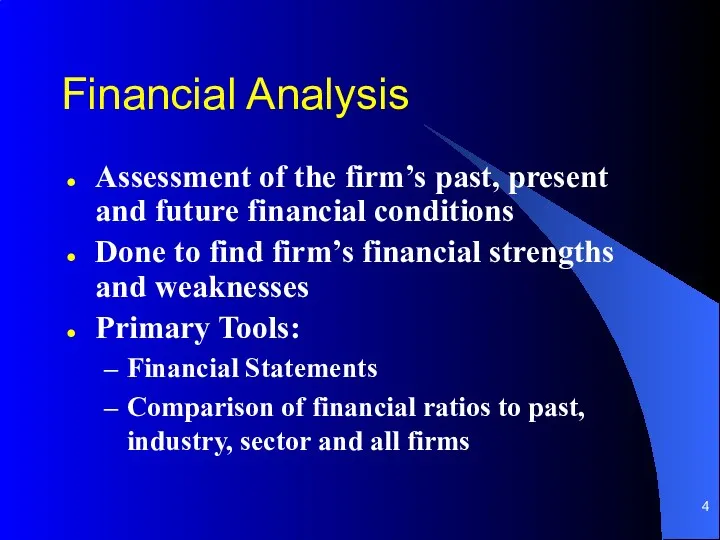
- 4. Financial Analysis Assessment of the firm’s past, present and future financial conditions Done to find firm’s
- 5. Financial Statements Balance Sheet Income Statement Cashflow Statement Statement of Retained Earnings
- 6. Review: Major Balance Sheet Items Assets Current assets: Cash & securities Receivables Inventories Fixed assets: Tangible
- 7. An Example: Dell Abbreviated Balance Sheet Assets: Current Assets: $7,681.00 Non-Current Assets: $3,790.00 Total Assets: $11,471.00
- 8. Review: Major Income Statement Items Gross Profit = Sales - Costs of Goods Sold EBITDA =
- 9. An Example: Dell Abbreviated Income Statement Sales $25,265.00 Costs of Goods Sold -$19,891.00 Gross Profit $5,374.00
- 10. Objectives of Ratio Analysis Standardize financial information for comparisons Evaluate current operations Compare performance with past
- 11. Rationale Behind Ratio Analysis A firm has resources It converts resources into profits through production of
- 12. Types of Ratios Financial Ratios: Liquidity Ratios Assess ability to cover current obligations Leverage Ratios Assess
- 13. Current Ratio: Quick (Acid Test) Ratio: Liquidity Ratio Examples: Dell
- 14. Ratio Comparison: Current Ratio
- 15. Ratio Comparison: Debt Ratio
- 16. Return on Assets (ROA): Return on Equity (ROE): Profitability Ratio Examples: Dell
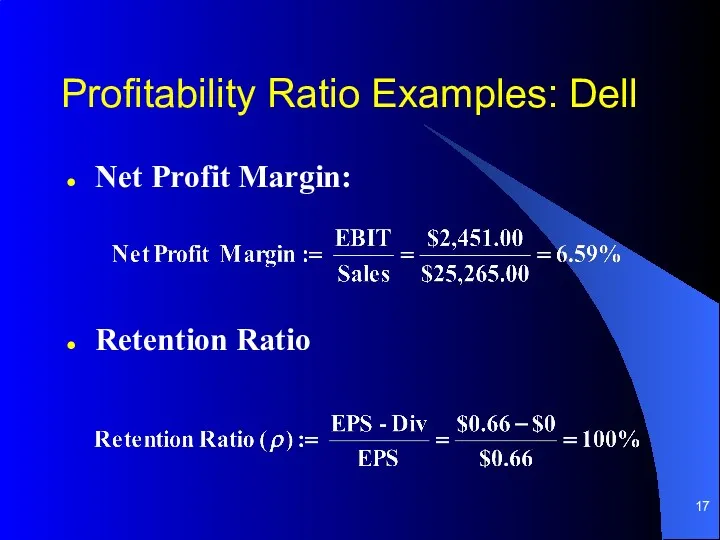
- 17. Profitability Ratio Examples: Dell Net Profit Margin: Retention Ratio
- 18. Ratio Comparison: ROE
- 19. Ratio Comparison: ROA
- 20. Ratio Comparison: Profit Margin
- 21. Total Asset Turnover Ratio: Inventory Turnover Ratio: Activity (Turnover) Ratio Examples: Dell
- 22. Ratio Comparison: Asset Turnover
- 23. The DuPont System Method to breakdown ROE into: ROA and Equity Multiplier ROA is further broken
- 24. The DuPont System
- 25. The DuPont System
- 26. The DuPont System
- 27. The DuPont System
- 28. The DuPont System: Dell
- 29. A Note on Sustainable Growth and Stock Returns In the long run Sustainable growth and long
- 30. Example: Predicted Sustainable Growth for Dell Based on the most recent numbers: ROE = 31.39% &
- 31. Ratios and Forecasting Common stock valuation based on Expected cashflows to stockholders ROE and ρ are
- 32. Summary of Financial Ratios Ratios help to: Evaluate performance Structure analysis Show the connection between activities
- 33. Limitations of Ratio Analysis A firm’s industry category is often difficult to identify Published industry averages
- 34. Limitations of Ratio Analysis We have been talking as if management always wants to increase ROE
- 35. The Timing Problem As a decision-maker in a business environment you are often encouraged to focus
- 36. The Risk Problem We talked a lot about how risk and return go together. ROE is
- 37. The Value Problem ROE measures a “return” figure but it is based on two accounting figures.
- 39. Скачать презентацию
Financial Statement Analysis: Lecture Outline
Review of Financial Statements
Review of Ratios
Types of
Financial Statement Analysis: Lecture Outline
Review of Financial Statements
Review of Ratios
Types of
Stock Price
Risk of
Cashflows
Timing of Cashflows
Expected
Cashflows
Stock Price
Market Conditions
NPV
MVA
EVA
Stock Price
Risk of
Cashflows
Timing of Cashflows
Expected
Cashflows
Stock Price
Market Conditions
NPV
MVA
EVA
Financial Analysis
Assessment of the firm’s past, present and future financial conditions
Done
Financial Analysis
Assessment of the firm’s past, present and future financial conditions
Done
Financial Statements
Balance Sheet
Income Statement
Cashflow Statement
Statement of Retained Earnings
Financial Statements
Balance Sheet
Income Statement
Cashflow Statement
Statement of Retained Earnings
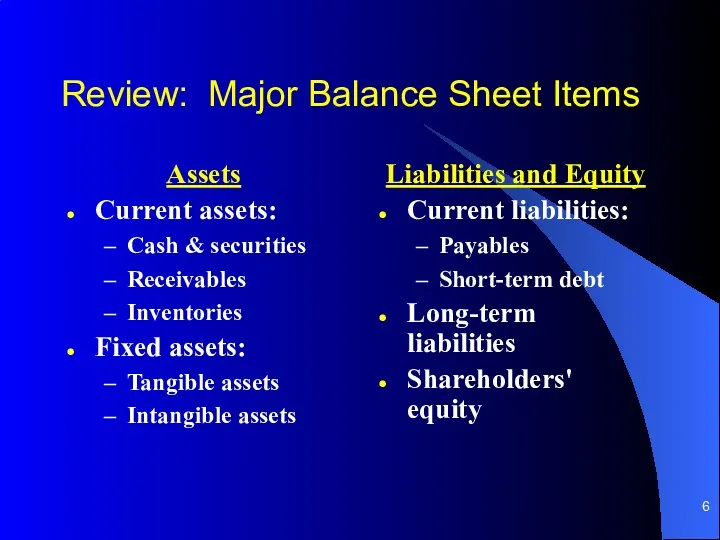
Review: Major Balance Sheet Items
Assets
Current assets:
Cash & securities
Receivables
Inventories
Fixed assets:
Tangible assets
Intangible assets
Liabilities
Review: Major Balance Sheet Items
Assets
Current assets:
Cash & securities
Receivables
Inventories
Fixed assets:
Tangible assets
Intangible assets
Liabilities
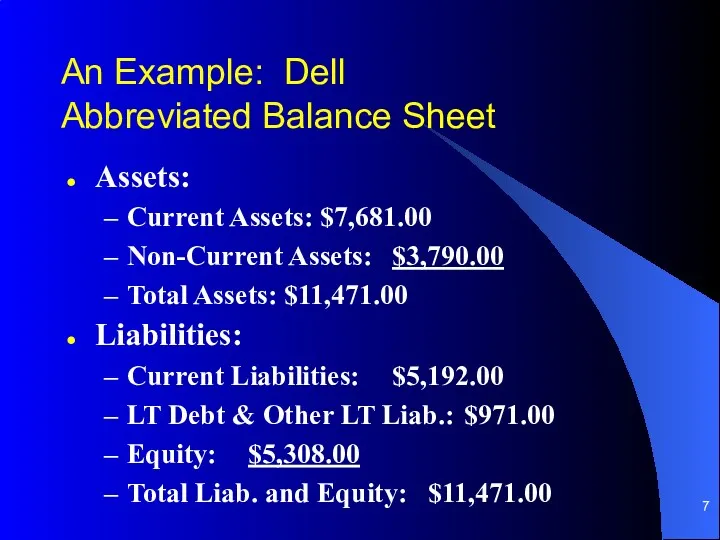
An Example: Dell
Abbreviated Balance Sheet
Assets:
Current Assets: $7,681.00
Non-Current Assets: $3,790.00
Total Assets: $11,471.00
Liabilities:
Current Liabilities: $5,192.00
LT Debt
An Example: Dell
Abbreviated Balance Sheet
Assets:
Current Assets: $7,681.00
Non-Current Assets: $3,790.00
Total Assets: $11,471.00
Liabilities:
Current Liabilities: $5,192.00
LT Debt
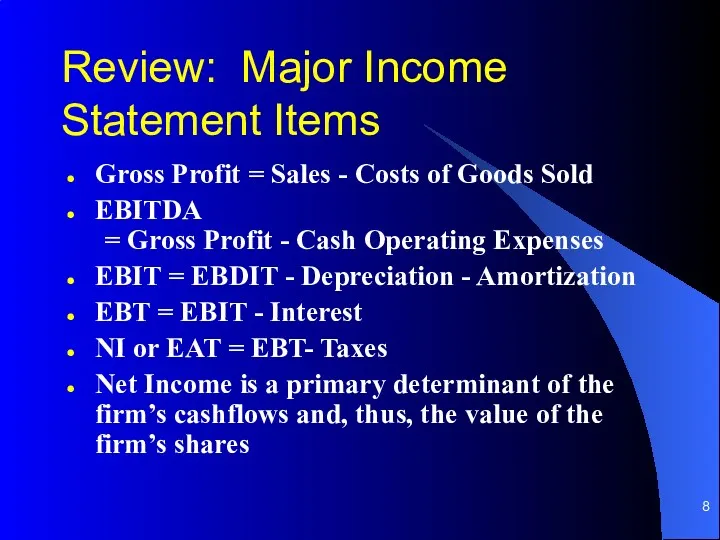
Review: Major Income Statement Items
Gross Profit = Sales - Costs of
Review: Major Income Statement Items
Gross Profit = Sales - Costs of
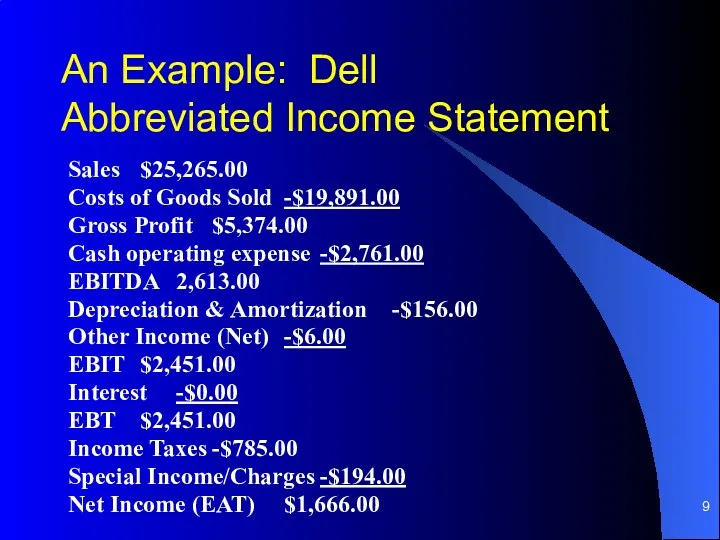
An Example: Dell
Abbreviated Income Statement
Sales $25,265.00
Costs of Goods Sold -$19,891.00
Gross Profit $5,374.00
Cash operating expense -$2,761.00
EBITDA 2,613.00
Depreciation
An Example: Dell
Abbreviated Income Statement
Sales $25,265.00
Costs of Goods Sold -$19,891.00
Gross Profit $5,374.00
Cash operating expense -$2,761.00
EBITDA 2,613.00
Depreciation
Objectives of Ratio Analysis
Standardize financial information for comparisons
Evaluate current operations
Compare performance
Objectives of Ratio Analysis
Standardize financial information for comparisons
Evaluate current operations
Compare performance
Rationale Behind Ratio Analysis
A firm has resources
It converts resources into profits
Rationale Behind Ratio Analysis
A firm has resources
It converts resources into profits
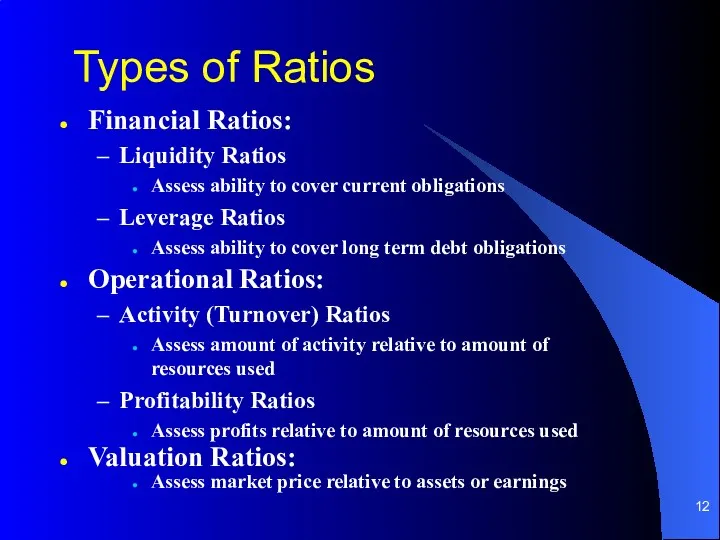
Types of Ratios
Financial Ratios:
Liquidity Ratios
Assess ability to cover current obligations
Leverage Ratios
Assess
Types of Ratios
Financial Ratios:
Liquidity Ratios
Assess ability to cover current obligations
Leverage Ratios
Assess
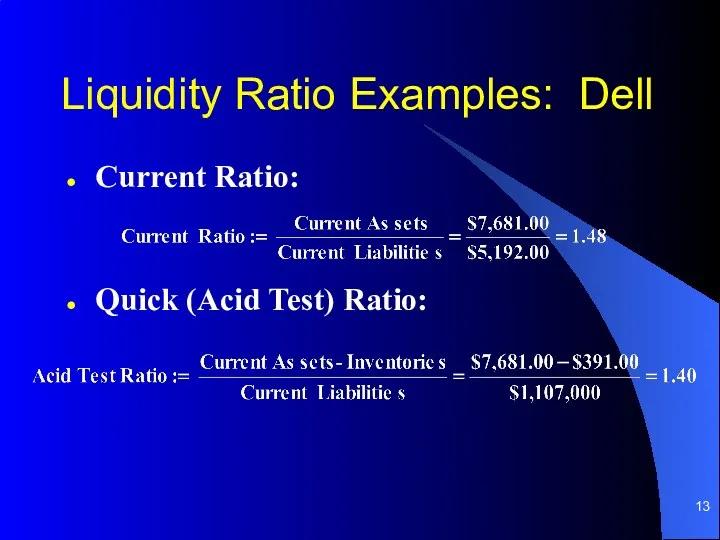
Current Ratio:
Quick (Acid Test) Ratio:
Liquidity Ratio Examples: Dell
Current Ratio:
Quick (Acid Test) Ratio:
Liquidity Ratio Examples: Dell
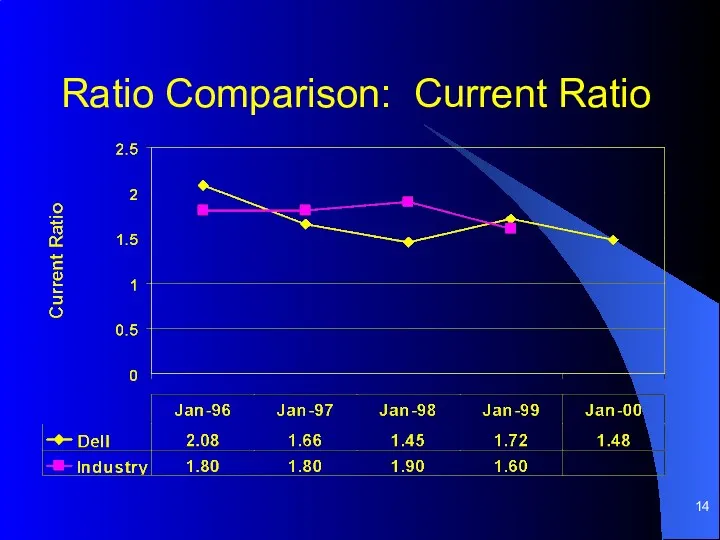
Ratio Comparison: Current Ratio
Ratio Comparison: Current Ratio
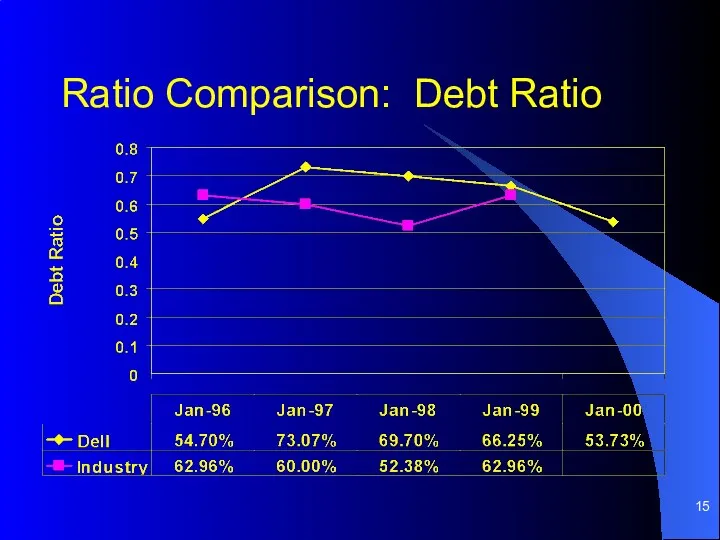
Ratio Comparison: Debt Ratio
Ratio Comparison: Debt Ratio
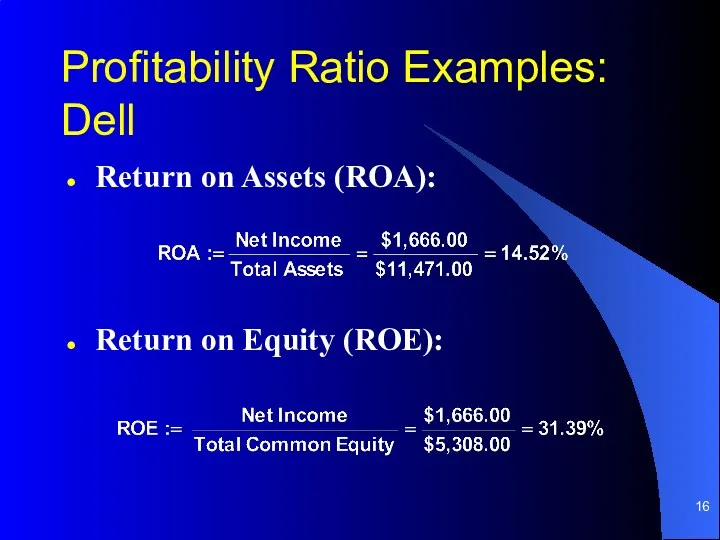
Return on Assets (ROA):
Return on Equity (ROE):
Profitability Ratio Examples: Dell
Return on Assets (ROA):
Return on Equity (ROE):
Profitability Ratio Examples: Dell
Profitability Ratio Examples: Dell
Net Profit Margin:
Retention Ratio
Profitability Ratio Examples: Dell
Net Profit Margin:
Retention Ratio
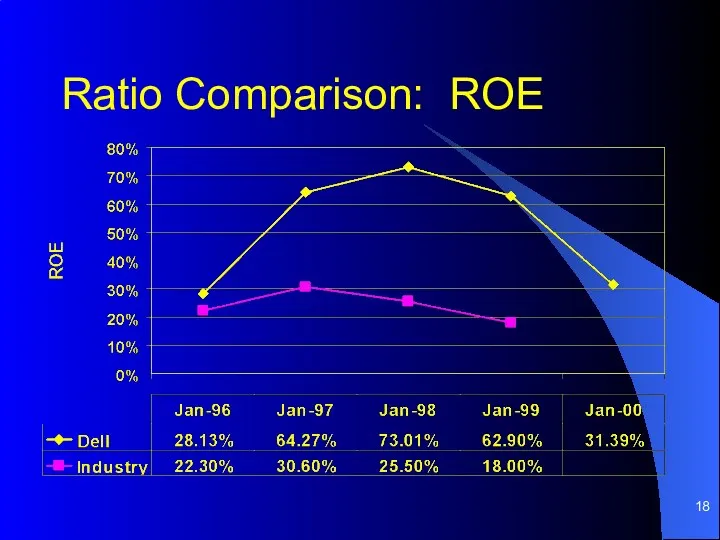
Ratio Comparison: ROE
Ratio Comparison: ROE
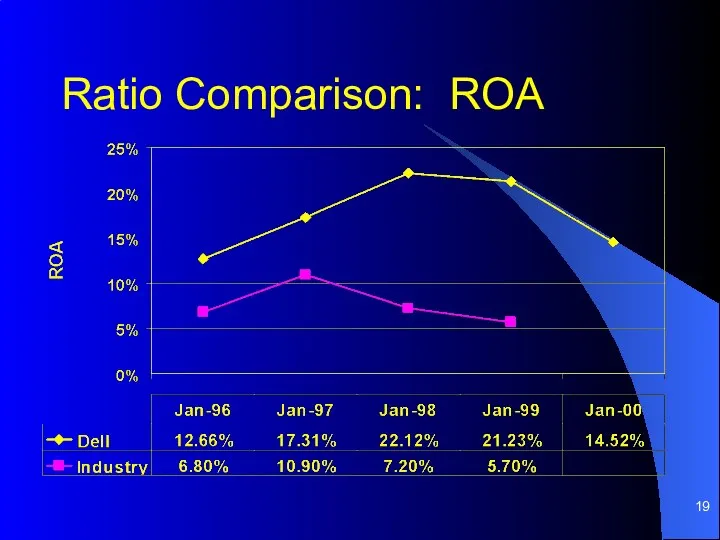
Ratio Comparison: ROA
Ratio Comparison: ROA
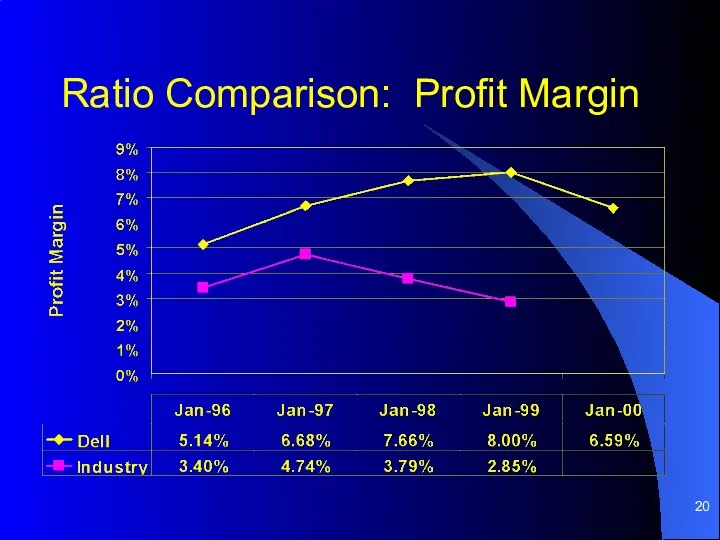
Ratio Comparison: Profit Margin
Ratio Comparison: Profit Margin
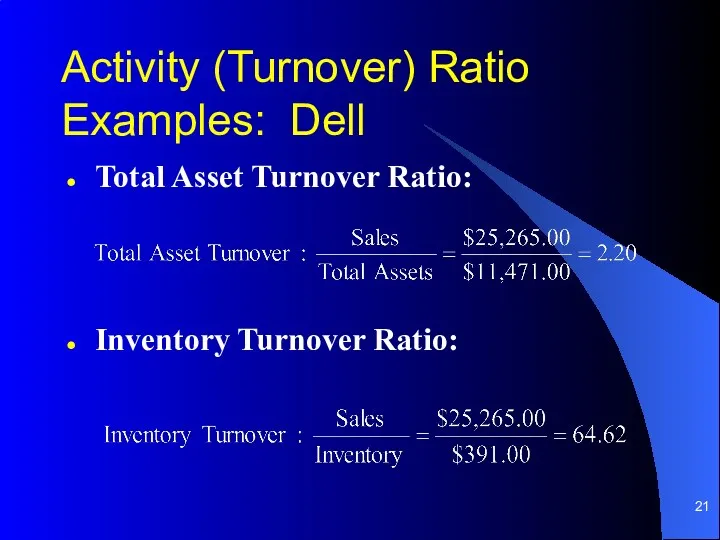
Total Asset Turnover Ratio:
Inventory Turnover Ratio:
Activity (Turnover) Ratio Examples: Dell
Total Asset Turnover Ratio:
Inventory Turnover Ratio:
Activity (Turnover) Ratio Examples: Dell
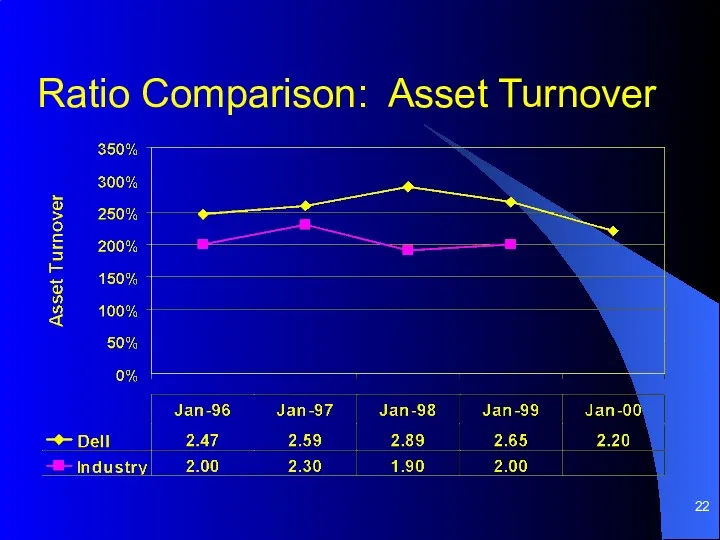
Ratio Comparison: Asset Turnover
Ratio Comparison: Asset Turnover
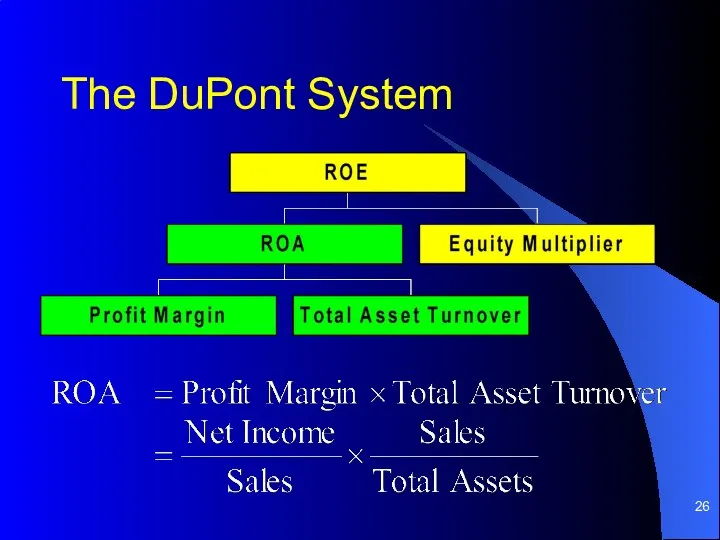
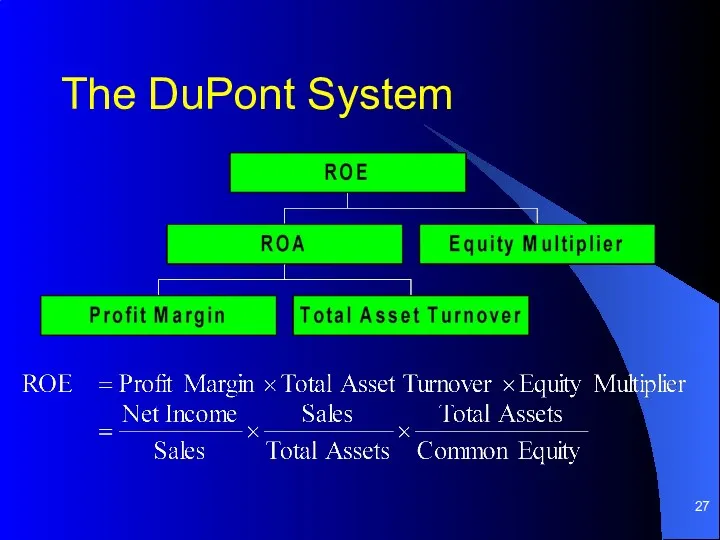
The DuPont System
Method to breakdown ROE into:
ROA and Equity Multiplier
ROA is
The DuPont System
Method to breakdown ROE into:
ROA and Equity Multiplier
ROA is
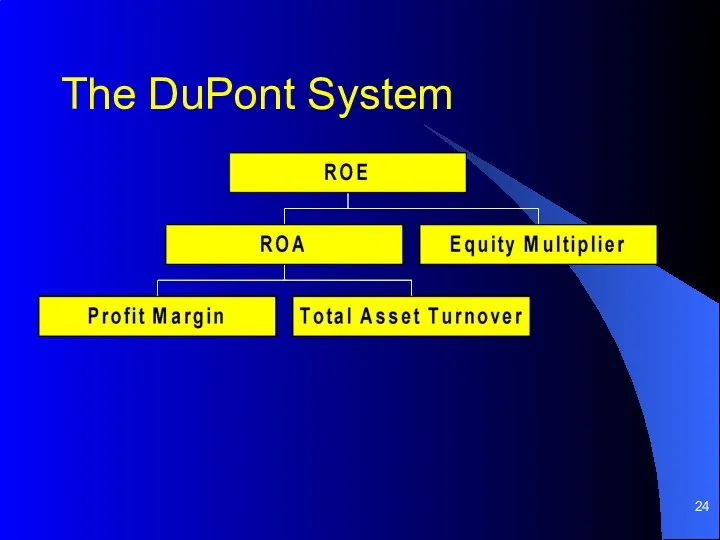
The DuPont System
The DuPont System
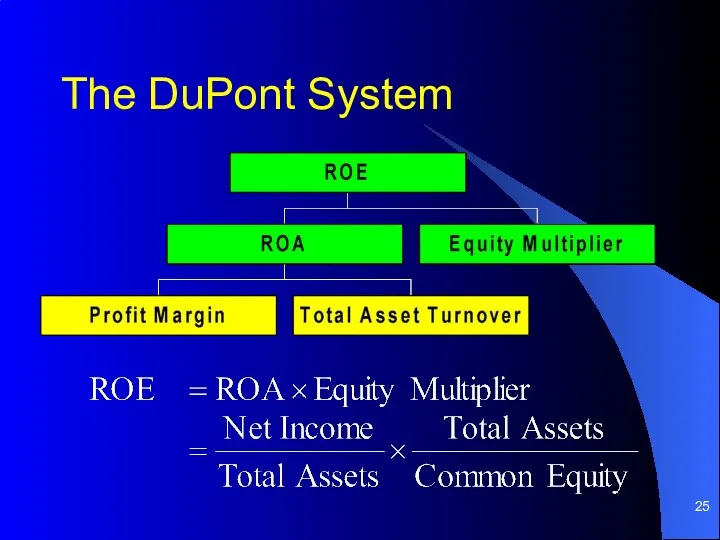
The DuPont System
The DuPont System
The DuPont System
The DuPont System
The DuPont System
The DuPont System
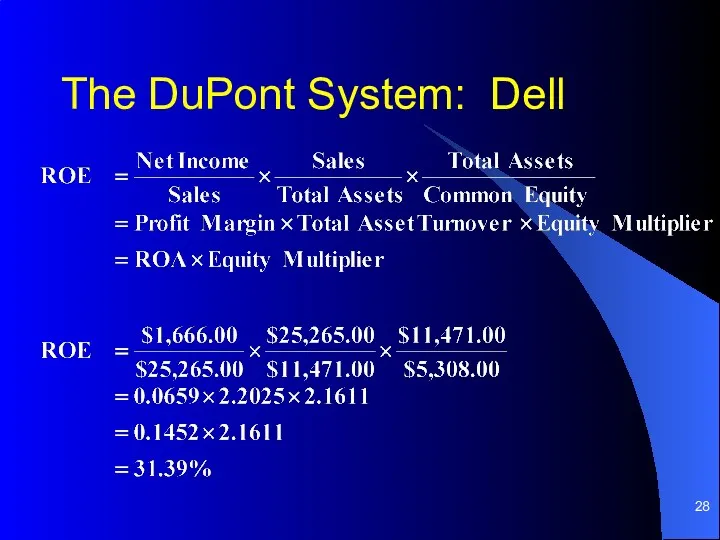
The DuPont System: Dell
The DuPont System: Dell
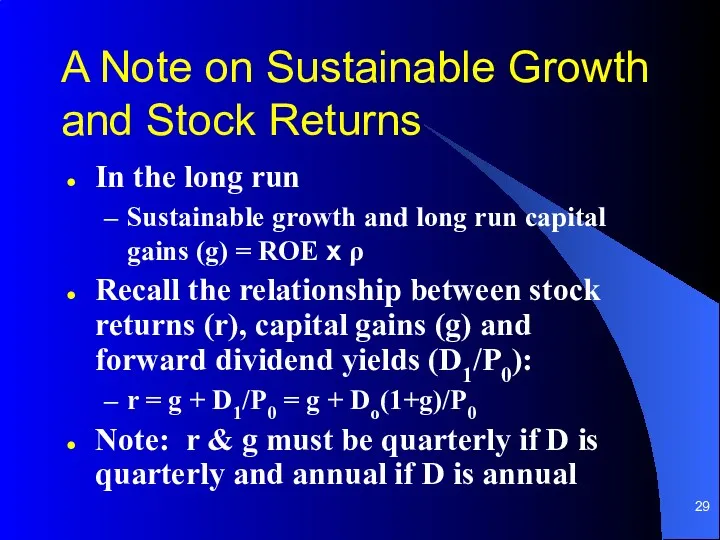
A Note on Sustainable Growth and Stock Returns
In the long run
Sustainable
A Note on Sustainable Growth and Stock Returns
In the long run
Sustainable
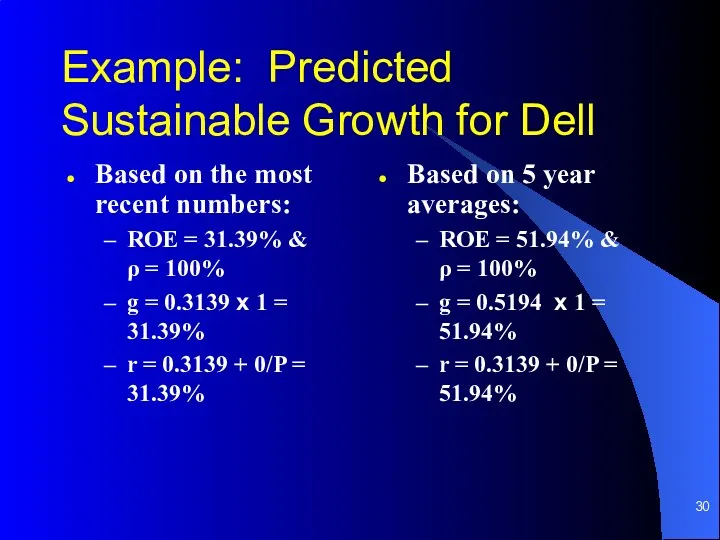
Example: Predicted Sustainable Growth for Dell
Based on the most recent numbers:
ROE
Example: Predicted Sustainable Growth for Dell
Based on the most recent numbers:
ROE
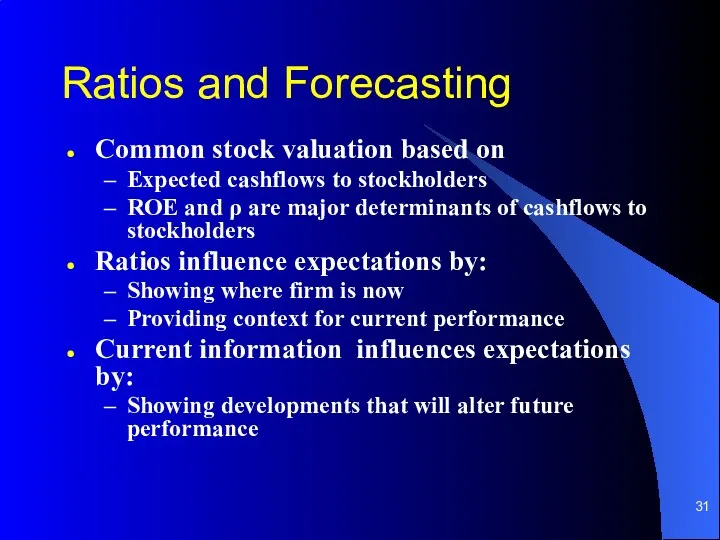
Ratios and Forecasting
Common stock valuation based on
Expected cashflows to stockholders
ROE and
Ratios and Forecasting
Common stock valuation based on
Expected cashflows to stockholders
ROE and
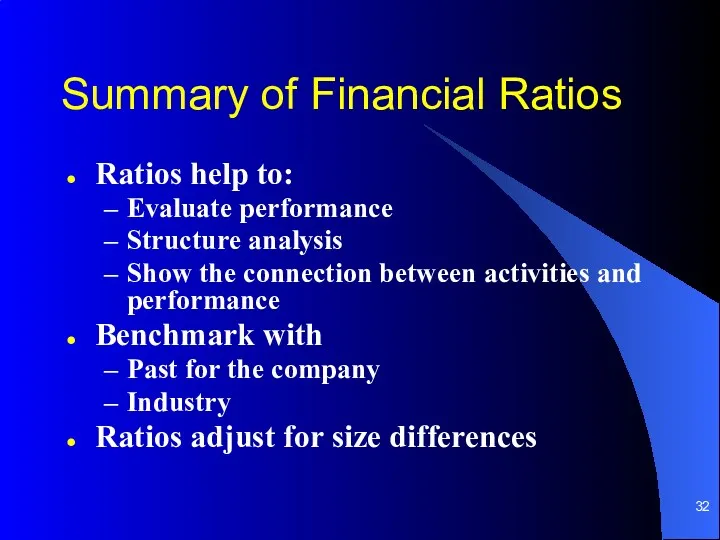
Summary of Financial Ratios
Ratios help to:
Evaluate performance
Structure analysis
Show the connection between
Summary of Financial Ratios
Ratios help to:
Evaluate performance
Structure analysis
Show the connection between
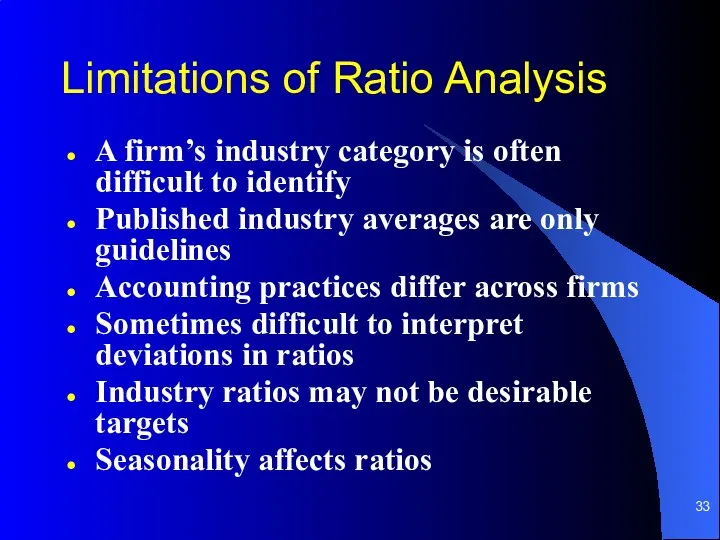
Limitations of Ratio Analysis
A firm’s industry category is often difficult to
Limitations of Ratio Analysis
A firm’s industry category is often difficult to
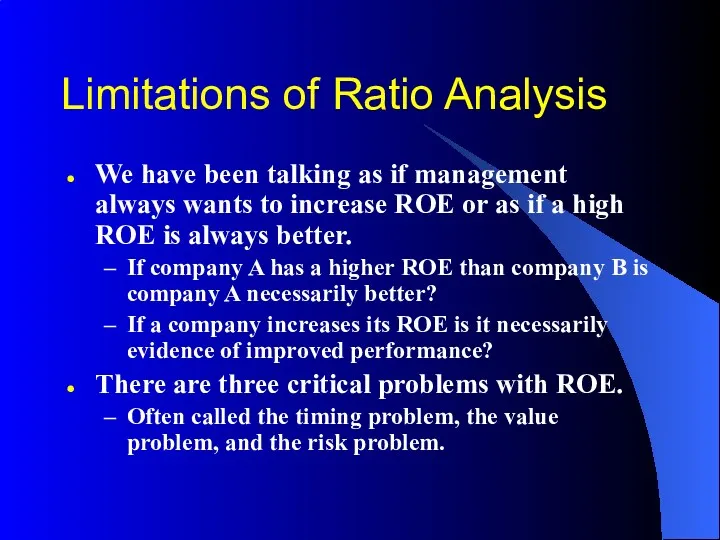
Limitations of Ratio Analysis
We have been talking as if management always
Limitations of Ratio Analysis
We have been talking as if management always
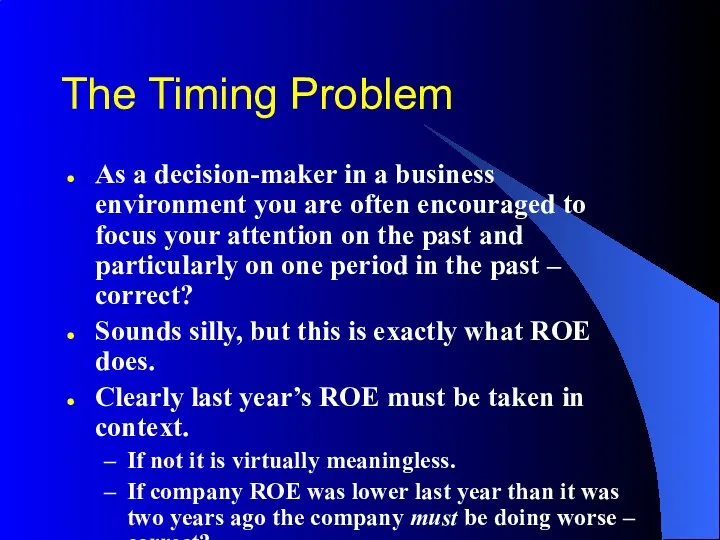
The Timing Problem
As a decision-maker in a business environment you are
The Timing Problem
As a decision-maker in a business environment you are
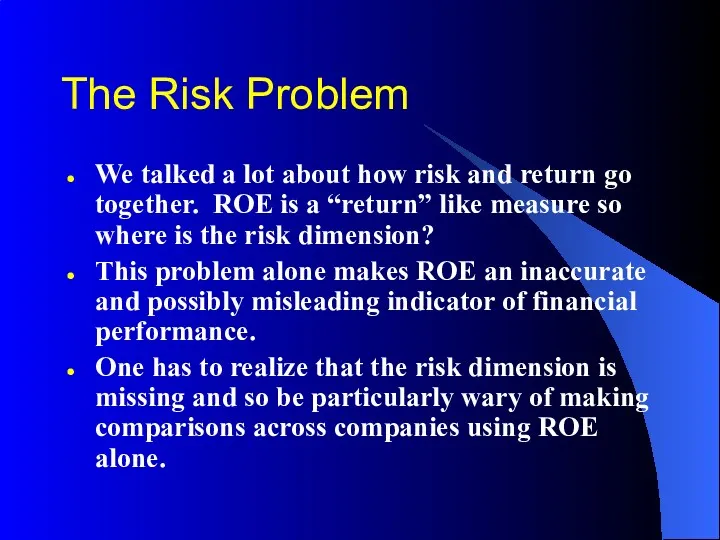
The Risk Problem
We talked a lot about how risk and return
The Risk Problem
We talked a lot about how risk and return
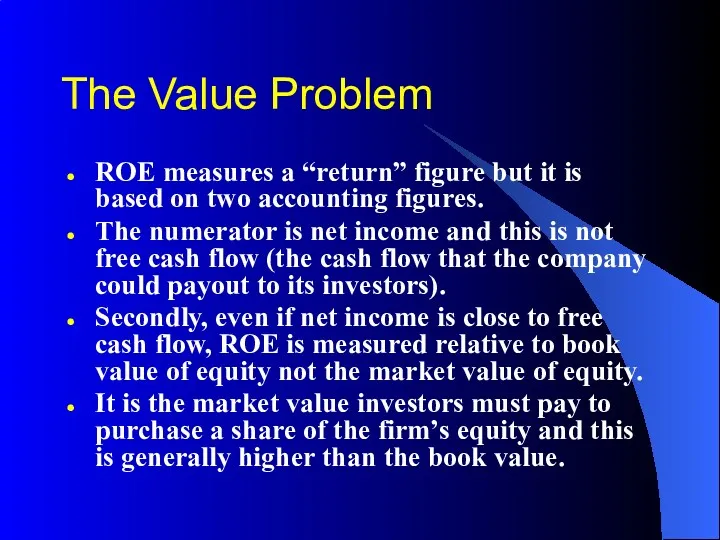
The Value Problem
ROE measures a “return” figure but it is based
The Value Problem
ROE measures a “return” figure but it is based
 Налоги и их классификация
 Создание финансовой службы с нуля
 Банковская система России
 Рынок криптовалют
 Анализ эффективности и интенсивности использования капитала предприятия
 Бюджет и бюджетная система РФ
 Лекция 4. Правовые основы денежной системы и валютного регулирования
 Поняття банківської таємниці. (Тема 9)
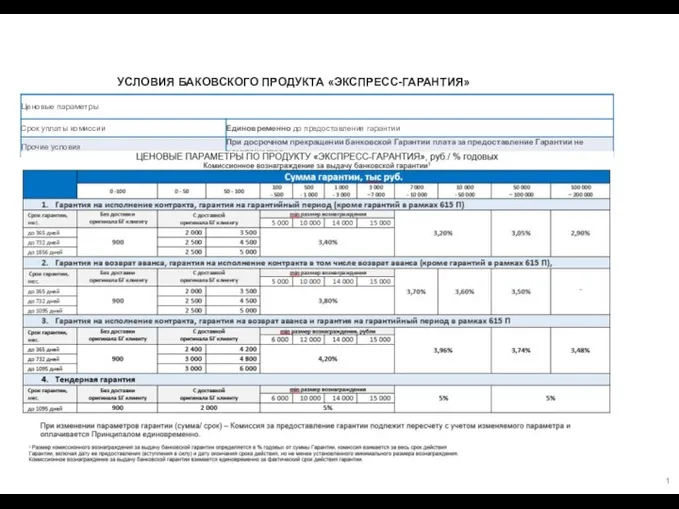 Условия баковского продукта Экспресс-гарантия
 Фінансовий ринок: сутність, функції та роль в економіці
 Мастер-класс Розничная торговля. Главные критерии успеха в офлайн-бизнесе
 Управление рисками в рамках концепции устойчивого банкинга ОАО КБ Центр-инвест Ростов-на-Дону
 Ценные бумаги
 Совершенствование финансово-хозяйственной деятельности ООО СТРОЙПРОФИ ЕКБ
 Положение по бухгалтерскому учету Доходы организации
 Почтабанк. Как не стать жертвой мошенничества
 Заимствования органами государственной власти и органами местного самоуправления на примере США
 Условия финансирования АО КазАгроФинанс на 2019 год
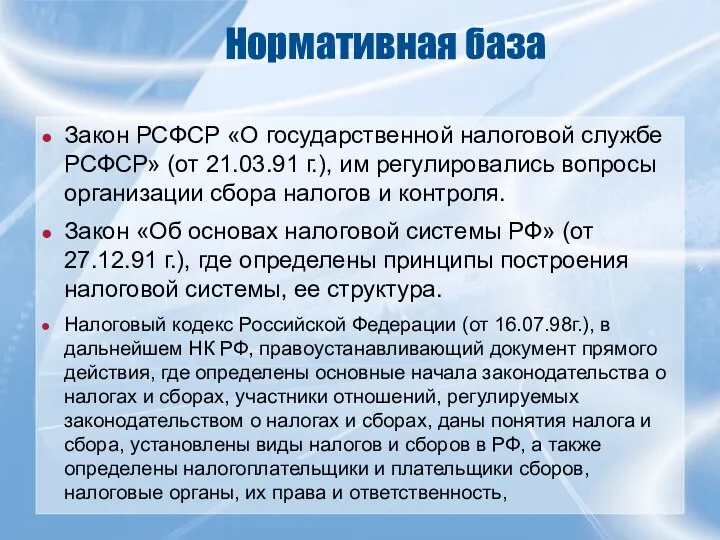 Нормативная база Закон РСФСР О государственной налоговой службе РСФСР
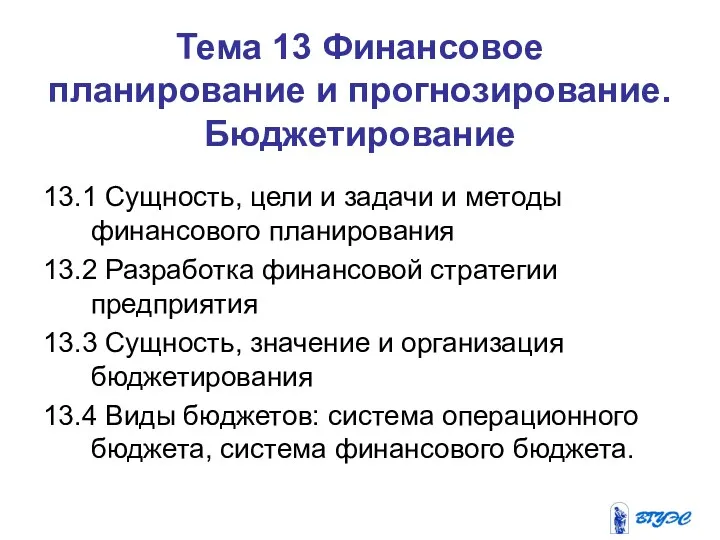 Финансовое планирование и прогнозирование. Бюджетирование
 Деньги. Понятие денег
 Понятие и признаки предпринимательской деятельности
 Кредиты. Новые условия по кредитным продуктам банка
 Внедрение системы персонифицированного финансирования в Белгородской области
 Финансовый контроль
 Грошовий, фінансовий ринок. (Тема 3)
 Финансы коммерческого предприятия и направления повышения эффективности их использования (на примере ООО УВА)
 Заработная плата: юридический аспект