- Introduction to Financial Statement Analysis. Chapter 2

Содержание
- 2. Introduction to this Chapter We will learn some bases of a firm’s financial statements We’ll then
- 3. Motivation: Why This Chapter? Some of you may find this chapter a bit ‘dry’ or ‘too
- 4. We need to understand ratios such as ‘Market cap’ or ‘PE Ratio’ Source: Yahoo! Finance
- 5. Why This Chapter? Another Reason: good for your CFA exam Contents discussed in this chapter are
- 6. Chapter Outline 2.1 Firms’ Disclosure of Financial Information 2.2 The Balance Sheet 2.3 The Income Statement
- 7. Learning Objectives List the four major financial statements required by the SEC for publicly traded firms,
- 8. Learning Objectives Discuss the uses of the DuPont identity in disaggregating ROE, and assess the impact
- 9. 2.1 Firms’ Disclosure of Financial Information
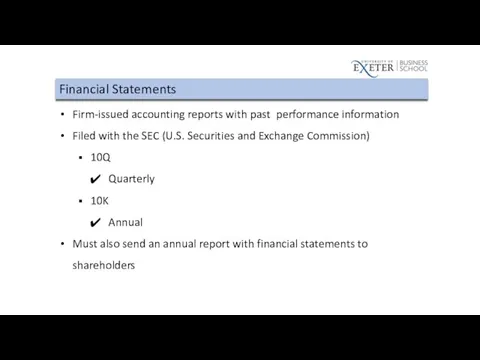
- 10. Financial Statements Firm-issued accounting reports with past performance information Filed with the SEC (U.S. Securities and
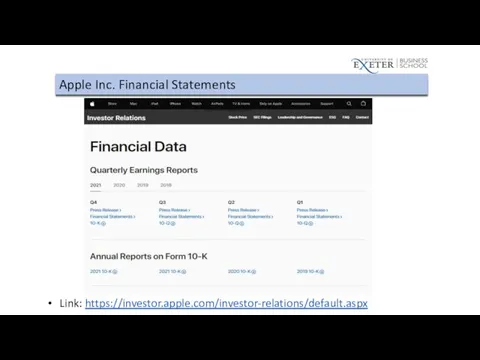
- 11. Apple Inc. Financial Statements Link: https://investor.apple.com/investor-relations/default.aspx
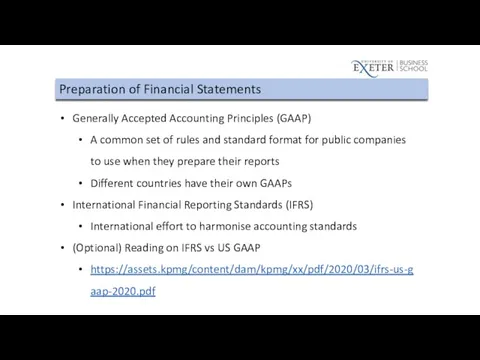
- 12. Preparation of Financial Statements Generally Accepted Accounting Principles (GAAP) A common set of rules and standard
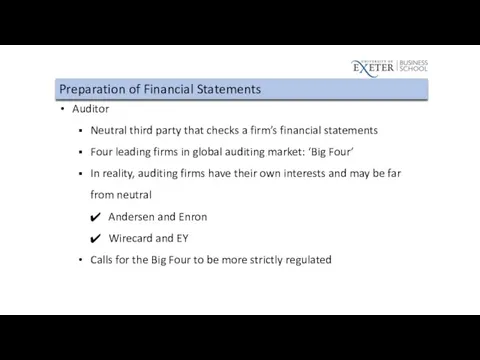
- 13. Preparation of Financial Statements Auditor Neutral third party that checks a firm’s financial statements Four leading
- 14. Optional Reading on Auditing Market and Regulation https://www.ft.com/content/96d4b090-f973-11e9-a354-36acbbb0d9b6 https://www.ft.com/content/7ad4d113-0c33-44b2-b4e4-ede47f334505 https://www.ft.com/content/d5103236-2799-4eab-bb71-afad7b703ae4 https://www.ft.com/content/4219750e-612a-11e9-a27a-fdd51850994c https://www.theguardian.com/business/2004/dec/17/europeanunion
- 15. Types of Financial Statements Balance Sheet Income Statement Statement of Cash Flows Statement of Stockholders’ Equity
- 16. Stock vs Flow A stock is measured at a specific time, and represents a quantity existing
- 17. 2.2 Balance Sheet
- 18. Balance Sheet A snapshot in time of the firm’s financial position We are looking at stocks
- 19. Table 2.1 Global Conglomerate Corporation Balance Sheet
- 20. Balance Sheet Assets What the company owns Liabilities What the company owes Stockholder’s Equity The difference
- 21. Assets Current Assets: Cash or assets expected to be turned into cash in the next year
- 22. Assets Long-Term Assets Net Property, Plant, & Equipment Depreciation (and Accumulated Depreciation) Notice that you don’t
- 23. Liabilities Current Liabilities: Due to be paid within the next year Accounts Payable Short-Term Debt/Notes Payable
- 24. Liabilities Long-Term Liabilities Long-Term Debt Capital Leases Deferred Taxes
- 25. Table 2.1 Global Conglomerate Corporation Balance Sheet
- 26. Stockholder’s Equity: Market Value Versus Book Value
- 27. Market-to-Book Ratio Also called Price-to-Book Ratio Value Stocks Low M/B ratios Growth Stocks High M/B ratios
- 28. Enterprise Value Market Capitalization measures the market value of equity What is the market value of
- 29. Textbook Example 2.1
- 30. Textbook Example 2.1
- 31. 2.3 Income Statement
- 32. Income Statement Income statement lists the firm’s revenues and expenses over a period of time So
- 33. Income Statement Reminder: net income is accounting profit (not change of cash) Net income is generally
- 34. Table 2.2 Global Conglomerate Corporation Income Statement
- 35. Example: Apple Inc. Apple’s 2021 Income Statement From its 2021 10-K Annual Report (Page 32) Link:
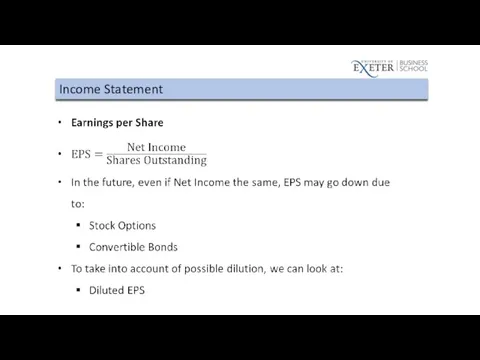
- 36. Income Statement
- 37. Complete Formula
- 38. Complete Formula of Net Income
- 39. What can Net Income be used for?
- 40. Income Statement
- 41. 2.4 Statement of Cash Flows
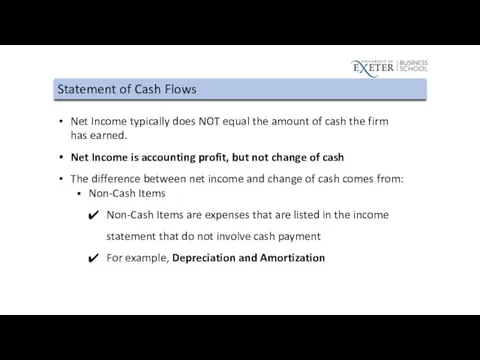
- 42. Statement of Cash Flows Net Income typically does NOT equal the amount of cash the firm
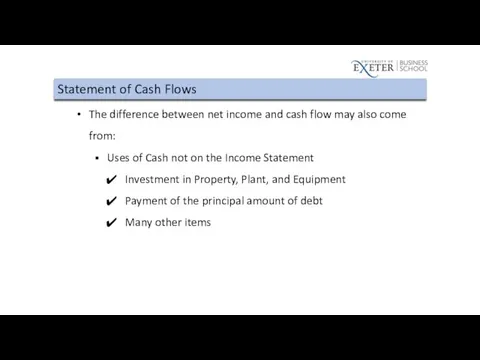
- 43. Statement of Cash Flows The difference between net income and cash flow may also come from:
- 44. Statement of Cash Flows: Three Sections Operating Activity Investment Activity Financing Activity
- 45. Operating Activity Adjusts net income by all non-cash items related to operating activities and changes in
- 46. Cash from Operating Activities
- 47. Investment Activity and Financing Activity Investment Activity Capital Expenditures Buying or Selling Marketable Securities Financing Activity
- 48. Cash from Investment Activities
- 49. Cash from Financing Activities
- 50. Change in cash and cash equivalents
- 51. Another way to calculate change in cash
- 52. Change in cash and cash equivalents
- 53. Table 2.3 Global Conglomerate Corporation Statement of Cash Flows
- 54. Table 2.1 Global Conglomerate Corporation Balance Sheet
- 55. 2.5 Other Financial Statement Information
- 56. Statement of Stockholders’ Equity
- 57. Other Financial Statement Information Management Discussion and Analysis Off-Balance Sheet Transactions Notes to the Financial Statements
- 58. Textbook Example 2.3
- 59. Textbook Example 2.3
- 60. 2.6 Financial Statement Analysis
- 61. Financial Statement Analysis Financial Statement Analysis can be used Compare the firm with itself over time
- 62. Types of Ratios Profitability Ratios Liquidity Ratios Working Capital Ratios Interest Coverage Ratios Leverage Ratios Valuation
- 63. Profitability Ratios
- 64. Figure 2.1 EBIT Margins for Five U.S. Airlines Source: Capital IQ
- 65. Liquidity Ratios Current Ratio Current Ratio=Current Assets / Current Liabilities Quick Ratio Quick Ratio=(Cash + Short-Term
- 66. Textbook Example 2.4
- 67. Table 2.1 Global Conglomerate Corporation Balance Sheet
- 68. Textbook Example 2.4
- 69. Working Capital Ratios Accounts Receivable Days Accounts Payable Days Inventory Days
- 70. Working Capital Ratios Accounts Receivable Turnover Accounts Payable Turnover Inventory Turnover
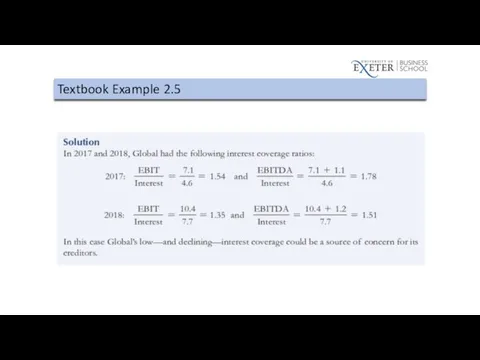
- 71. Interest Coverage Ratios EBIT/Interest EBITDA/Interest EBITDA = EBIT + Depreciation and Amortization
- 72. Textbook Example 2.5
- 73. Table 2.1 Global Conglomerate Corporation Balance Sheet
- 74. Table 2.2 Global Conglomerate Corporation Income Statement
- 75. Textbook Example 2.5
- 76. Leverage Ratios Debt-Equity Ratio Debt-to-Capital Ratio
- 77. Table 2.1 Global Conglomerate Corporation Balance Sheet
- 78. Leverage Ratios Net Debt Total Debt - Excess Cash & Short-Term Investments Debt-to-Enterprise Value Equity Multiplier
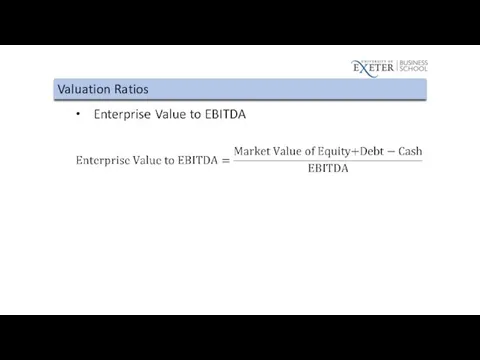
- 79. Valuation Ratios P/E Ratio Enterprise Value to EBIT Enterprise Value to Sales
- 80. Valuation Ratios
- 81. Textbook Example 2.6
- 82. Textbook Example 2.6
- 83. Operating Returns Return on Equity Return on Assets Return on Invested Capital
- 84. Textbook Example 2.7
- 85. Table 2.2 Global Conglomerate Corporation Income Statement
- 86. Textbook Example 2.7
- 87. The DuPont Identity
- 88. Textbook Example 2.8
- 89. Textbook Example 2.8
- 90. Table 2.4 Key Financial Ratios for Large U.S. Firms, Spring 2018
- 91. 2.7 (Optional) Financial Reporting in Practice
- 92. (Optional) Financial Reporting in Practice Even with safeguards, reporting abuses still happen: Enron WorldCom Sarbanes-Oxley Act
- 94. Скачать презентацию
Introduction to this Chapter
We will learn some bases of a firm’s
Introduction to this Chapter
We will learn some bases of a firm’s
Motivation: Why This Chapter?
Some of you may find this chapter a
Motivation: Why This Chapter?
Some of you may find this chapter a
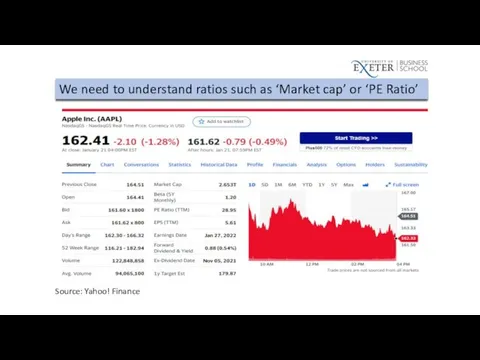
We need to understand ratios such as ‘Market cap’ or ‘PE
We need to understand ratios such as ‘Market cap’ or ‘PE
Why This Chapter?
Another Reason: good for your CFA exam
Contents discussed in
Why This Chapter?
Another Reason: good for your CFA exam
Contents discussed in
Chapter Outline
2.1 Firms’ Disclosure of Financial Information
2.2 The Balance Sheet
Chapter Outline
2.1 Firms’ Disclosure of Financial Information
2.2 The Balance Sheet
Learning Objectives
List the four major financial statements required by the SEC
Learning Objectives
List the four major financial statements required by the SEC
Learning Objectives
Discuss the uses of the DuPont identity in disaggregating ROE,
Learning Objectives
Discuss the uses of the DuPont identity in disaggregating ROE,
2.1
Firms’ Disclosure of Financial Information
2.1
Firms’ Disclosure of Financial Information
Financial Statements
Firm-issued accounting reports with past performance information
Filed with the SEC
Financial Statements
Firm-issued accounting reports with past performance information
Filed with the SEC
Apple Inc. Financial Statements
Link: https://investor.apple.com/investor-relations/default.aspx
Apple Inc. Financial Statements
Link: https://investor.apple.com/investor-relations/default.aspx
Preparation of Financial Statements
Generally Accepted Accounting Principles (GAAP)
A common set of
Preparation of Financial Statements
Generally Accepted Accounting Principles (GAAP)
A common set of
Preparation of Financial Statements
Auditor
Neutral third party that checks a firm’s financial
Preparation of Financial Statements
Auditor
Neutral third party that checks a firm’s financial
Optional Reading on Auditing Market and Regulation
https://www.ft.com/content/96d4b090-f973-11e9-a354-36acbbb0d9b6
https://www.ft.com/content/7ad4d113-0c33-44b2-b4e4-ede47f334505
https://www.ft.com/content/d5103236-2799-4eab-bb71-afad7b703ae4
https://www.ft.com/content/4219750e-612a-11e9-a27a-fdd51850994c
https://www.theguardian.com/business/2004/dec/17/europeanunion
Types of Financial Statements
Balance Sheet
Income Statement
Statement of Cash Flows
Statement of Stockholders’
Types of Financial Statements
Balance Sheet
Income Statement
Statement of Cash Flows
Statement of Stockholders’
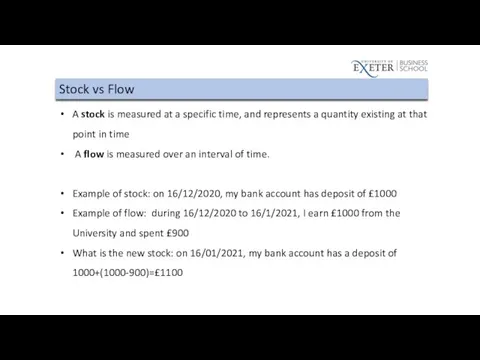
Stock vs Flow
A stock is measured at a specific time, and
Stock vs Flow
A stock is measured at a specific time, and
2.2
Balance Sheet
2.2
Balance Sheet
Balance Sheet
A snapshot in time of the firm’s financial position
We are
Balance Sheet
A snapshot in time of the firm’s financial position
We are
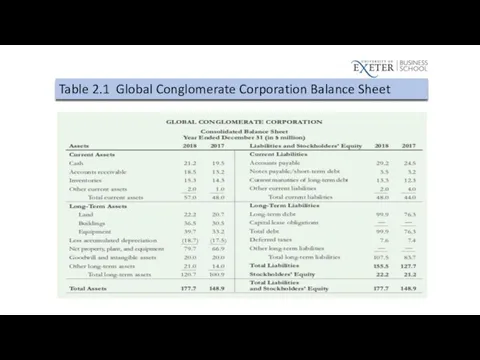
Table 2.1 Global Conglomerate Corporation Balance Sheet
Table 2.1 Global Conglomerate Corporation Balance Sheet
Balance Sheet
Assets
What the company owns
Liabilities
What the company owes
Stockholder’s Equity
The difference between
Balance Sheet
Assets
What the company owns
Liabilities
What the company owes
Stockholder’s Equity
The difference between
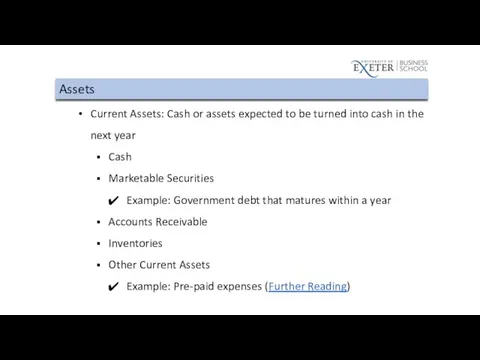
Assets
Current Assets: Cash or assets expected to be turned into cash
Assets
Current Assets: Cash or assets expected to be turned into cash
Assets
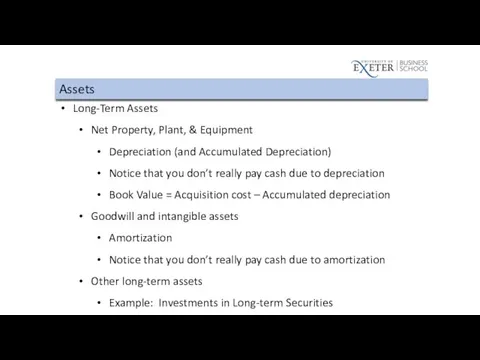
Long-Term Assets
Net Property, Plant, & Equipment
Depreciation (and Accumulated Depreciation)
Notice that you
Assets
Long-Term Assets
Net Property, Plant, & Equipment
Depreciation (and Accumulated Depreciation)
Notice that you
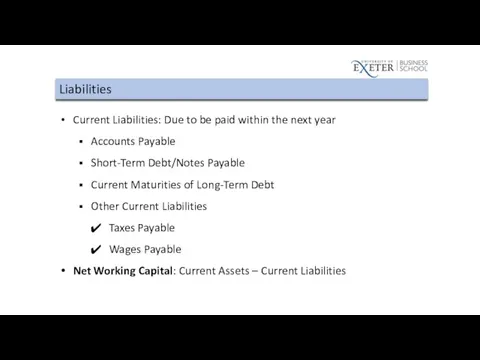
Liabilities
Current Liabilities: Due to be paid within the next year
Accounts Payable
Short-Term
Liabilities
Current Liabilities: Due to be paid within the next year
Accounts Payable
Short-Term
Liabilities
Long-Term Liabilities
Long-Term Debt
Capital Leases
Deferred Taxes
Liabilities
Long-Term Liabilities
Long-Term Debt
Capital Leases
Deferred Taxes

Table 2.1 Global Conglomerate Corporation Balance Sheet
Table 2.1 Global Conglomerate Corporation Balance Sheet
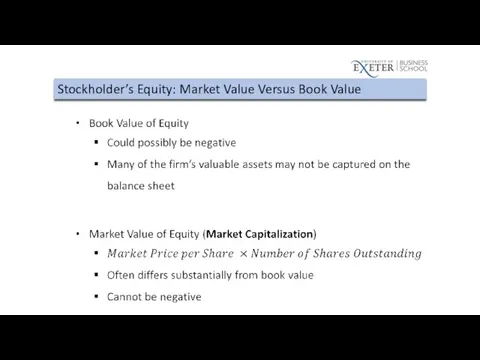
Stockholder’s Equity: Market Value Versus Book Value
Stockholder’s Equity: Market Value Versus Book Value
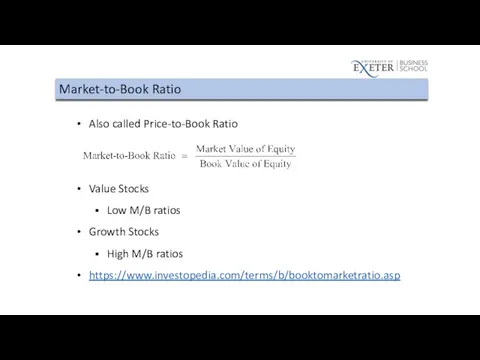
Market-to-Book Ratio
Also called Price-to-Book Ratio
Value Stocks
Low M/B ratios
Growth Stocks
High M/B
Market-to-Book Ratio
Also called Price-to-Book Ratio
Value Stocks
Low M/B ratios
Growth Stocks
High M/B
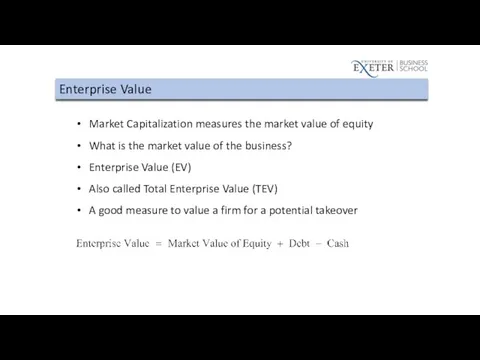
Enterprise Value
Market Capitalization measures the market value of equity
What is the
Enterprise Value
Market Capitalization measures the market value of equity
What is the
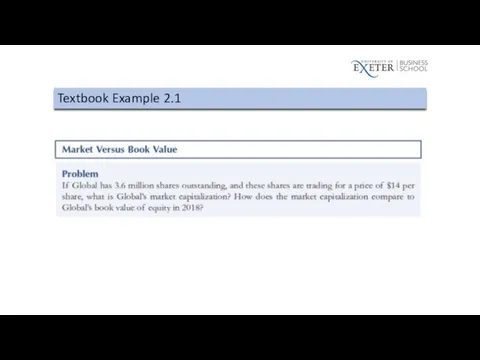
Textbook Example 2.1
Textbook Example 2.1
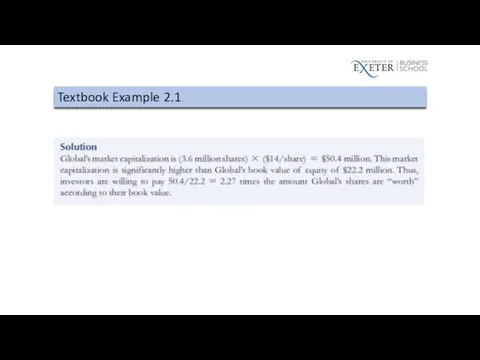
Textbook Example 2.1
Textbook Example 2.1
2.3
Income Statement
2.3
Income Statement
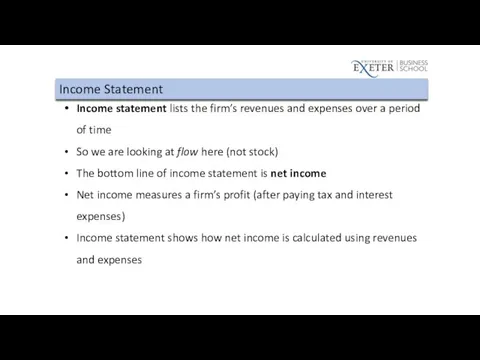
Income Statement
Income statement lists the firm’s revenues and expenses over a
Income Statement
Income statement lists the firm’s revenues and expenses over a
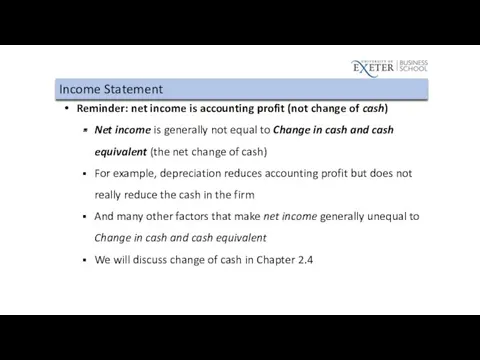
Income Statement
Reminder: net income is accounting profit (not change of cash)
Net
Income Statement
Reminder: net income is accounting profit (not change of cash)
Net

Table 2.2 Global Conglomerate Corporation Income Statement
Table 2.2 Global Conglomerate Corporation Income Statement
Example: Apple Inc.
Apple’s 2021 Income Statement
From its 2021 10-K Annual Report
Example: Apple Inc.
Apple’s 2021 Income Statement
From its 2021 10-K Annual Report
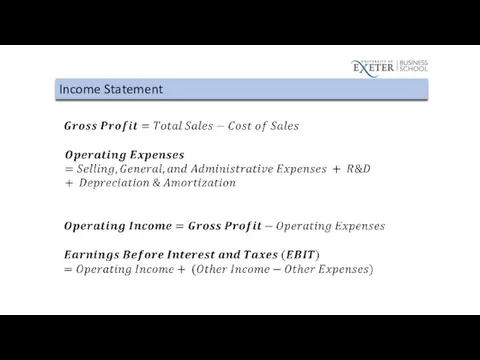
Income Statement
Income Statement
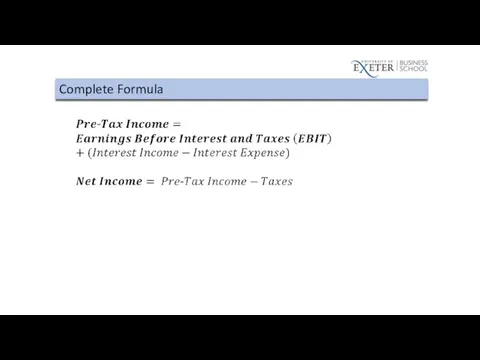
Complete Formula
Complete Formula
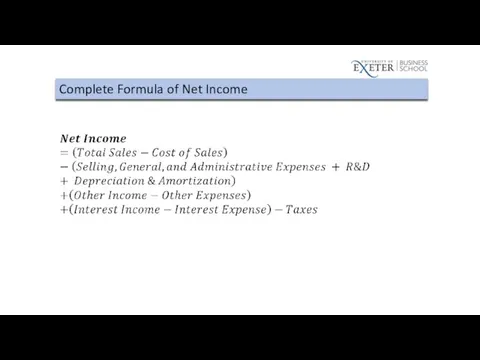
Complete Formula of Net Income
Complete Formula of Net Income
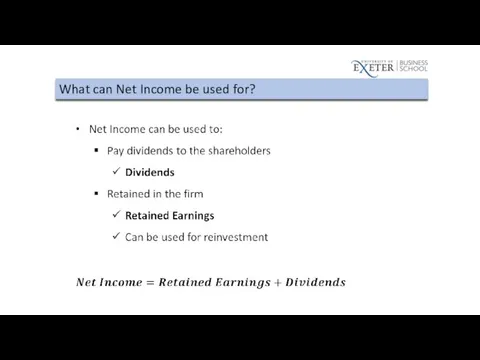
What can Net Income be used for?
What can Net Income be used for?
Income Statement
Income Statement
2.4
Statement of Cash Flows
2.4
Statement of Cash Flows
Statement of Cash Flows
Net Income typically does NOT equal the amount
Statement of Cash Flows
Net Income typically does NOT equal the amount
Statement of Cash Flows
The difference between net income and cash flow
Statement of Cash Flows
The difference between net income and cash flow
Statement of Cash Flows: Three Sections
Operating Activity
Investment Activity
Financing Activity
Statement of Cash Flows: Three Sections
Operating Activity
Investment Activity
Financing Activity
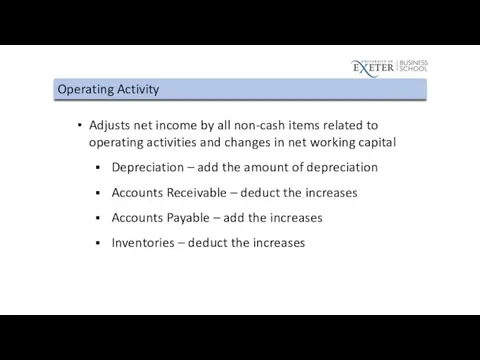
Operating Activity
Adjusts net income by all non-cash items related to operating
Operating Activity
Adjusts net income by all non-cash items related to operating
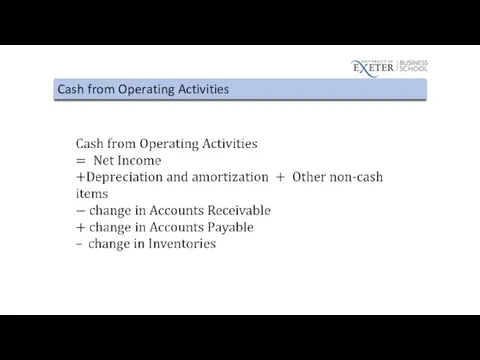
Cash from Operating Activities
Cash from Operating Activities
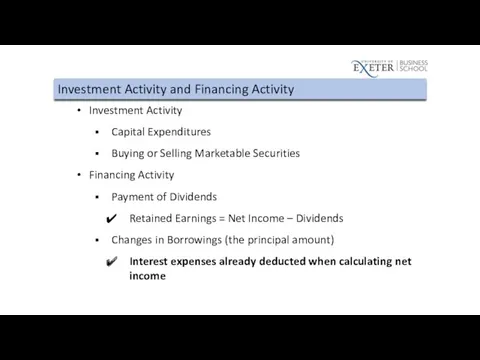
Investment Activity and Financing Activity
Investment Activity
Capital Expenditures
Buying or Selling Marketable
Investment Activity and Financing Activity
Investment Activity
Capital Expenditures
Buying or Selling Marketable
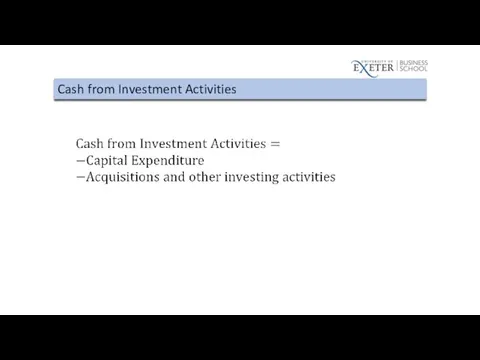
Cash from Investment Activities
Cash from Investment Activities
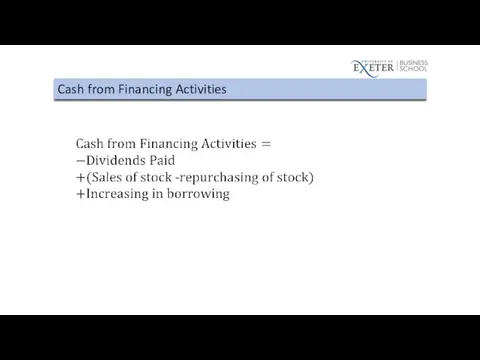
Cash from Financing Activities
Cash from Financing Activities
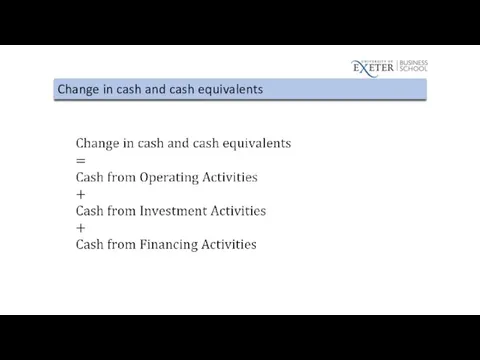
Change in cash and cash equivalents
Change in cash and cash equivalents
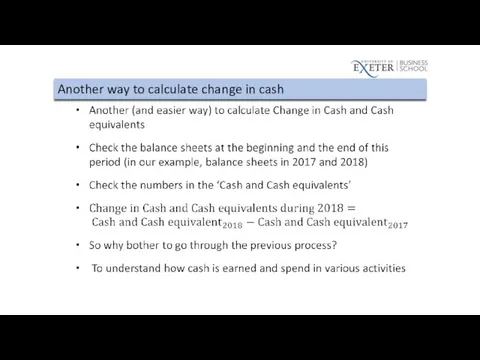
Another way to calculate change in cash
Another way to calculate change in cash
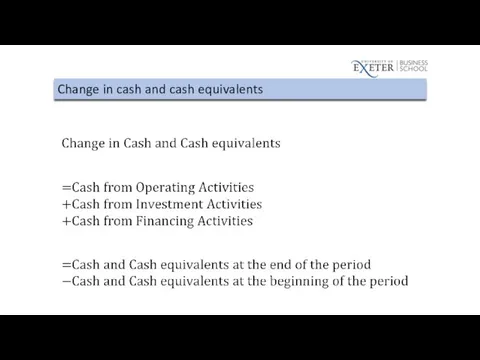
Change in cash and cash equivalents
Change in cash and cash equivalents
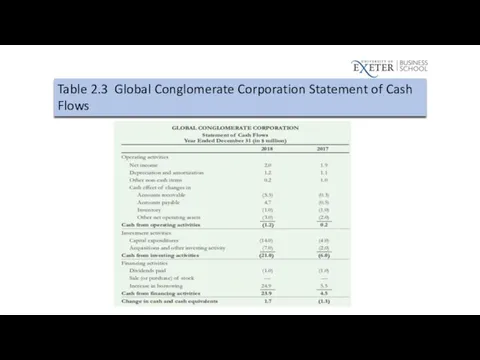
Table 2.3 Global Conglomerate Corporation Statement of Cash Flows
Table 2.3 Global Conglomerate Corporation Statement of Cash Flows

Table 2.1 Global Conglomerate Corporation Balance Sheet
Table 2.1 Global Conglomerate Corporation Balance Sheet
2.5 Other Financial Statement Information
2.5 Other Financial Statement Information
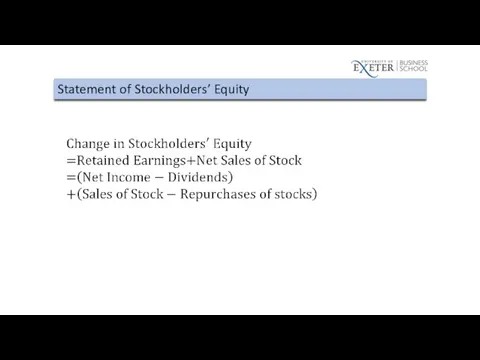
Statement of Stockholders’ Equity
Statement of Stockholders’ Equity
Other Financial Statement Information
Management Discussion and Analysis
Off-Balance Sheet Transactions
Notes to the
Other Financial Statement Information
Management Discussion and Analysis
Off-Balance Sheet Transactions
Notes to the
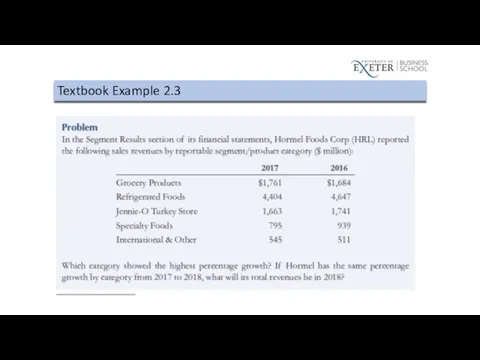
Textbook Example 2.3
Textbook Example 2.3
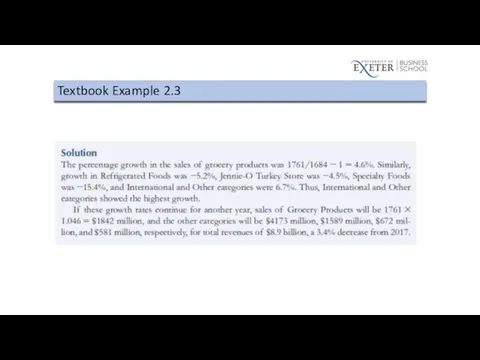
Textbook Example 2.3
Textbook Example 2.3
2.6
Financial Statement Analysis
2.6
Financial Statement Analysis
Financial Statement Analysis
Financial Statement Analysis can be used
Compare the firm
Financial Statement Analysis
Financial Statement Analysis can be used
Compare the firm
Types of Ratios
Profitability Ratios
Liquidity Ratios
Working Capital Ratios
Interest Coverage Ratios
Leverage Ratios
Valuation Ratios
Operating
Types of Ratios
Profitability Ratios
Liquidity Ratios
Working Capital Ratios
Interest Coverage Ratios
Leverage Ratios
Valuation Ratios
Operating
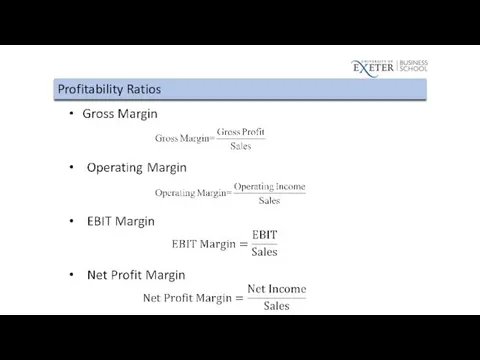
Profitability Ratios
Profitability Ratios
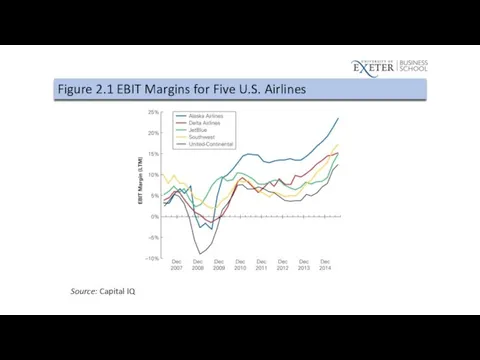
Figure 2.1 EBIT Margins for Five U.S. Airlines
Source: Capital IQ
Figure 2.1 EBIT Margins for Five U.S. Airlines
Source: Capital IQ
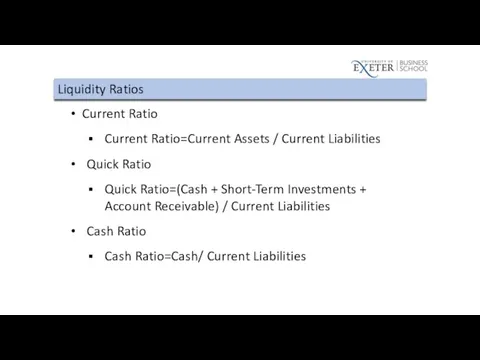
Liquidity Ratios
Current Ratio
Current Ratio=Current Assets / Current Liabilities
Quick Ratio
Quick Ratio=(Cash +
Liquidity Ratios
Current Ratio
Current Ratio=Current Assets / Current Liabilities
Quick Ratio
Quick Ratio=(Cash +
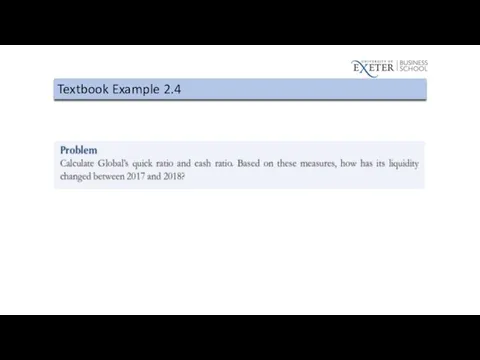
Textbook Example 2.4
Textbook Example 2.4

Table 2.1 Global Conglomerate Corporation Balance Sheet
Table 2.1 Global Conglomerate Corporation Balance Sheet
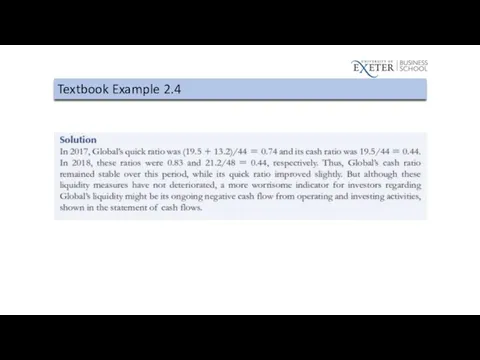
Textbook Example 2.4
Textbook Example 2.4
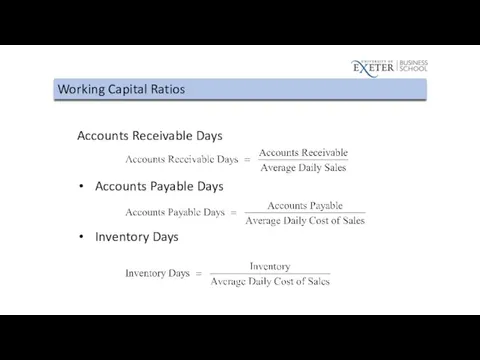
Working Capital Ratios
Accounts Receivable Days
Accounts Payable Days
Inventory Days
Working Capital Ratios
Accounts Receivable Days
Accounts Payable Days
Inventory Days
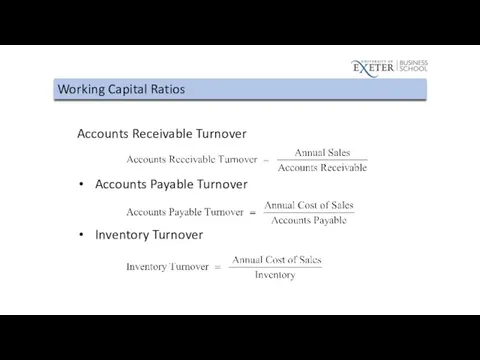
Working Capital Ratios
Accounts Receivable Turnover
Accounts Payable Turnover
Inventory Turnover
Working Capital Ratios
Accounts Receivable Turnover
Accounts Payable Turnover
Inventory Turnover
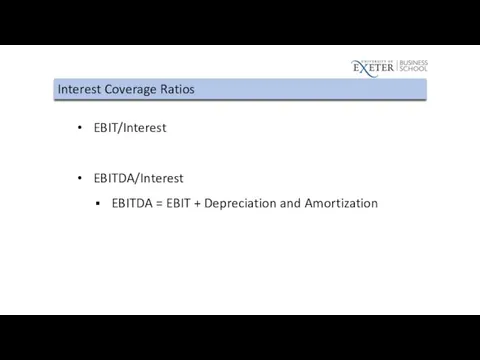
Interest Coverage Ratios
EBIT/Interest
EBITDA/Interest
EBITDA = EBIT + Depreciation and Amortization
Interest Coverage Ratios
EBIT/Interest
EBITDA/Interest
EBITDA = EBIT + Depreciation and Amortization
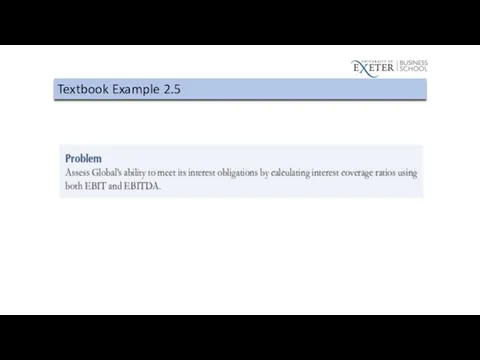
Textbook Example 2.5
Textbook Example 2.5
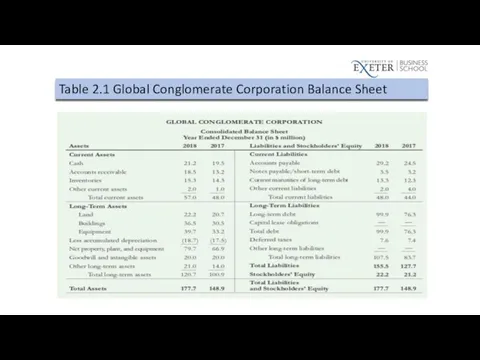
Table 2.1 Global Conglomerate Corporation Balance Sheet
Table 2.1 Global Conglomerate Corporation Balance Sheet
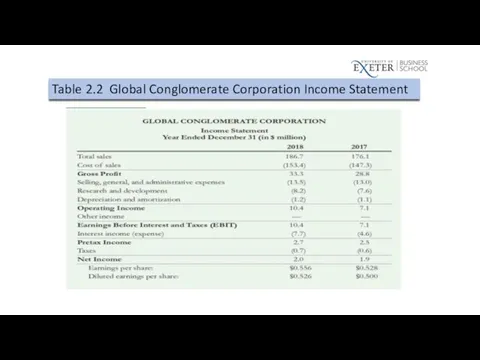
Table 2.2 Global Conglomerate Corporation Income Statement
Table 2.2 Global Conglomerate Corporation Income Statement
Textbook Example 2.5
Textbook Example 2.5
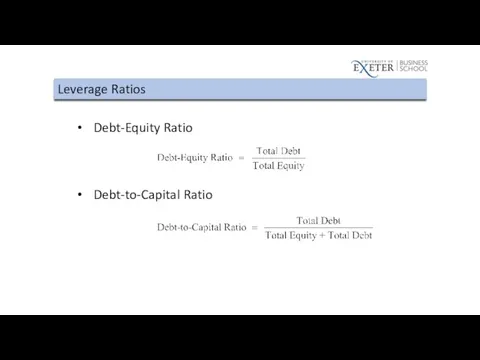
Leverage Ratios
Debt-Equity Ratio
Debt-to-Capital Ratio
Leverage Ratios
Debt-Equity Ratio
Debt-to-Capital Ratio

Table 2.1 Global Conglomerate Corporation Balance Sheet
Table 2.1 Global Conglomerate Corporation Balance Sheet
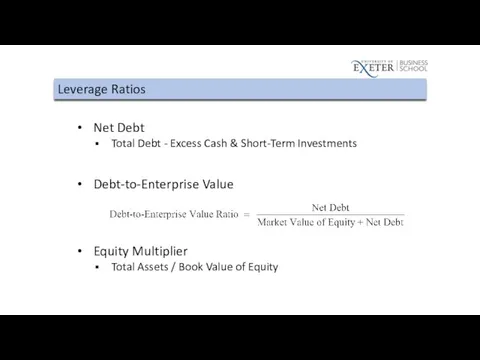
Leverage Ratios
Net Debt
Total Debt - Excess Cash & Short-Term Investments
Debt-to-Enterprise Value
Equity
Leverage Ratios
Net Debt
Total Debt - Excess Cash & Short-Term Investments
Debt-to-Enterprise Value
Equity
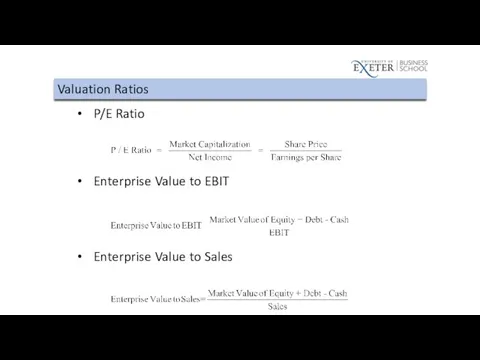
Valuation Ratios
P/E Ratio
Enterprise Value to EBIT
Enterprise Value to Sales
Valuation Ratios
P/E Ratio
Enterprise Value to EBIT
Enterprise Value to Sales
Valuation Ratios
Valuation Ratios
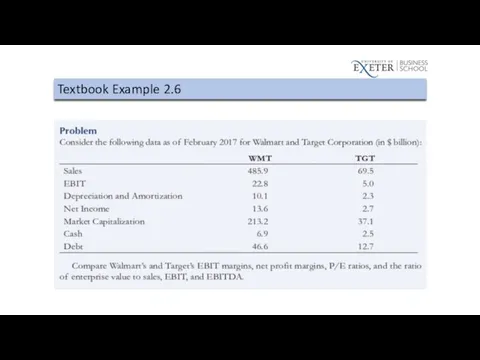
Textbook Example 2.6
Textbook Example 2.6
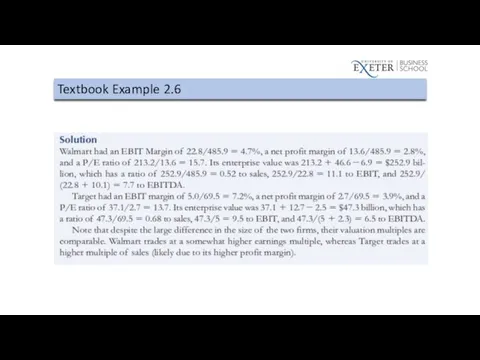
Textbook Example 2.6
Textbook Example 2.6
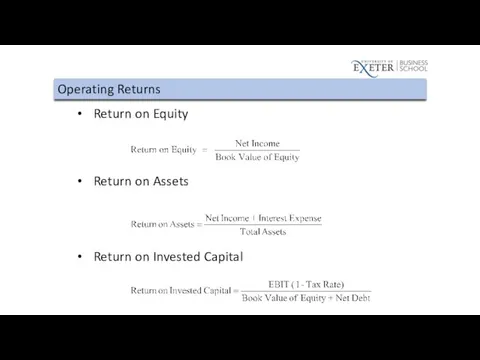
Operating Returns
Return on Equity
Return on Assets
Return on Invested Capital
Operating Returns
Return on Equity
Return on Assets
Return on Invested Capital
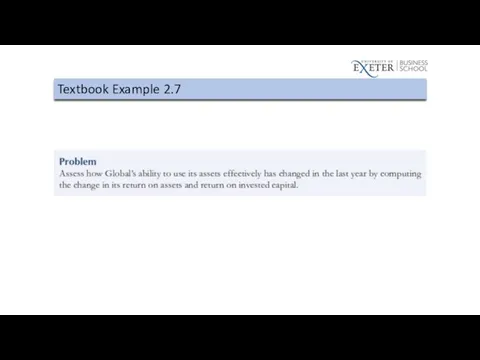
Textbook Example 2.7
Textbook Example 2.7

Table 2.2 Global Conglomerate Corporation Income Statement
Table 2.2 Global Conglomerate Corporation Income Statement
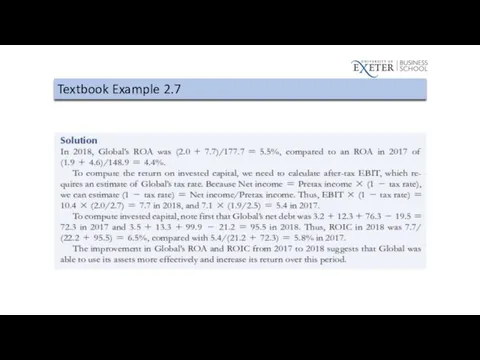
Textbook Example 2.7
Textbook Example 2.7
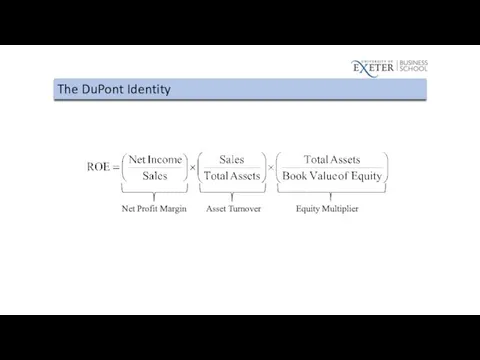
The DuPont Identity
The DuPont Identity
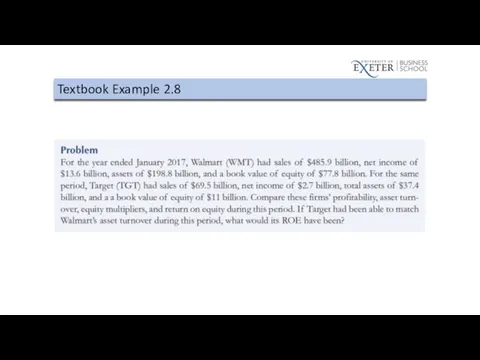
Textbook Example 2.8
Textbook Example 2.8
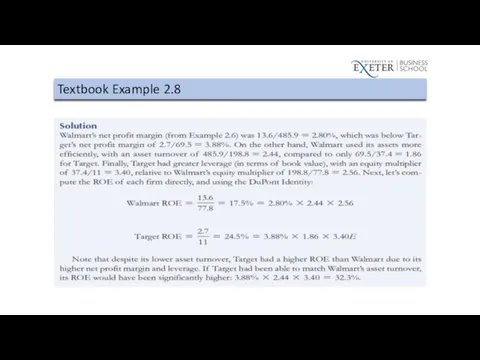
Textbook Example 2.8
Textbook Example 2.8
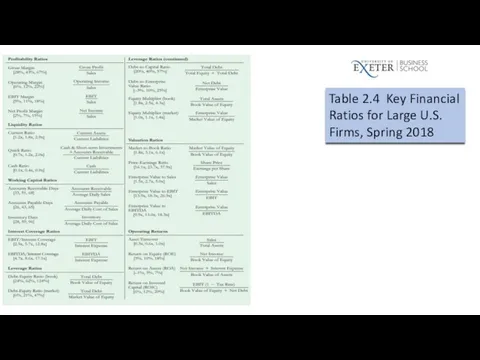
Table 2.4 Key Financial Ratios for Large U.S. Firms, Spring 2018
Table 2.4 Key Financial Ratios for Large U.S. Firms, Spring 2018
2.7 (Optional)
Financial Reporting in Practice
2.7 (Optional)
Financial Reporting in Practice
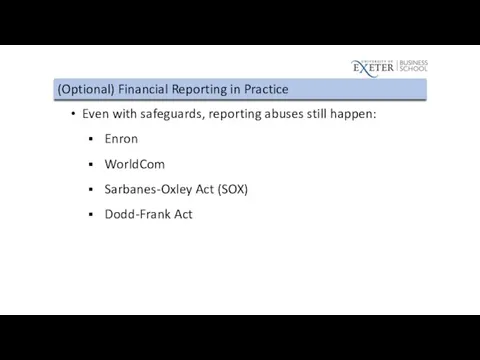
(Optional) Financial Reporting in Practice
Even with safeguards, reporting abuses still happen:
Enron
WorldCom
Sarbanes-Oxley
(Optional) Financial Reporting in Practice
Even with safeguards, reporting abuses still happen:
Enron
WorldCom
Sarbanes-Oxley
Похожие презентации
 Основной капитал компании. Инвестиции
 Роль НБУ у регулюванні грошової маси
 Приложение к аудиторскому заключению
 Сектор доставки банковских продуктов проект. Система мотивации специалистов по доставке
 Бухгалтерский учет
 Инвестиционный климат России и инвестиционная привлекательность
 Роль и границы кредита. Роль кредита и его функции
 Теоретичні засади ринку фінансових послуг. Його роль в економіці України
 Финансовая составляющая социально значимого проекта. Типичные ошибки при составлении сметы проекта
 Оценка стоимости земли и природных ресурсов
 Анализ финансового состояния коммерческого банка (на примере ОАО КБ Пойдем)
 Семинар для потенциальных предпринимателей Повышение уровня финансовой грамотности населения Ставропольского края
 Страхование
 Финансовая система Нидерландов
 Організація процесу аудиторської перевірки фінансової звітності та її інформаційного забезпечення
 Долевые ценные бумаги. (Тема 3)
 Инструменты поддержки малого и среднего предпринимательства
 Анализ рынка жилой недвижимости
 Деньги, их функции
 Продажа программы Идеальный заемщик
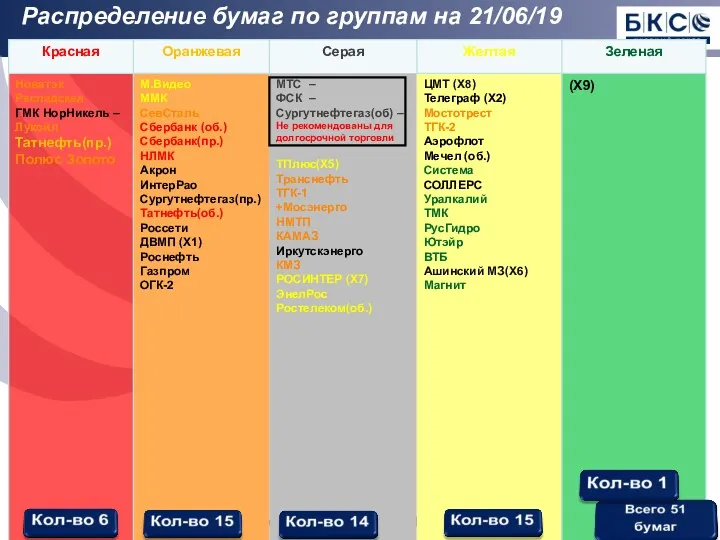 Распределение бумаг по группам
 Понятие стоимости жизненного цикла. Тема 2
 Об основных направлениях бюджетной политики и налоговой политики Ефремово-Степановского сельского поселения на 2018-2020
 Инструменты поддержки стартапов
 Эффективность деятельности компании
 Range market. Торговля в боковом тренде
 Учет, аудит и анализ товарных операций в торговле