- Analyzing missing data

Содержание
- 2. Missing data and data analysis Missing data is a problem in multivariate data because a case
- 3. Tools for evaluating missing data SPSS has a specific package for evaluating missing data, but it
- 4. Key issues in missing data analysis We will focus on two key issues for evaluating missing
- 5. Benchmark for evaluating missing data The text suggests that, in general, if no more than 5%
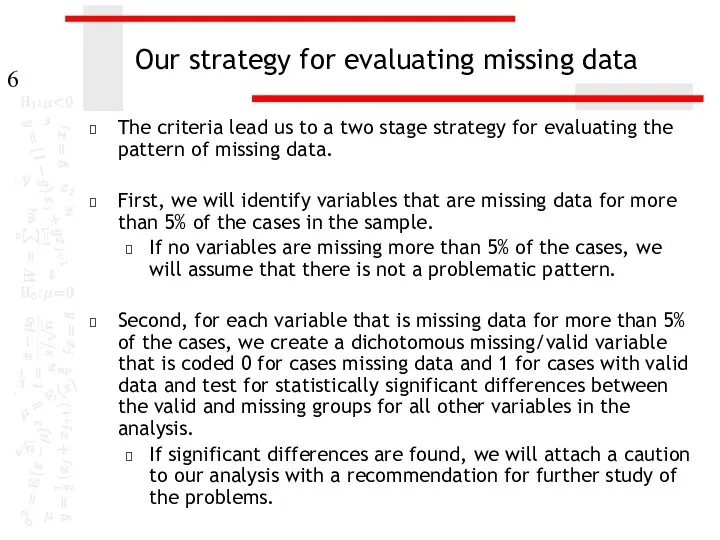
- 6. Our strategy for evaluating missing data The criteria lead us to a two stage strategy for
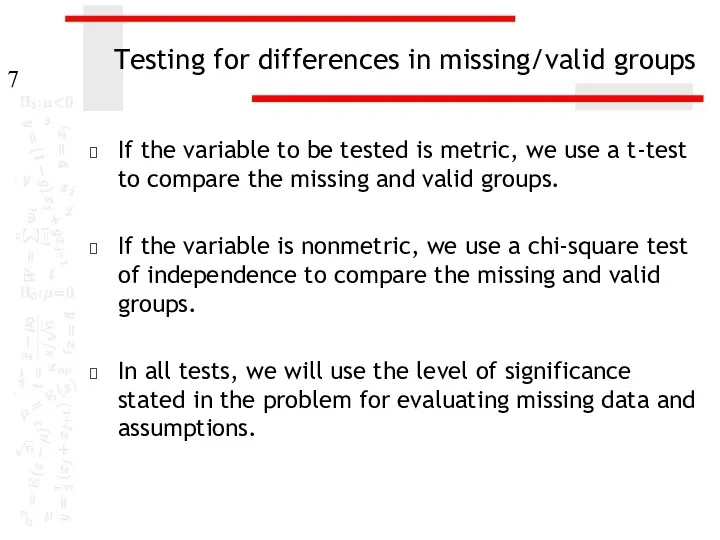
- 7. Testing for differences in missing/valid groups If the variable to be tested is metric, we use
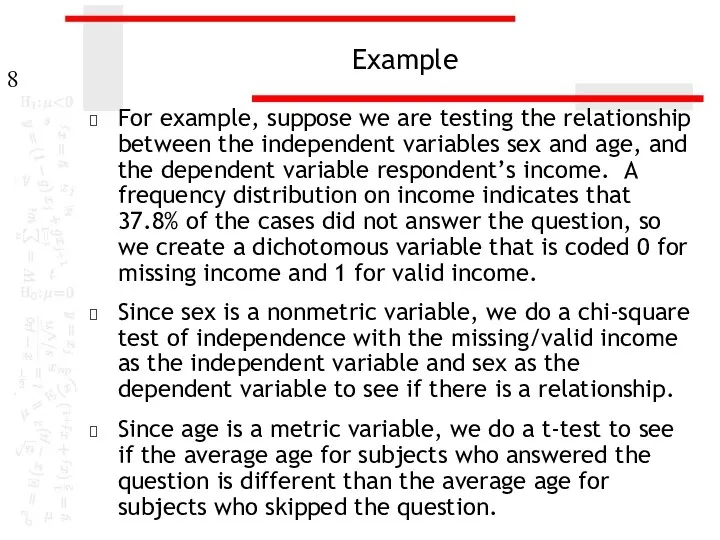
- 8. Example For example, suppose we are testing the relationship between the independent variables sex and age,
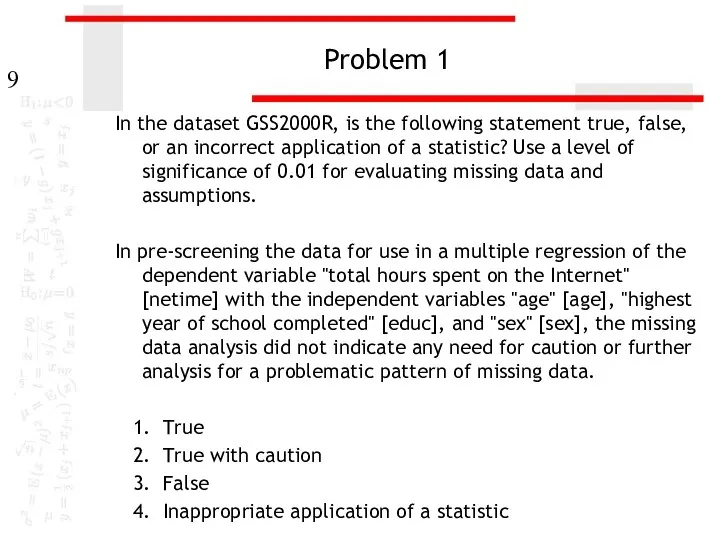
- 9. Problem 1 In the dataset GSS2000R, is the following statement true, false, or an incorrect application
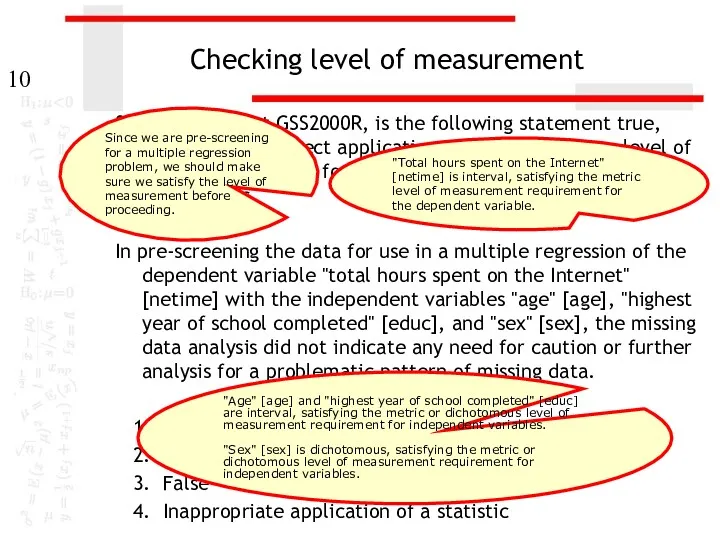
- 10. Checking level of measurement 9. In the dataset GSS2000R, is the following statement true, false, or
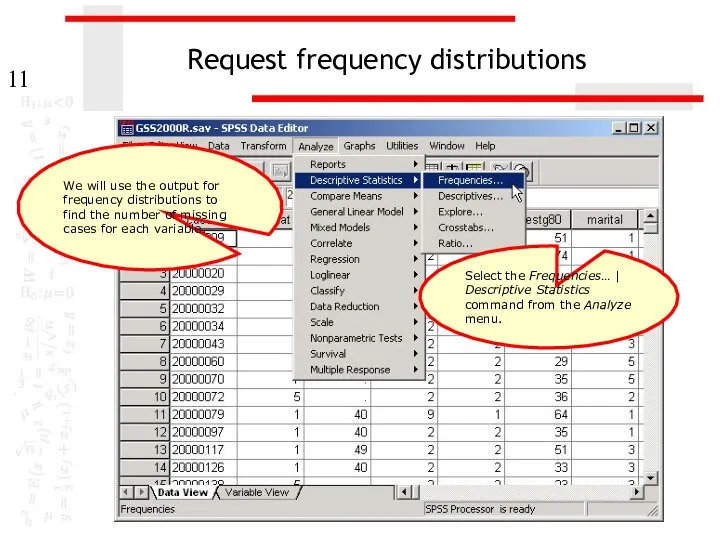
- 11. Request frequency distributions We will use the output for frequency distributions to find the number of
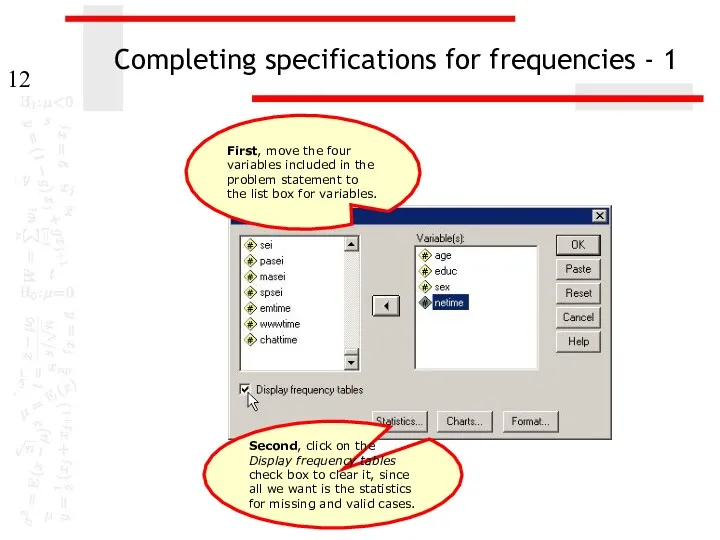
- 12. Completing specifications for frequencies - 1 Second, click on the Display frequency tables check box to
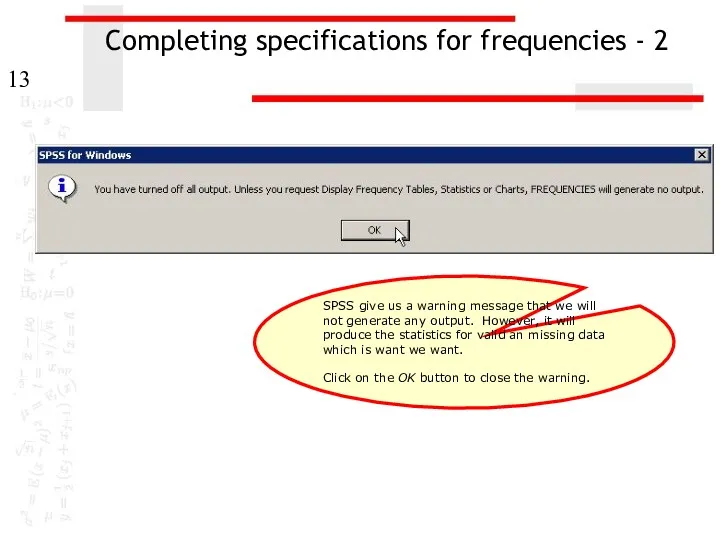
- 13. Completing specifications for frequencies - 2 SPSS give us a warning message that we will not
- 14. Completing specifications for frequencies - 3 The specifications are complete, so we click on the OK
- 15. Number of missing cases for each variable - 1 With 270 cases in the data set,
- 16. Number of missing cases for each variable - 2 With 270 cases in the data set,
- 17. Creating the missing/valid variable - 1 First, select the Recode | Into Different Variables… command from
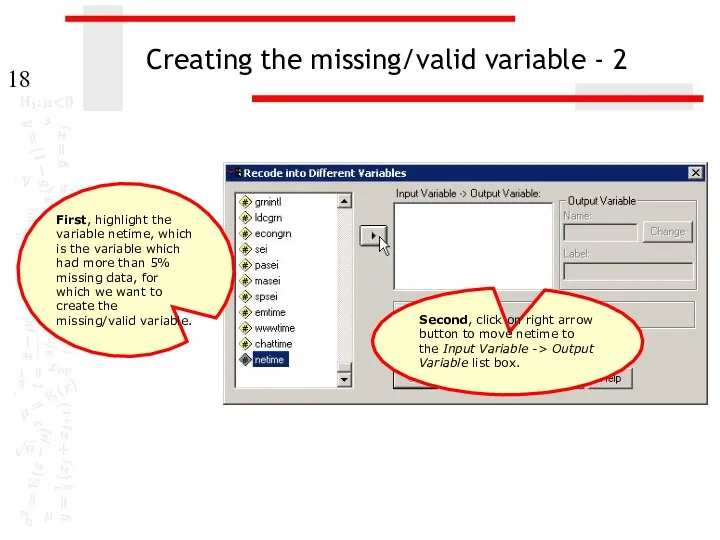
- 18. Creating the missing/valid variable - 2 Second, click on right arrow button to move netime to
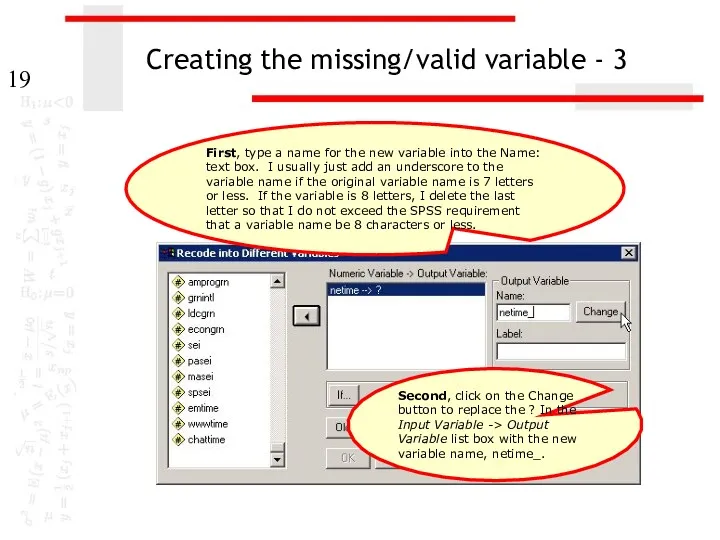
- 19. Creating the missing/valid variable - 3 Second, click on the Change button to replace the ?
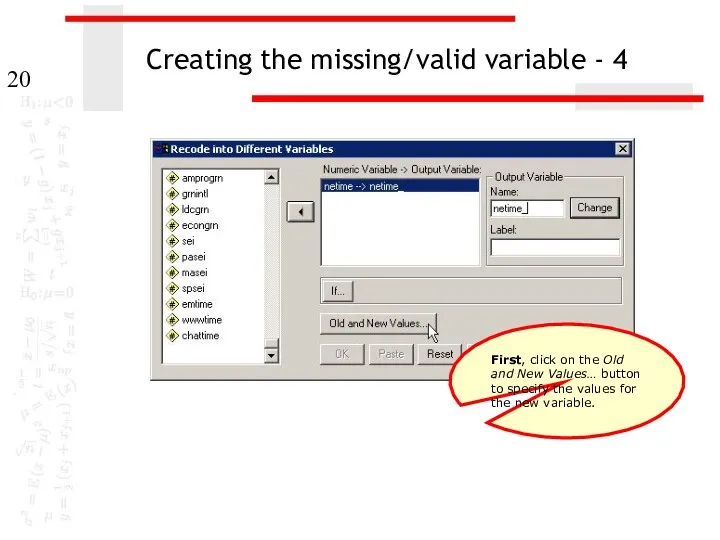
- 20. Creating the missing/valid variable - 4 First, click on the Old and New Values… button to
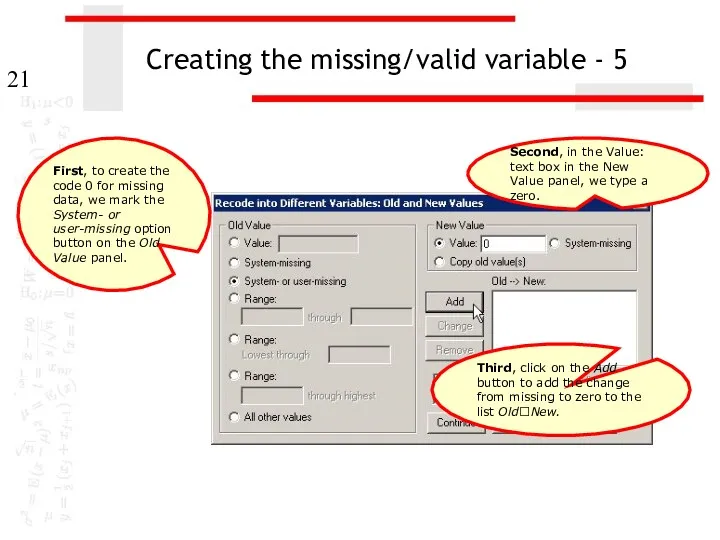
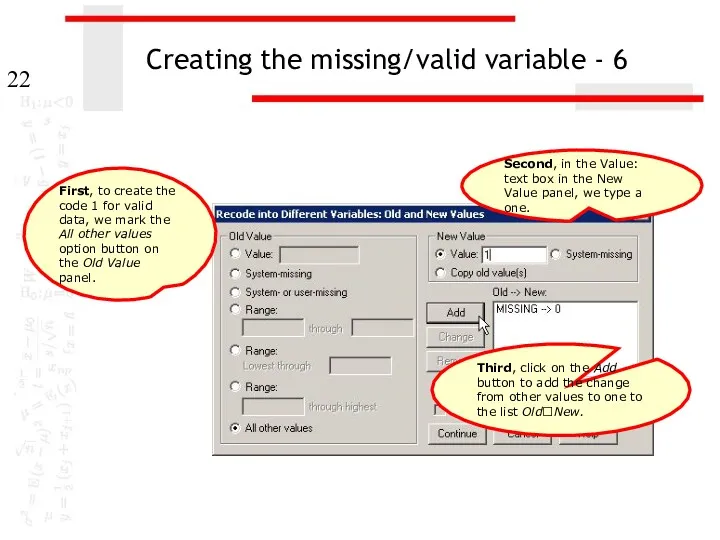
- 21. Creating the missing/valid variable - 5 Second, in the Value: text box in the New Value
- 22. Creating the missing/valid variable - 6 Second, in the Value: text box in the New Value
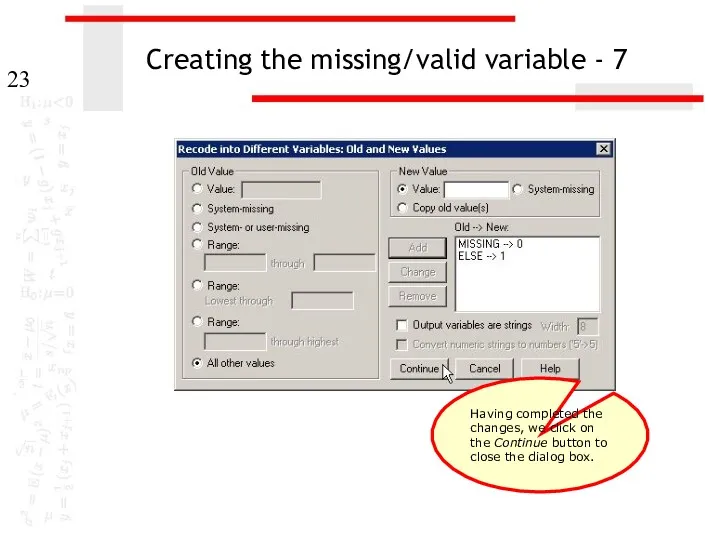
- 23. Creating the missing/valid variable - 7 Having completed the changes, we click on the Continue button
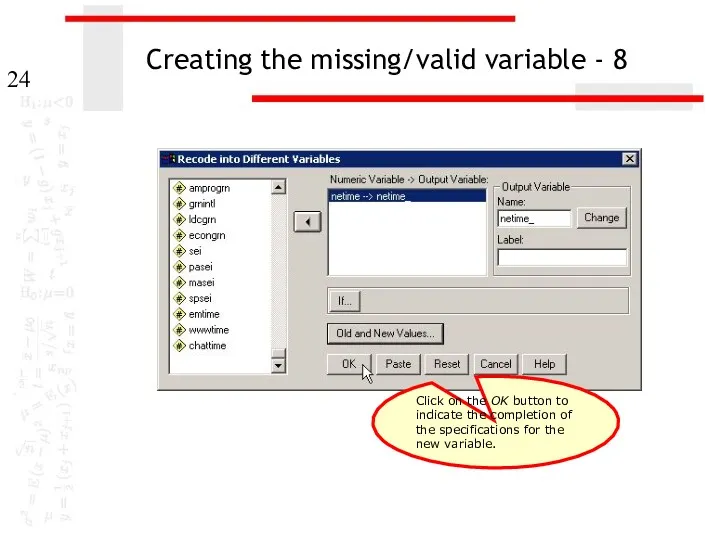
- 24. Creating the missing/valid variable - 8 Click on the OK button to indicate the completion of
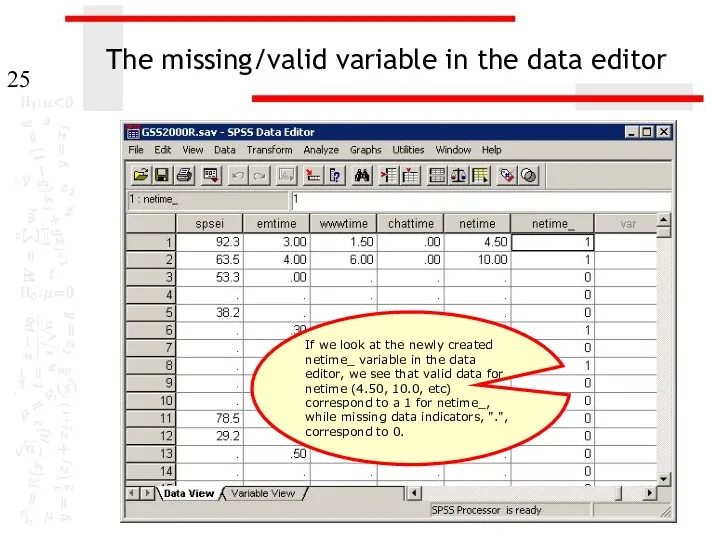
- 25. The missing/valid variable in the data editor If we look at the newly created netime_ variable
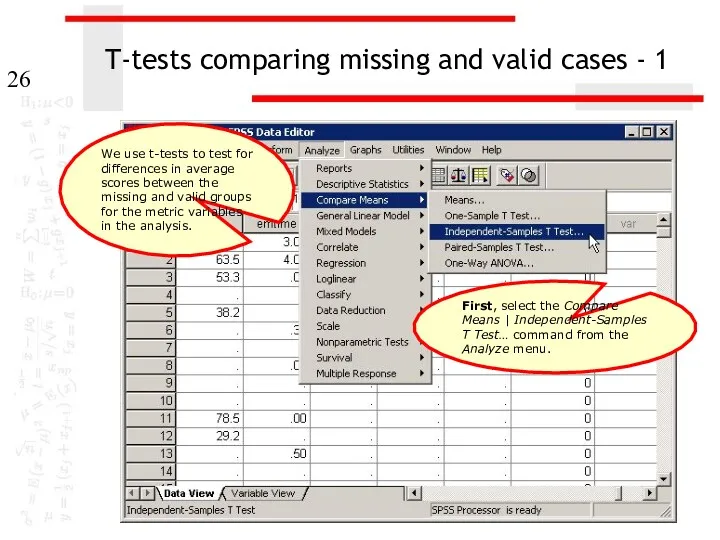
- 26. T-tests comparing missing and valid cases - 1 First, select the Compare Means | Independent-Samples T
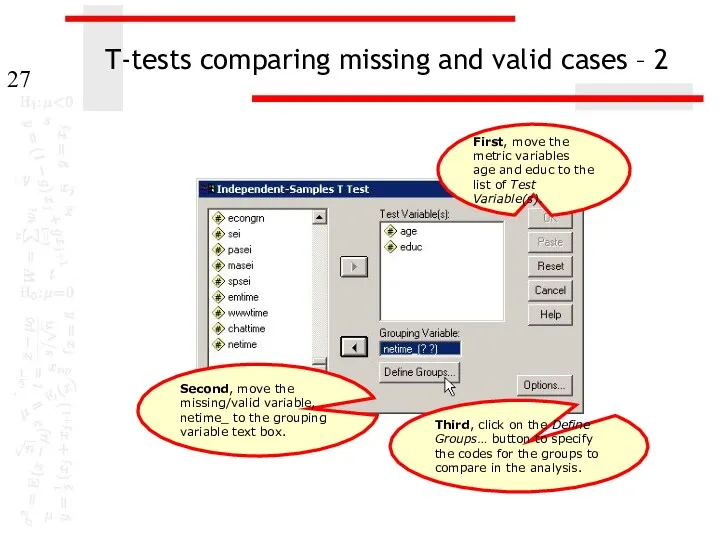
- 27. T-tests comparing missing and valid cases – 2 Second, move the missing/valid variable, netime_ to the
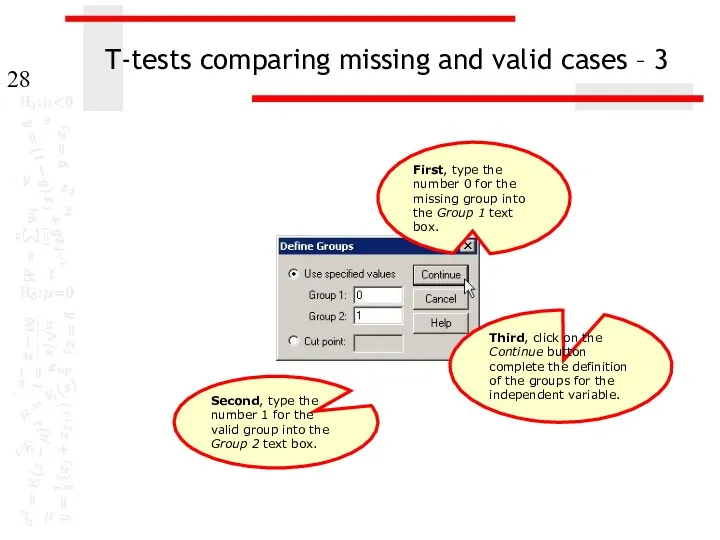
- 28. T-tests comparing missing and valid cases – 3 First, type the number 0 for the missing
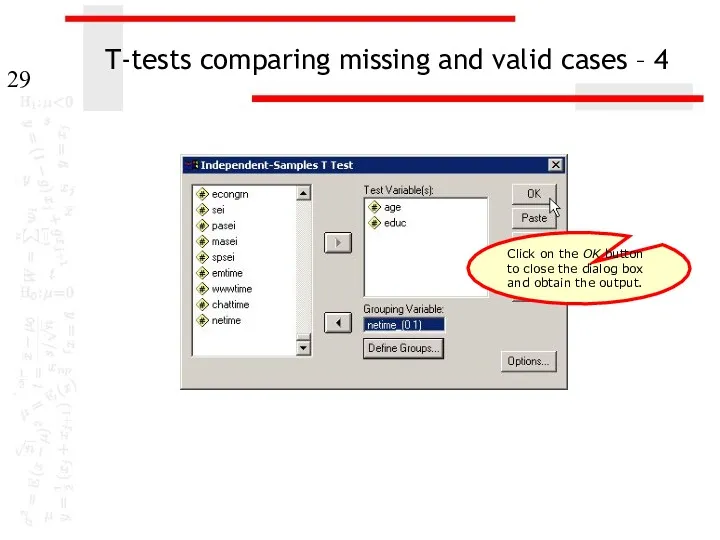
- 29. T-tests comparing missing and valid cases – 4 Click on the OK button to close the
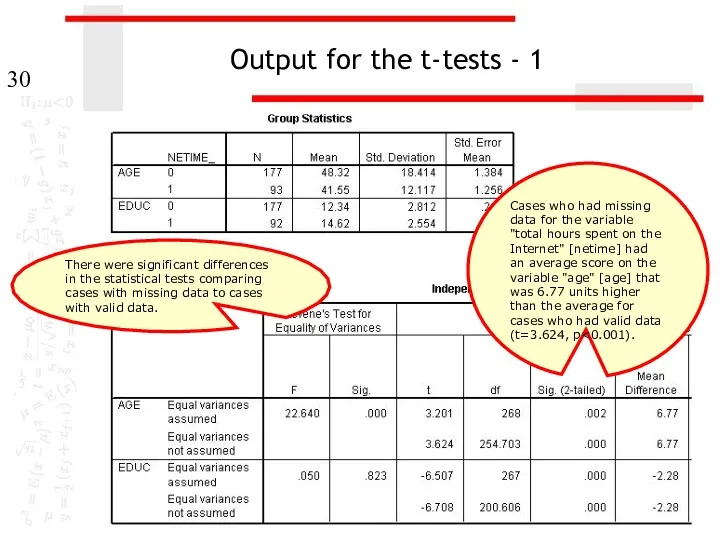
- 30. Output for the t-tests - 1 Cases who had missing data for the variable "total hours
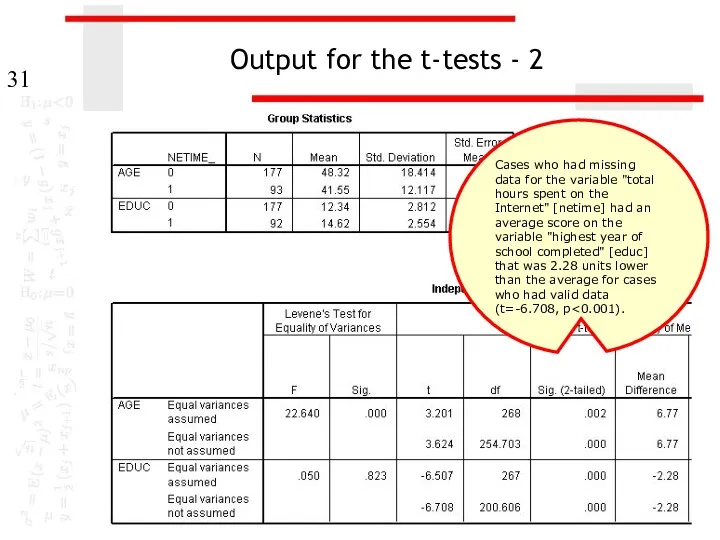
- 31. Output for the t-tests - 2 Cases who had missing data for the variable "total hours
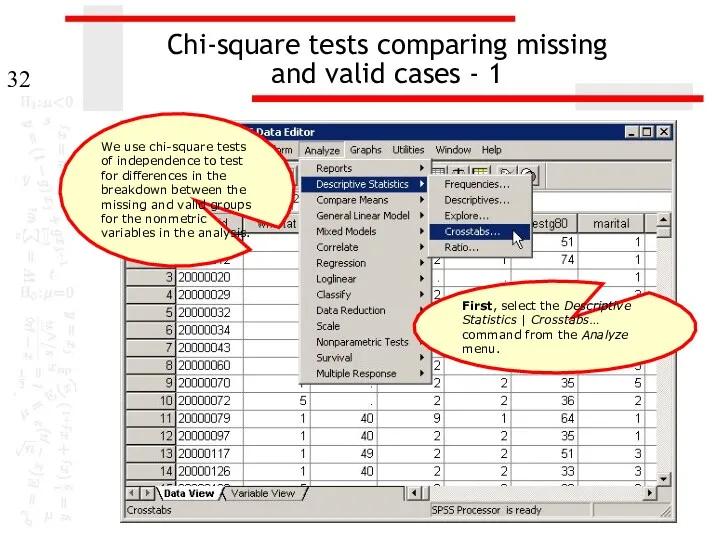
- 32. Chi-square tests comparing missing and valid cases - 1 First, select the Descriptive Statistics | Crosstabs…
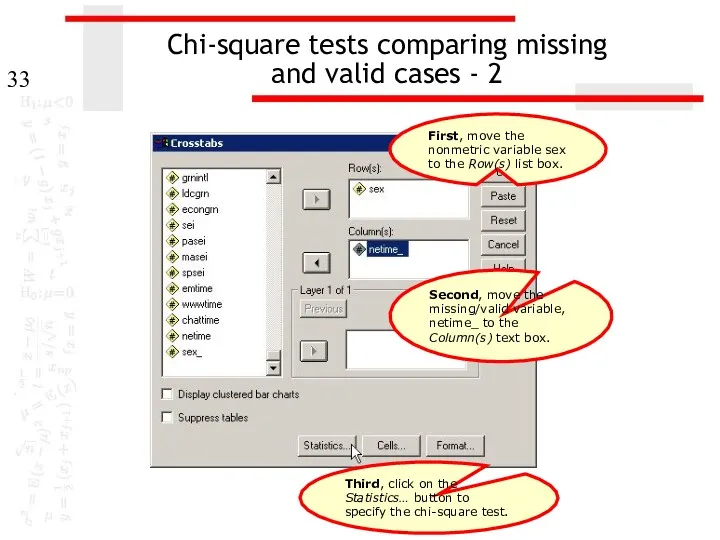
- 33. Chi-square tests comparing missing and valid cases - 2 Second, move the missing/valid variable, netime_ to
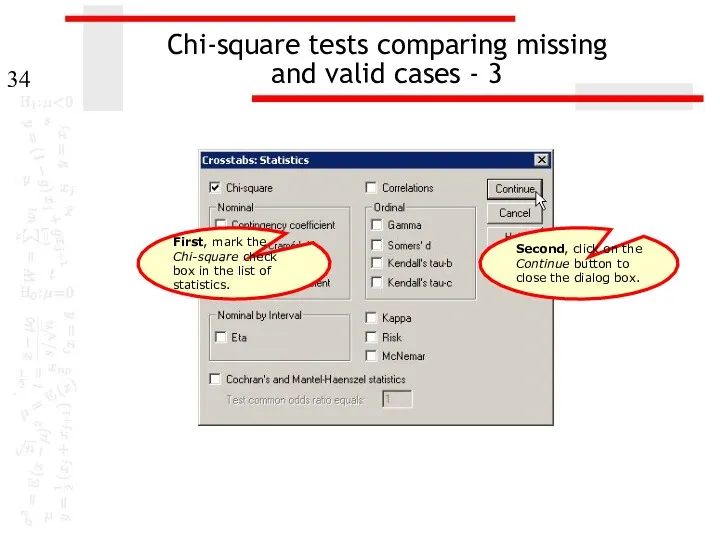
- 34. Chi-square tests comparing missing and valid cases - 3 First, mark the Chi-square check box in
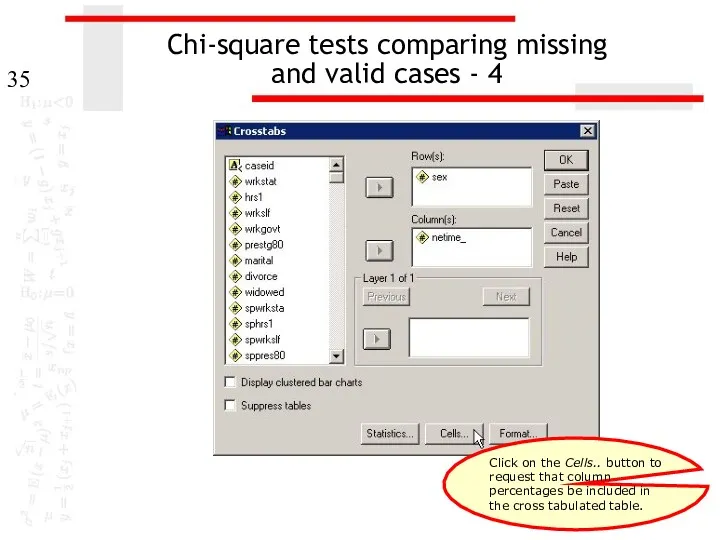
- 35. Chi-square tests comparing missing and valid cases - 4 Click on the Cells.. button to request
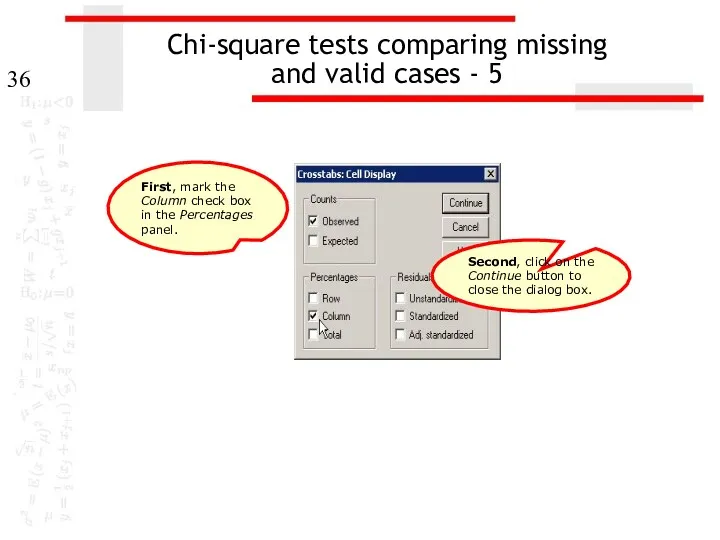
- 36. Chi-square tests comparing missing and valid cases - 5 First, mark the Column check box in
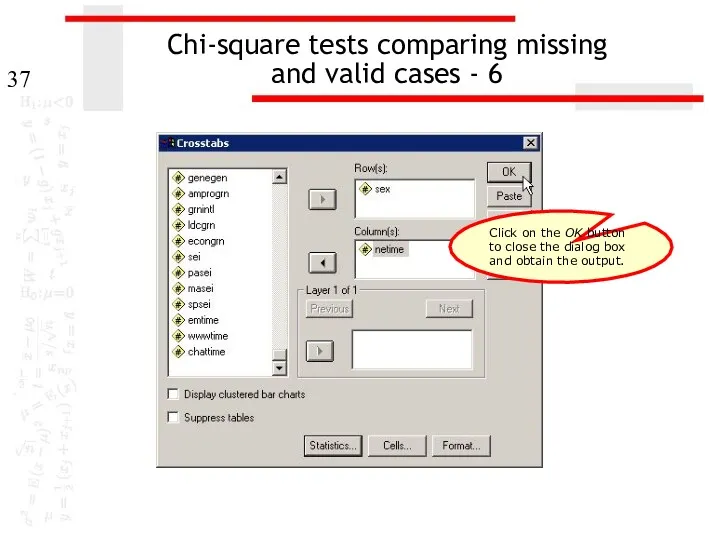
- 37. Chi-square tests comparing missing and valid cases - 6 Click on the OK button to close
- 38. Output for the chi-square test On the chi-square test, the difference in the breakdown for the
- 39. Answer 1 In the dataset GSS2000R, is the following statement true, false, or an incorrect application
- 40. Using scripts The process of evaluating missing data requires numerous SPSS procedures and outputs that are
- 41. Using a script for missing data The script “EvaluatingAssumptionsAndMissingData.exe” will produce all of the output we
- 42. Open the data set in SPSS Before using a script, a data set should be open
- 43. Invoke the script To invoke the script, select the Run Script… command in the Utilities menu.
- 44. Select the missing data script First, navigate to the folder where you put the script. If
- 45. The script dialog The script dialog box acts similarly to SPSS dialog boxes. You select the
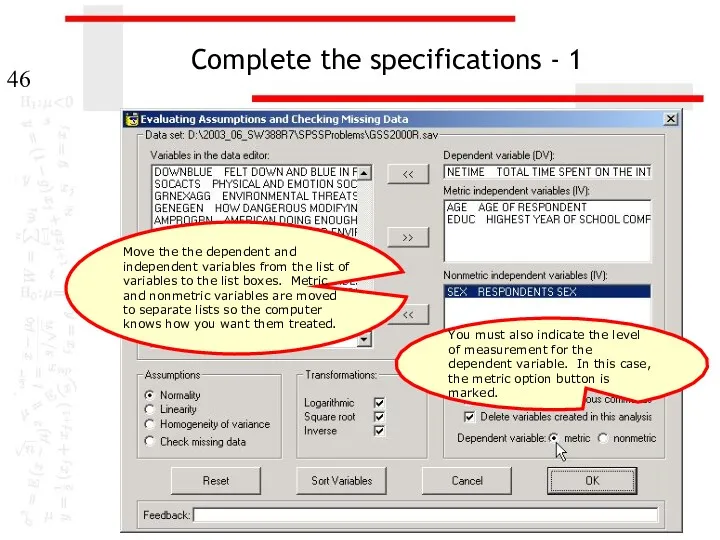
- 46. Complete the specifications - 1 Move the the dependent and independent variables from the list of
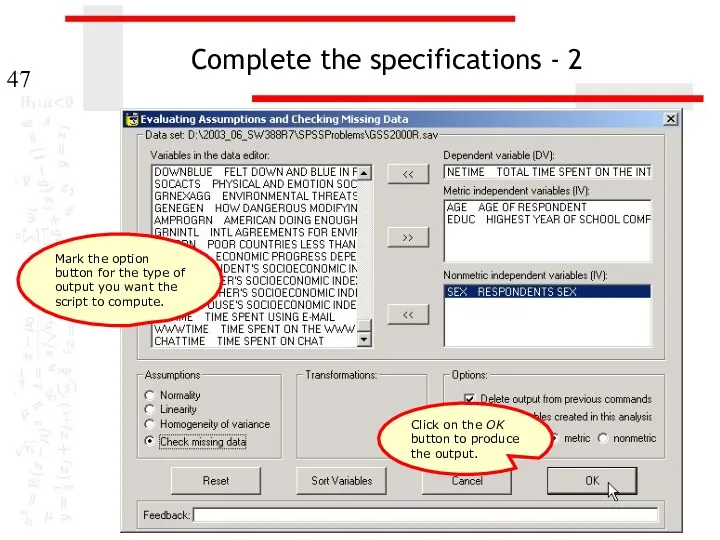
- 47. Complete the specifications - 2 Mark the option button for the type of output you want
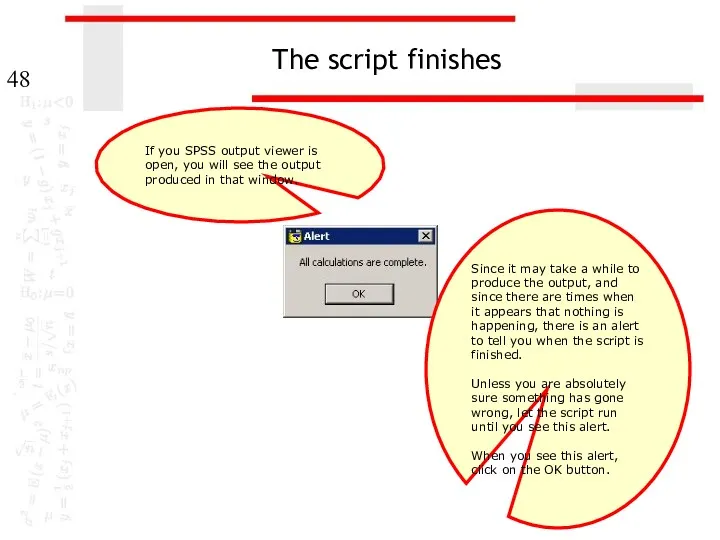
- 48. The script finishes If you SPSS output viewer is open, you will see the output produced
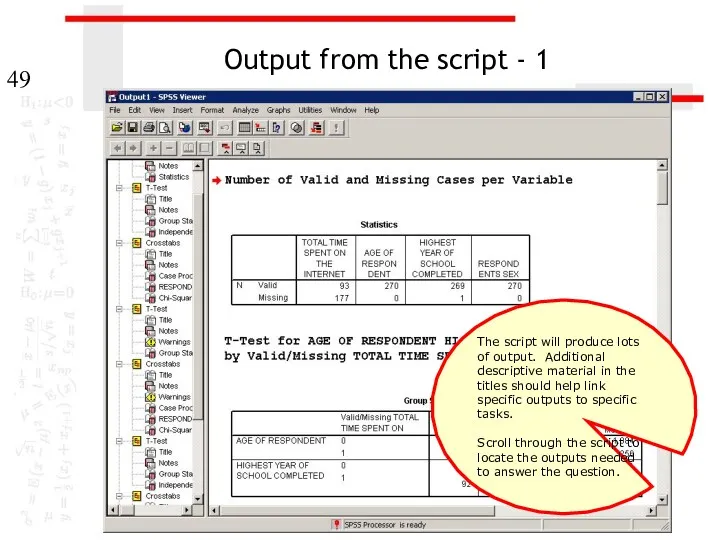
- 49. Output from the script - 1 The script will produce lots of output. Additional descriptive material
- 50. Complete the specifications – 2 The script dialog box does not close automatically because we often
- 51. Steps in analyzing missing data The following is a guide to the decision process for answering
- 53. Скачать презентацию
Missing data and data analysis
Missing data is a problem in multivariate
Missing data and data analysis
Missing data is a problem in multivariate
Tools for evaluating missing data
SPSS has a specific package for evaluating
Tools for evaluating missing data
SPSS has a specific package for evaluating
Key issues in missing data analysis
We will focus on two key
Key issues in missing data analysis
We will focus on two key
Benchmark for evaluating missing data
The text suggests that, in general, if
Benchmark for evaluating missing data
The text suggests that, in general, if
Our strategy for evaluating missing data
The criteria lead us to a
Our strategy for evaluating missing data
The criteria lead us to a
Testing for differences in missing/valid groups
If the variable to be tested
Testing for differences in missing/valid groups
If the variable to be tested
Example
For example, suppose we are testing the relationship between the independent
Example
For example, suppose we are testing the relationship between the independent
Problem 1
In the dataset GSS2000R, is the following statement true, false,
Problem 1
In the dataset GSS2000R, is the following statement true, false,
Checking level of measurement
9. In the dataset GSS2000R, is the following
Checking level of measurement
9. In the dataset GSS2000R, is the following
Request frequency distributions
We will use the output for frequency distributions to
Request frequency distributions
We will use the output for frequency distributions to
Completing specifications for frequencies - 1
Second, click on the Display frequency
Completing specifications for frequencies - 1
Second, click on the Display frequency
Completing specifications for frequencies - 2
SPSS give us a warning message
Completing specifications for frequencies - 2
SPSS give us a warning message
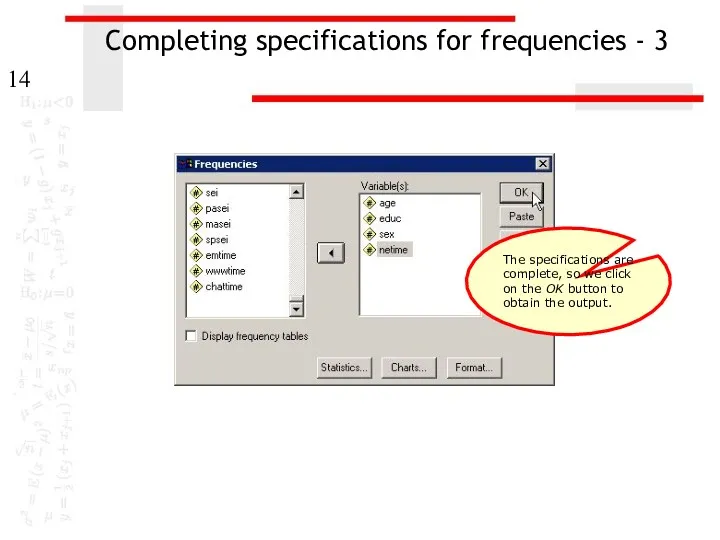
Completing specifications for frequencies - 3
The specifications are complete, so we
Completing specifications for frequencies - 3
The specifications are complete, so we
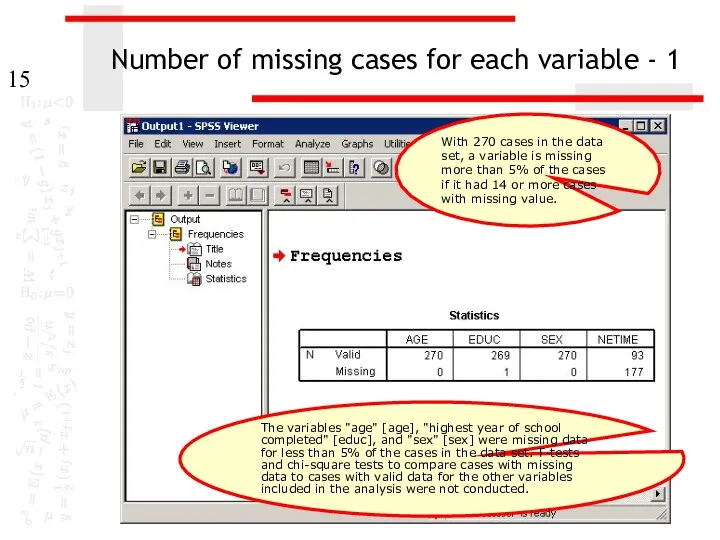
Number of missing cases for each variable - 1
With 270 cases
Number of missing cases for each variable - 1
With 270 cases
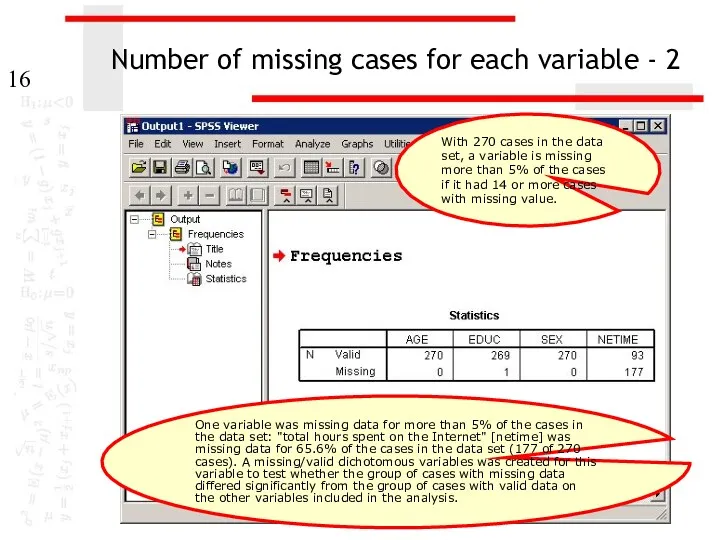
Number of missing cases for each variable - 2
With 270 cases
Number of missing cases for each variable - 2
With 270 cases
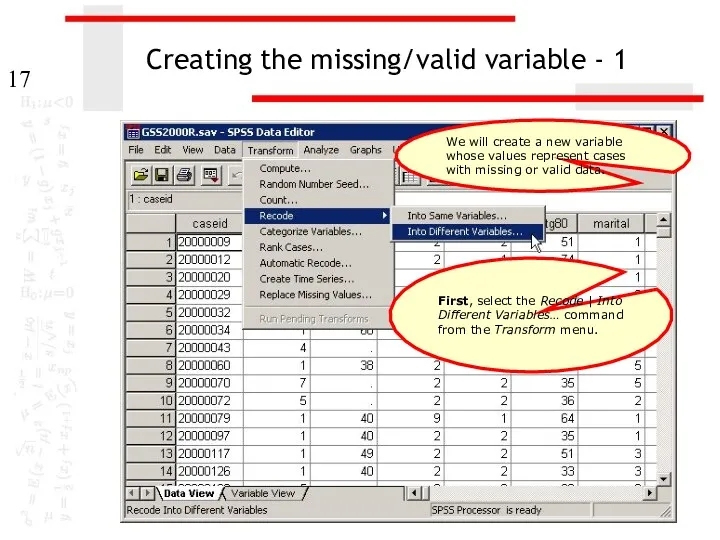
Creating the missing/valid variable - 1
First, select the Recode | Into
Creating the missing/valid variable - 1
First, select the Recode | Into
Creating the missing/valid variable - 2
Second, click on right arrow button
Creating the missing/valid variable - 2
Second, click on right arrow button
Creating the missing/valid variable - 3
Second, click on the Change button
Creating the missing/valid variable - 3
Second, click on the Change button
Creating the missing/valid variable - 4
First, click on the Old and
Creating the missing/valid variable - 4
First, click on the Old and
Creating the missing/valid variable - 5
Second, in the Value: text box
Creating the missing/valid variable - 5
Second, in the Value: text box
Creating the missing/valid variable - 6
Second, in the Value: text box
Creating the missing/valid variable - 6
Second, in the Value: text box
Creating the missing/valid variable - 7
Having completed the changes, we click
Creating the missing/valid variable - 7
Having completed the changes, we click
Creating the missing/valid variable - 8
Click on the OK button to
Creating the missing/valid variable - 8
Click on the OK button to
The missing/valid variable in the data editor
If we look at the
The missing/valid variable in the data editor
If we look at the
T-tests comparing missing and valid cases - 1
First, select the Compare
T-tests comparing missing and valid cases - 1
First, select the Compare
T-tests comparing missing and valid cases – 2
Second, move the missing/valid
T-tests comparing missing and valid cases – 2
Second, move the missing/valid
T-tests comparing missing and valid cases – 3
First, type the number
T-tests comparing missing and valid cases – 3
First, type the number
T-tests comparing missing and valid cases – 4
Click on the OK
T-tests comparing missing and valid cases – 4
Click on the OK
Output for the t-tests - 1
Cases who had missing data for
Output for the t-tests - 1
Cases who had missing data for
Output for the t-tests - 2
Cases who had missing data for
Output for the t-tests - 2
Cases who had missing data for
Chi-square tests comparing missing
and valid cases - 1
First, select the
Chi-square tests comparing missing
and valid cases - 1
First, select the
Chi-square tests comparing missing
and valid cases - 2
Second, move the
Chi-square tests comparing missing
and valid cases - 2
Second, move the
Chi-square tests comparing missing
and valid cases - 3
First, mark the
Chi-square tests comparing missing
and valid cases - 3
First, mark the
Chi-square tests comparing missing
and valid cases - 4
Click on the
Chi-square tests comparing missing
and valid cases - 4
Click on the
Chi-square tests comparing missing
and valid cases - 5
First, mark the
Chi-square tests comparing missing
and valid cases - 5
First, mark the
Chi-square tests comparing missing
and valid cases - 6
Click on the
Chi-square tests comparing missing
and valid cases - 6
Click on the
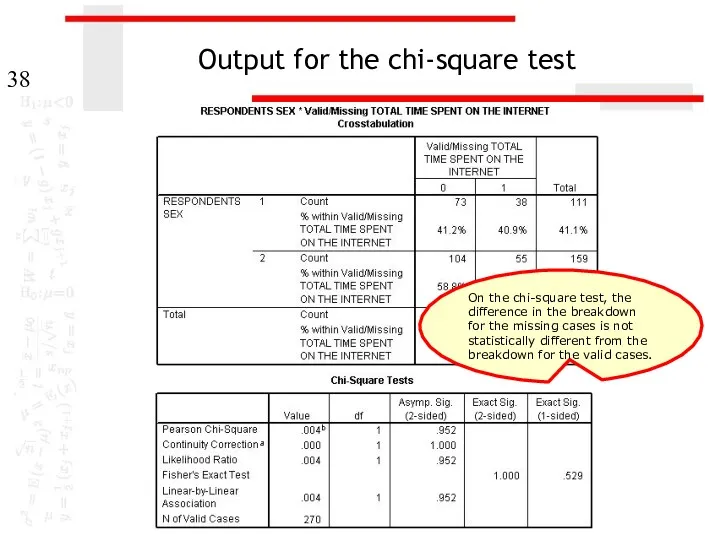
Output for the chi-square test
On the chi-square test, the difference in
Output for the chi-square test
On the chi-square test, the difference in
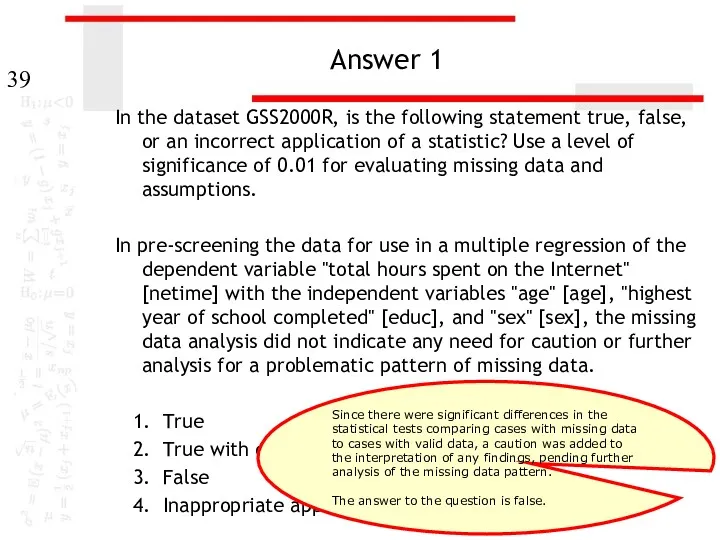
Answer 1
In the dataset GSS2000R, is the following statement true, false,
Answer 1
In the dataset GSS2000R, is the following statement true, false,
Using scripts
The process of evaluating missing data requires numerous SPSS procedures
Using scripts
The process of evaluating missing data requires numerous SPSS procedures
Using a script for missing data
The script “EvaluatingAssumptionsAndMissingData.exe” will produce all
Using a script for missing data
The script “EvaluatingAssumptionsAndMissingData.exe” will produce all
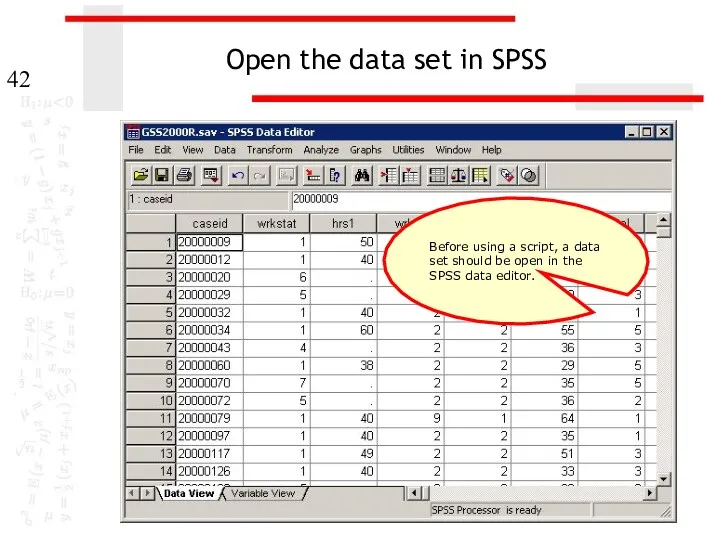
Open the data set in SPSS
Before using a script, a data
Open the data set in SPSS
Before using a script, a data
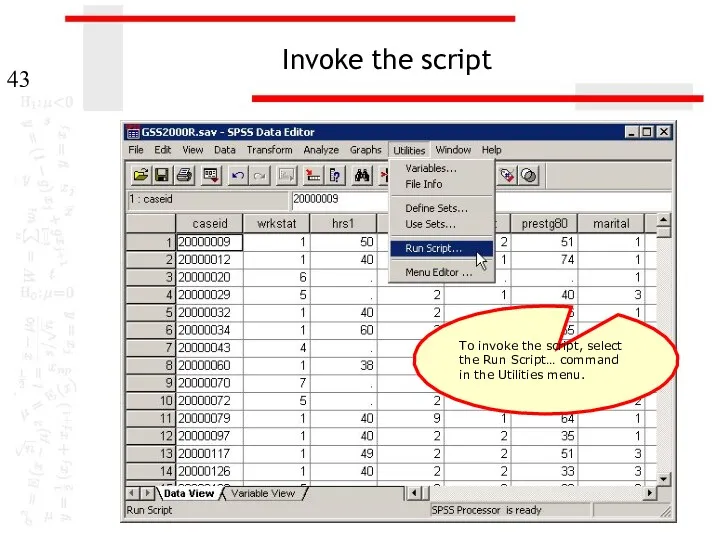
Invoke the script
To invoke the script, select the Run Script… command
Invoke the script
To invoke the script, select the Run Script… command
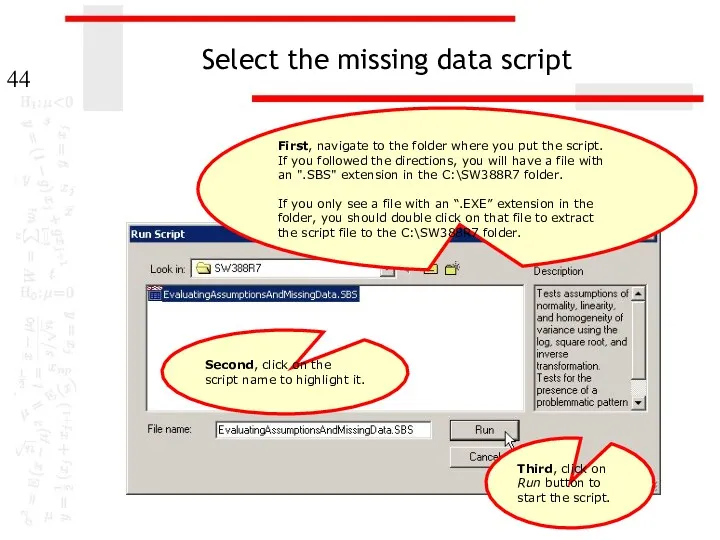
Select the missing data script
First, navigate to the folder where you
Select the missing data script
First, navigate to the folder where you
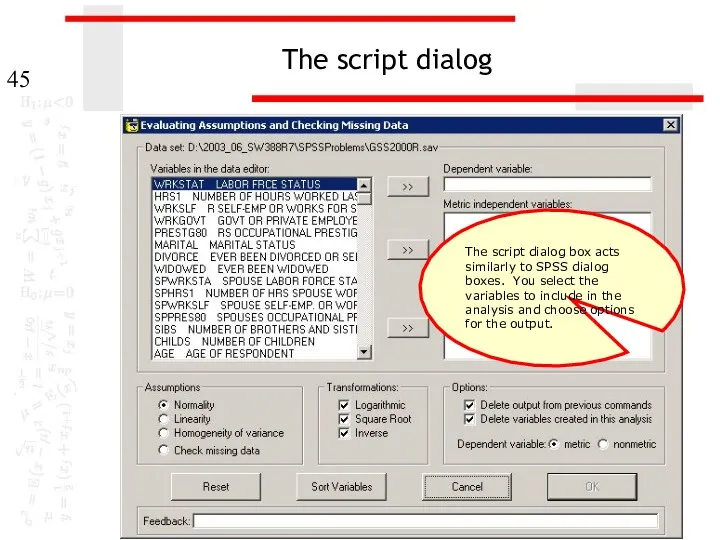
The script dialog
The script dialog box acts similarly to SPSS dialog
The script dialog
The script dialog box acts similarly to SPSS dialog
Complete the specifications - 1
Move the the dependent and independent variables
Complete the specifications - 1
Move the the dependent and independent variables
Complete the specifications - 2
Mark the option button for the type
Complete the specifications - 2
Mark the option button for the type
The script finishes
If you SPSS output viewer is open, you will
The script finishes
If you SPSS output viewer is open, you will
Output from the script - 1
The script will produce lots of
Output from the script - 1
The script will produce lots of
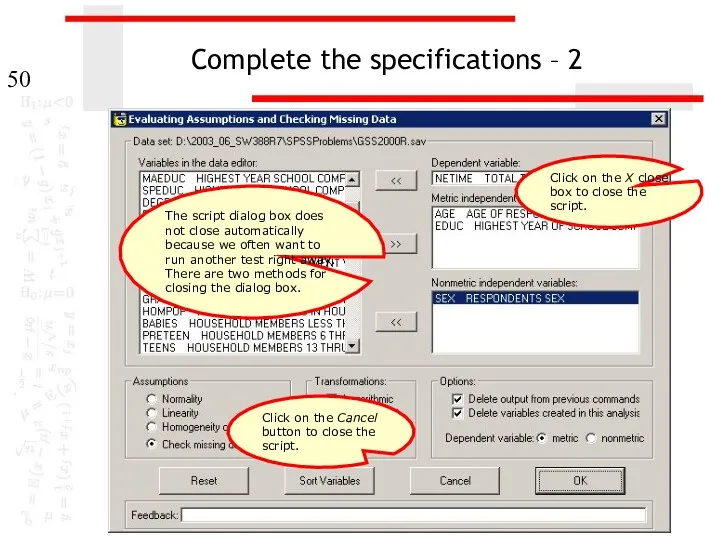
Complete the specifications – 2
The script dialog box does not close
Complete the specifications – 2
The script dialog box does not close
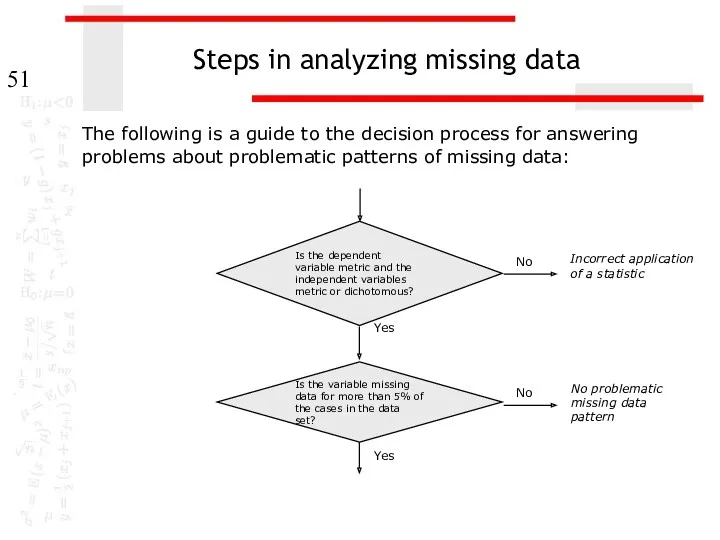
Steps in analyzing missing data
The following is a guide to the
Steps in analyzing missing data
The following is a guide to the
 Компьютерное информационное моделирование. 10 класс
 Марафон Инструкция к себе. Азия. Энергия Луны. Материалы, которые понадобятся для прохождения марафона
 Робот-спасатель ЯМ-1
 Битва розумів. Позакласний захід з інформатики для 10-11 класу
 Работа с lego mindstorms ev3. Задание № 3: вывод на экран текста и графики
 Час кода в России
 Системы распознавания текста
 Introduction to SSD10 course
 Аппаратное обеспечение компьютерных сетей
 Криптография
 Прапорці та групи перемикачів (урок 23)
 Использование ИКТ на уроках и во внеурочной деятельности по географии
 Безопасность беспроводных сетей
 Введение в С#, константы, типы , выражения. Часть 1
 Жинақы мәтін – бастапқы мәтіндегі негізгі идеялар мен ақпараттарды сақтай отырып, мәтін көлемін ықшамдау және өңдеу
 Структура программного модуля. Состав интегрированной программной среды.(Лекция 4)
 Инструкция по работе с сайтом ГМУ
 Информационная система. База данных
 Компонент таймер. Lazarus. Урок 15
 Реклама в Яндекс Директ. Основы работы и снижения стоимости клиента
 Database overview
 История языков программирования. 9 класс
 Тораптық утелиттердің жұмысын оқып үйрену
 Компьютер на службе у человека
 Основи інтернет
 Система электронного документооборота TESSA
 Разработка чат-бота для абитуриентов ВУЗа
 Компьютерные сети, назначение