- Correlation Analysis and Covariance

Содержание
- 2. Aims Measuring Relationships Scatterplots Covariance Pearson’s Correlation Coefficient Nonparametric measures Spearman’s Rho Kendall’s Tau
- 3. What is a Correlation? It is a way of measuring the extent to which two variables
- 4. Measuring Relationships We need to see whether as one variable increases, the other increases, decreases or
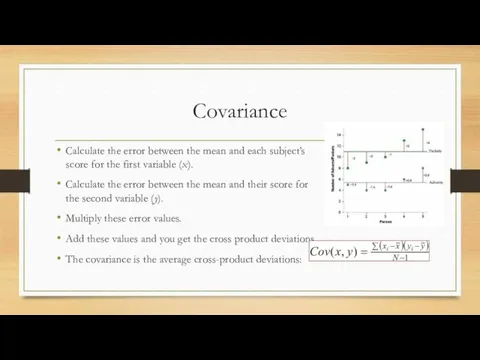
- 5. Covariance Calculate the error between the mean and each subject’s score for the first variable (x).
- 6. Problems with Covariance It depends upon the units of measurement. E.g. The Covariance of two variables
- 7. The Correlation Coefficient (Pearson)
- 8. Conducting Correlation Analysis
- 9. Things to know about the Correlation
- 10. Interpretation of Correlation (may vary by discipline) Correlations From 0 to 0.25 (-0.25) = little (weak)
- 11. Correlation and Causality The third-variable problem: in any correlation, causality between two variables cannot be assumed
- 12. Partial vs Semi-Partial Correlations
- 13. Nonparametric Correlation
- 14. One-Tailed vs Two-Tailed Tests
- 15. 2-Tailed Testing
- 17. Скачать презентацию
Aims
Measuring Relationships
Scatterplots
Covariance
Pearson’s Correlation Coefficient
Nonparametric measures
Spearman’s Rho
Aims
Measuring Relationships
Scatterplots
Covariance
Pearson’s Correlation Coefficient
Nonparametric measures
Spearman’s Rho
What is a Correlation?
It is a way of measuring the
What is a Correlation?
It is a way of measuring the
Measuring Relationships
We need to see whether as one variable increases,
Measuring Relationships
We need to see whether as one variable increases,
Covariance
Calculate the error between the mean and each subject’s score
Covariance
Calculate the error between the mean and each subject’s score
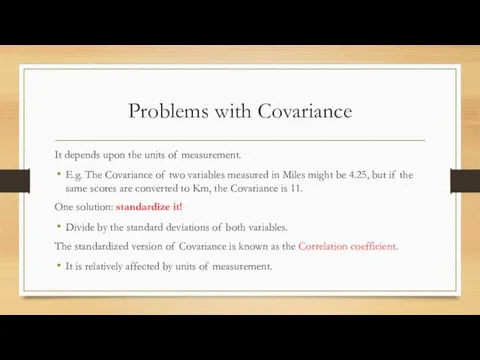
Problems with Covariance
It depends upon the units of measurement.
E.g.
Problems with Covariance
It depends upon the units of measurement.
E.g.
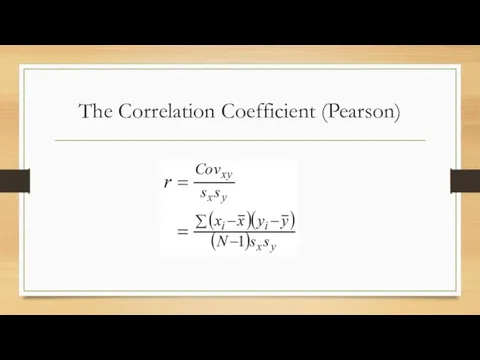
The Correlation Coefficient (Pearson)
The Correlation Coefficient (Pearson)
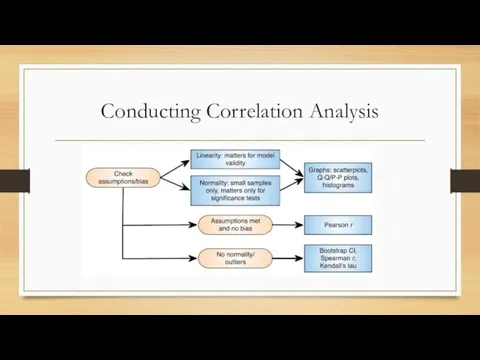
Conducting Correlation Analysis
Conducting Correlation Analysis
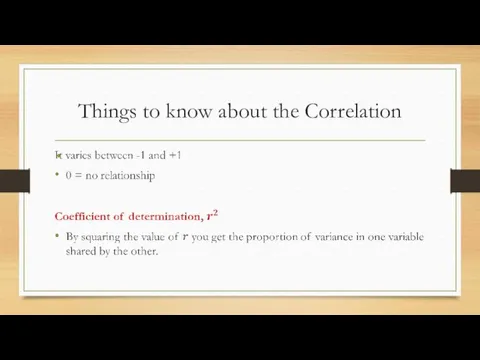
Things to know about the Correlation
Things to know about the Correlation
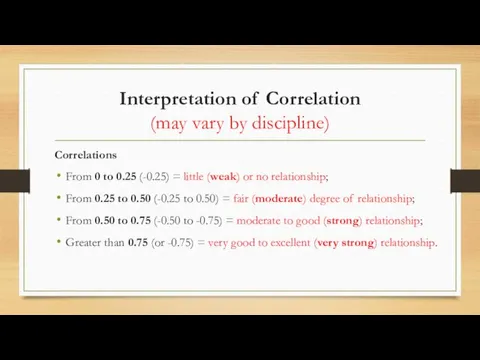
Interpretation of Correlation
(may vary by discipline)
Correlations
From 0 to 0.25 (-0.25) =
Interpretation of Correlation
(may vary by discipline)
Correlations
From 0 to 0.25 (-0.25) =
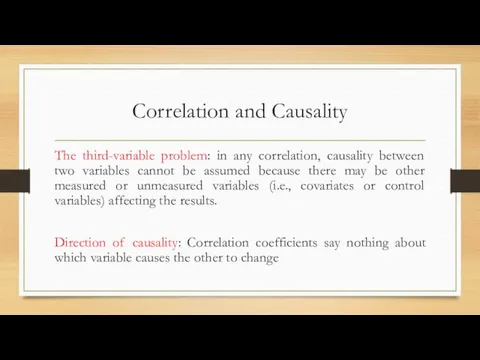
Correlation and Causality
The third-variable problem: in any correlation, causality between two
Correlation and Causality
The third-variable problem: in any correlation, causality between two
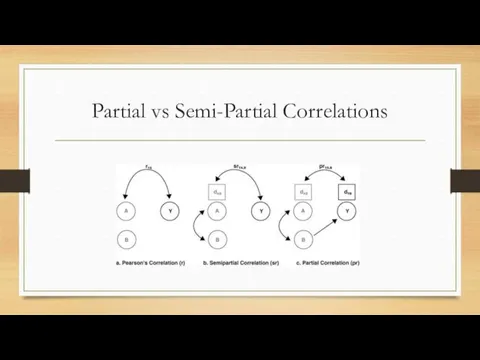
Partial vs Semi-Partial Correlations
Partial vs Semi-Partial Correlations

Nonparametric Correlation
Nonparametric Correlation
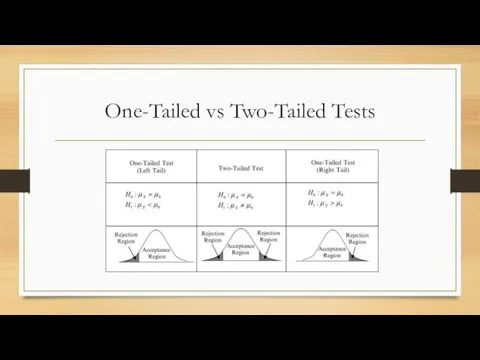
One-Tailed vs Two-Tailed Tests
One-Tailed vs Two-Tailed Tests
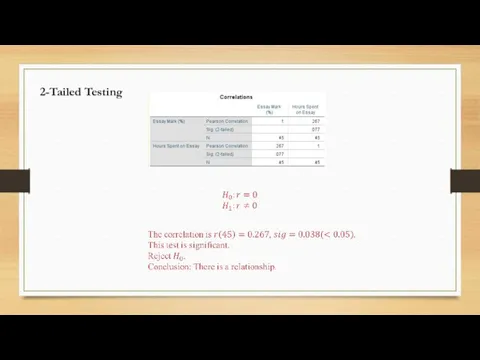
2-Tailed Testing
2-Tailed Testing
 Примеры комбинаторных задач: перебор возможных вариантов, правило умножения
 Понятие логарифма
 :Число и цифра 1.
 Сложение и вычитание векторов
 Приближение десятичных дробей. 6 класс
 Тождества. Тождественные преобразования выражений. Алгебра 7 класс
 Числа в загадках, пословицах и поговорках
 Практикум по решению задачи №20 ЕГЭ (базовый уровень)
 Сложение и вычитание десятичных дробей
 Статистические методы обработки данных. Тема 5
 Случайные величины
 Көпбұрыш, тіктөртбұрыш, шаршы, дөңгелек
 Сложение дробей с одинаковыми знаменателями
 Развивающее занятие Геометрические фигуры
 Формирование познавательного интереса к урокам математики в 5-6 классах
 презентация по математике
 Единицы измерения длины. Сравнение отрезков
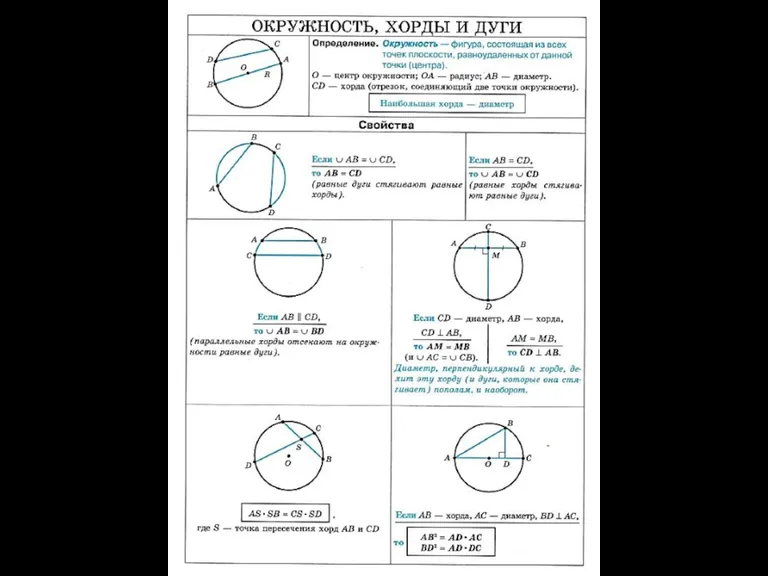 Окружность, хорді и дуги
 Взаимное расположение прямой и окружности. 8 класс
 Пропорции и проценты
 Планиметрия
 Наглядное пособие по математике Объем прямоугольного параллелепипеда
 Аксиома параллельных прямых. (7 класс)
 Сложение и вычитание десятичных дробей
 Преобразование рациональных выражений
 Уроки педагогического мастерства — 2015
 Сложение отрицательных чисел
 Тема 5. Вступ до математичного аналізу. Лекція №11. Неперервність функції. Визначні границі