- Management Tools

Содержание
- 2. Management & Planning Tools Why Why?? Forced Field Analysis Nominal Group Technique
- 3. Why Why Tool Very simple and effective tool. Focuses on the process rather than on people.
- 4. Forced Field Analysis What it does? How to use it: Define the objective Determine criteria/problem Brainstorm
- 5. Forced Field Analysis - +
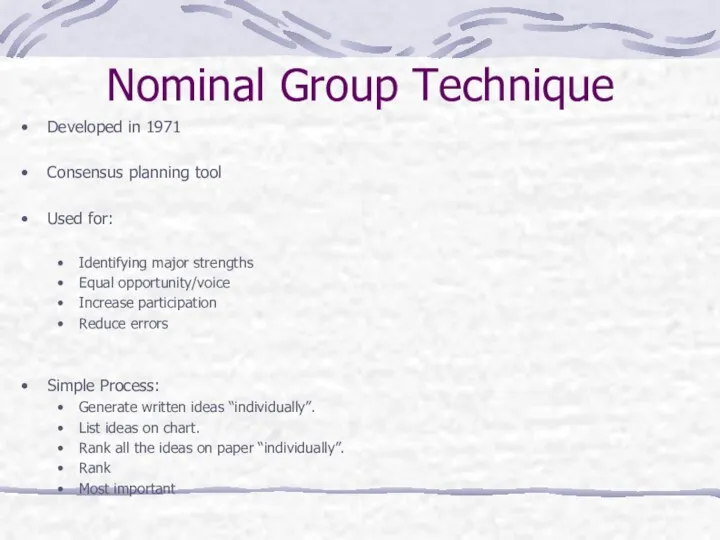
- 6. Nominal Group Technique Developed in 1971 Consensus planning tool Used for: Identifying major strengths Equal opportunity/voice
- 7. Nominal Group Technique Diagram Start Select Session Participants Present and Discuss Topic Participants Write Responses In
- 8. Management & Planning Tools Affinity Diagram Interrelationship Digraph Tree Diagram Matrix Diagram Prioritization Matrices Process Decision
- 9. Affinity Diagram What it does? When to use? Benefits of using The Process State the issue
- 10. Affinity Diagram What are the issues involved in missing shipping dates Not enough fork trucks No
- 11. Affinity Diagram Facilities Overcrowded dock No place for returns Not enough fork trucks People Insufficient training
- 12. Affinity Diagram Example
- 13. Interrelationship Digraph Clarifies interrelationship of many factors Classifies cause-and-effect relationships
- 14. The Process: Agree on the issue or question Add a symbol to the diagram Put ideas
- 15. Interrelationship Diagram Unnecessary packaging Lack of parental examples Not enough receptacles Inadequate penalties Lack of awareness
- 16. Questions Comments
- 17. Tree Diagram Used to reduce encourage team members to think creatively, make large projects manageable and
- 18. Tree Diagram Increase workplace suggestions Create a workable process Create simple input system Provide documentation Do
- 19. Matrix Diagram Used to identify, analyze and rate the relationship among two or more variables. Select
- 20. Matrix Diagram Affinity Diagram Interrelationship Tree Diagram Prioritisation Matrix Diagram PDPC Activity network Tool Use Creativity
- 21. Prioritization Matrix What it does? When to use it: Broad objectives must be broken down All
- 22. Prioritization Matrix
- 23. Process Decision Program Chart (PDPC) What it does? When to use it: The task is new,
- 24. PDPC The process decision program chart is a tool for contingency planning. Helps the user to
- 25. Process Decision Program Chart Plan successful conference Registration Presentation Facilities Speakers late Audio fails Too long
- 26. Activity Network Diagram
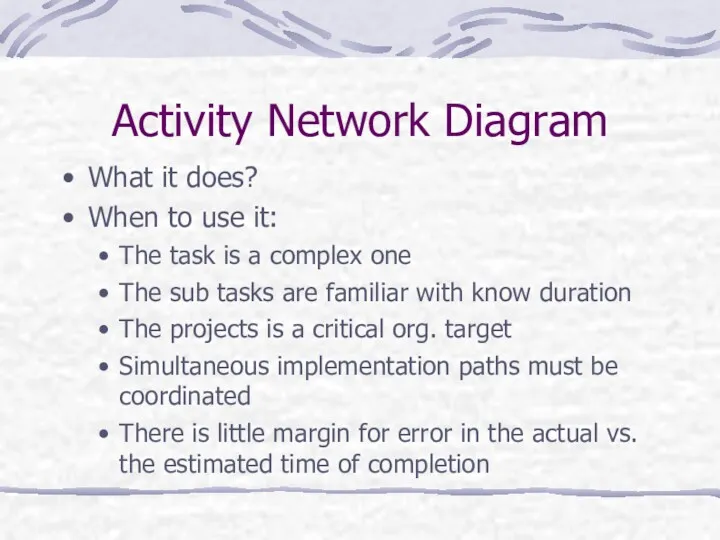
- 27. Activity Network Diagram What it does? When to use it: The task is a complex one
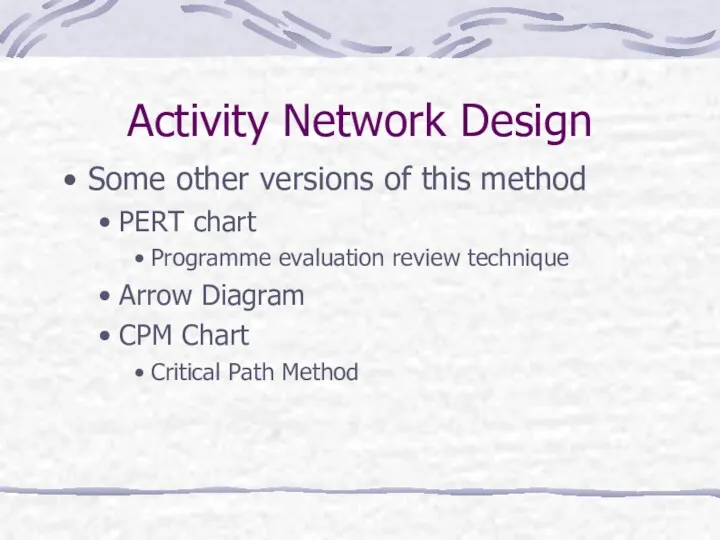
- 28. Activity Network Design Some other versions of this method PERT chart Programme evaluation review technique Arrow
- 29. Quality Control Tools Cause & Effect (Fish bone) Flow Chart Run Chart Control Chart Histogram Pareto
- 30. Cause & Effect Diagram
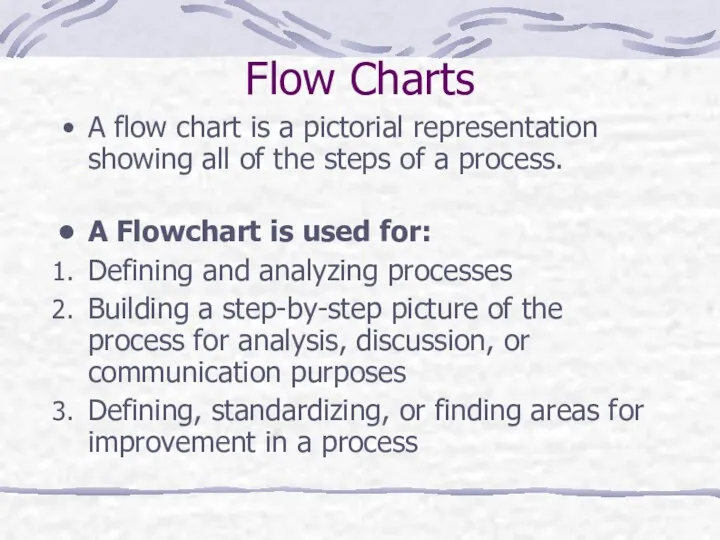
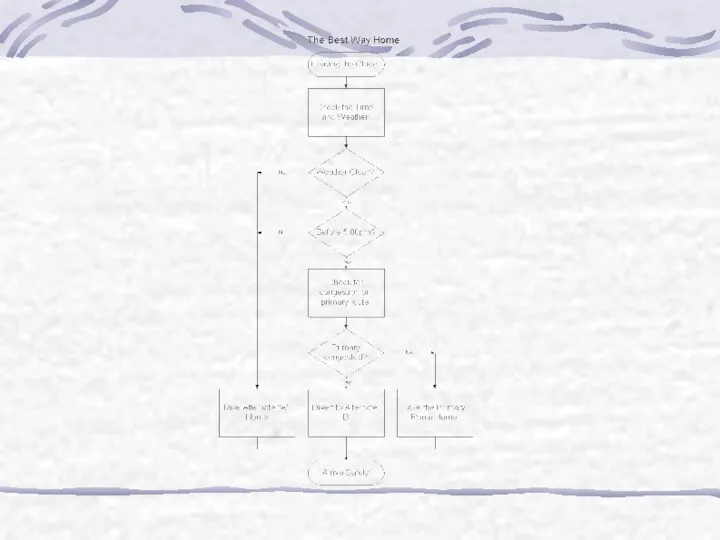
- 31. Flow Charts A flow chart is a pictorial representation showing all of the steps of a
- 32. Symbols Used
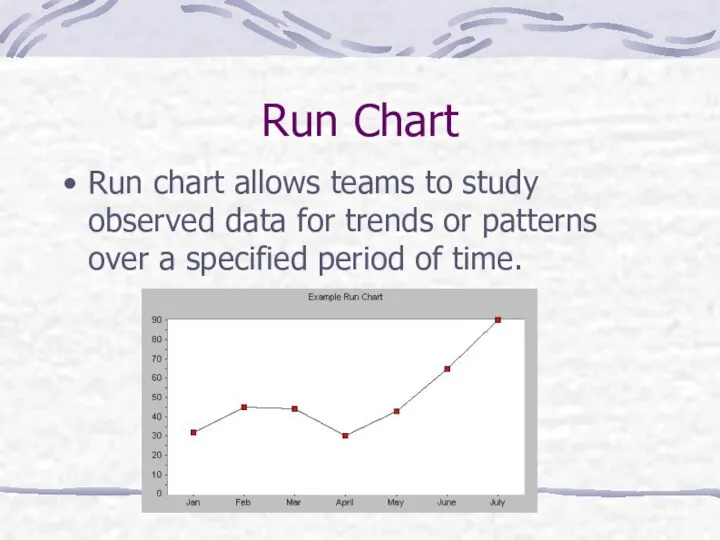
- 34. Run Chart Run chart allows teams to study observed data for trends or patterns over a
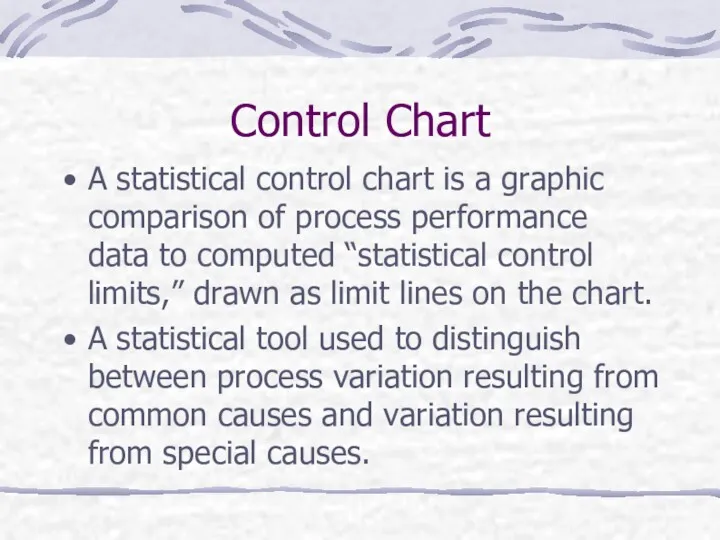
- 35. Control Chart A statistical control chart is a graphic comparison of process performance data to computed
- 36. Control Chart Benefits Monitor process variation over time Differentiate between special cause and common cause variation
- 37. Control Chart Types of Control charts Attribute Data Data that results from counting the number of
- 38. Control Chart Three types of of charts: X-Bar and R Chart Individual X and Moving Range
- 39. Histogram A histogram is a graphic summary of variation in a set of data Basic data
- 40. Pareto Chart Pareto analysis is a ranked comparison of factors related to a quality problem Prioritized
- 41. Pareto Chart
- 42. Creativity Tools Brainwriting 6-3-5 Classic Brainstorming Imaginary Brainstorming Knowledge mapping Morphological Box Picture Associations and Biotechniques
- 44. Скачать презентацию
Management & Planning Tools
Why Why??
Forced Field Analysis
Nominal Group Technique
Management & Planning Tools
Why Why??
Forced Field Analysis
Nominal Group Technique
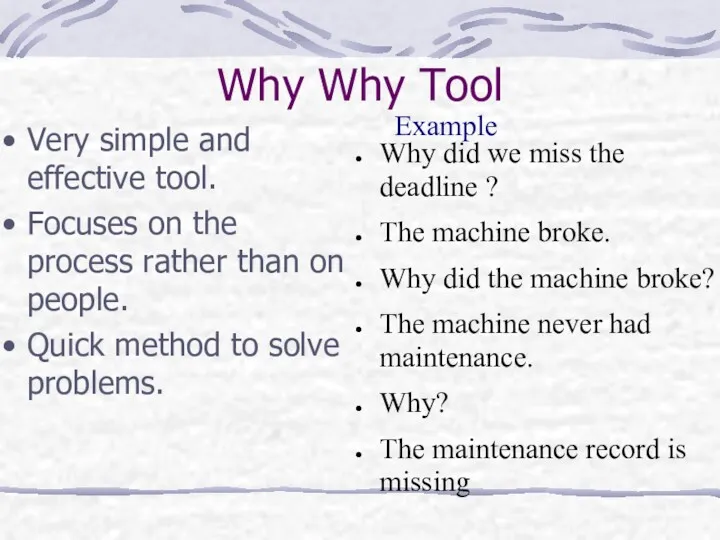
Why Why Tool
Very simple and effective tool.
Focuses on the process rather
Why Why Tool
Very simple and effective tool.
Focuses on the process rather
Forced Field Analysis
What it does?
How to use it:
Define the objective
Determine criteria/problem
Brainstorm
Forced Field Analysis
What it does?
How to use it:
Define the objective
Determine criteria/problem
Brainstorm
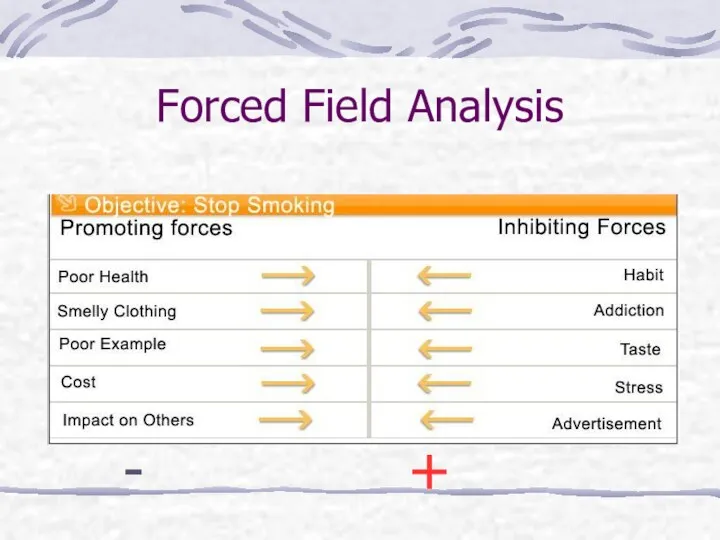
Forced Field Analysis
- +
Forced Field Analysis
- +
Nominal Group Technique
Developed in 1971
Consensus planning tool
Used for:
Identifying major strengths
Equal opportunity/voice
Increase
Nominal Group Technique
Developed in 1971
Consensus planning tool
Used for:
Identifying major strengths
Equal opportunity/voice
Increase
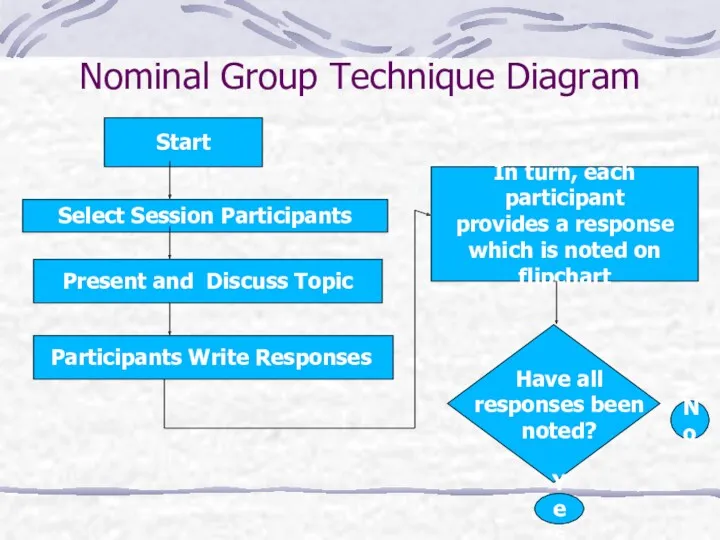
Nominal Group Technique Diagram
Start
Select Session Participants
Present and Discuss Topic
Participants Write Responses
In
Nominal Group Technique Diagram
Start
Select Session Participants
Present and Discuss Topic
Participants Write Responses
In
Management & Planning Tools
Affinity Diagram
Interrelationship Digraph
Tree Diagram
Matrix Diagram
Prioritization Matrices
Process Decision Program
Management & Planning Tools
Affinity Diagram
Interrelationship Digraph
Tree Diagram
Matrix Diagram
Prioritization Matrices
Process Decision Program
Affinity Diagram
What it does?
When to use?
Benefits of using
The Process
State the issue
Brainstorm
Affinity Diagram
What it does?
When to use?
Benefits of using
The Process
State the issue
Brainstorm
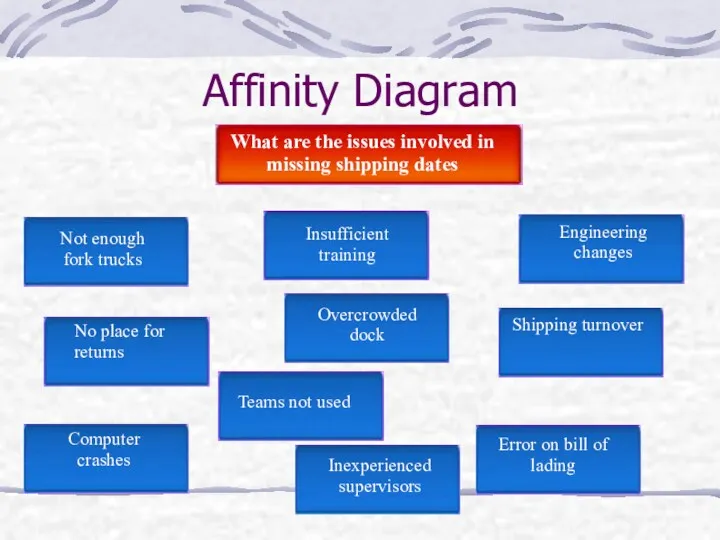
Affinity Diagram
What are the issues involved in missing shipping dates
Not
Affinity Diagram
What are the issues involved in missing shipping dates
Not
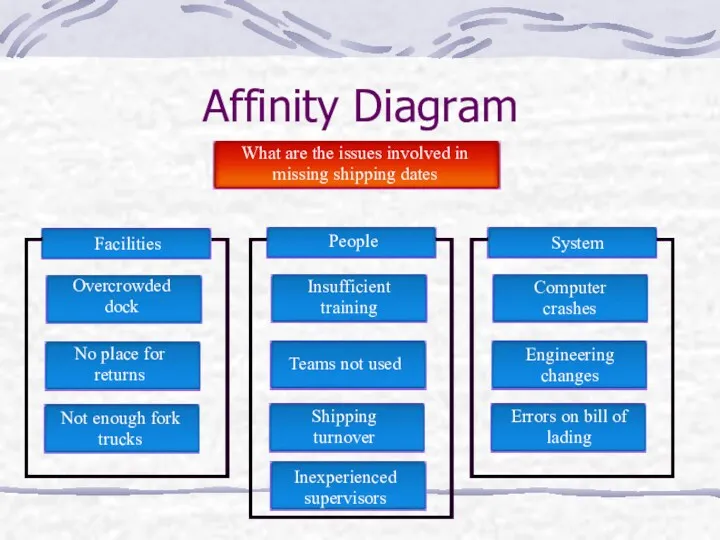
Affinity Diagram
Facilities
Overcrowded dock
No place for returns
Not enough fork trucks
People
Insufficient training
Teams not
Affinity Diagram
Facilities
Overcrowded dock
No place for returns
Not enough fork trucks
People
Insufficient training
Teams not
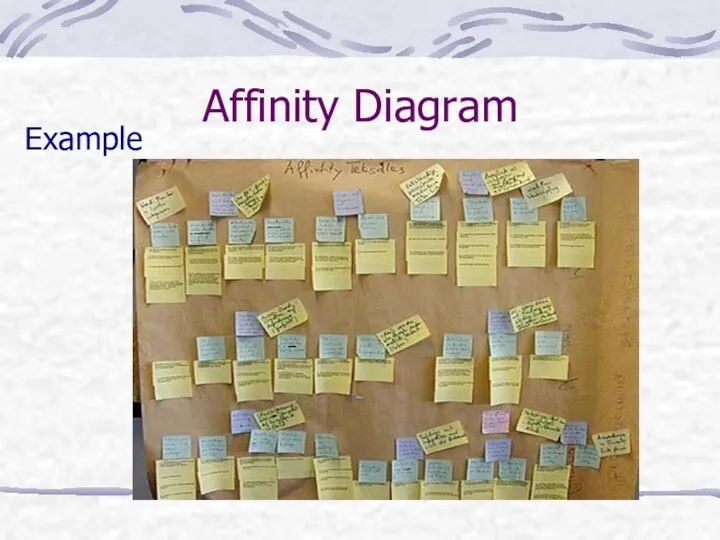
Affinity Diagram
Example
Affinity Diagram
Example
Interrelationship Digraph
Clarifies interrelationship of many factors
Classifies cause-and-effect relationships
Interrelationship Digraph
Clarifies interrelationship of many factors
Classifies cause-and-effect relationships
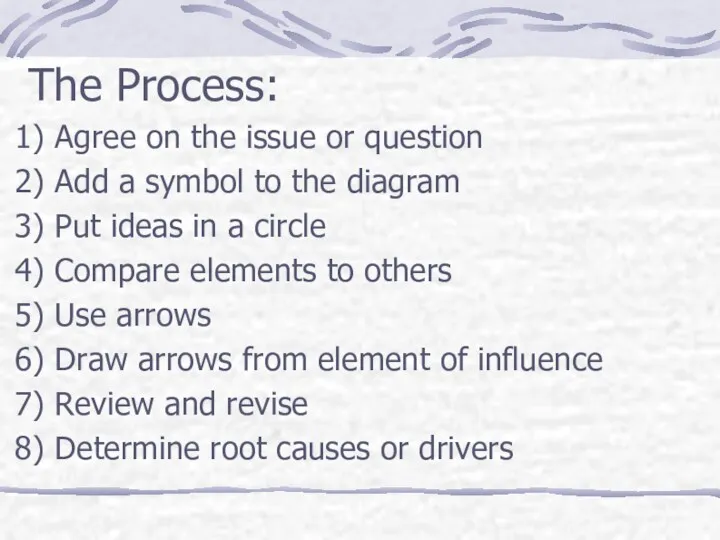
The Process:
Agree on the issue or question
Add a symbol to the
The Process:
Agree on the issue or question
Add a symbol to the
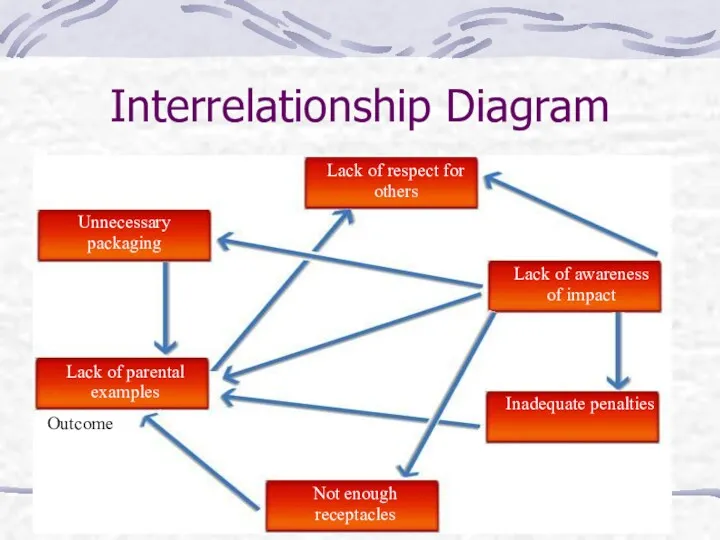
Interrelationship Diagram
Unnecessary
packaging
Lack of parental examples
Not enough receptacles
Inadequate penalties
Lack of awareness
Interrelationship Diagram
Unnecessary
packaging
Lack of parental examples
Not enough receptacles
Inadequate penalties
Lack of awareness

Questions
Comments
Questions
Comments
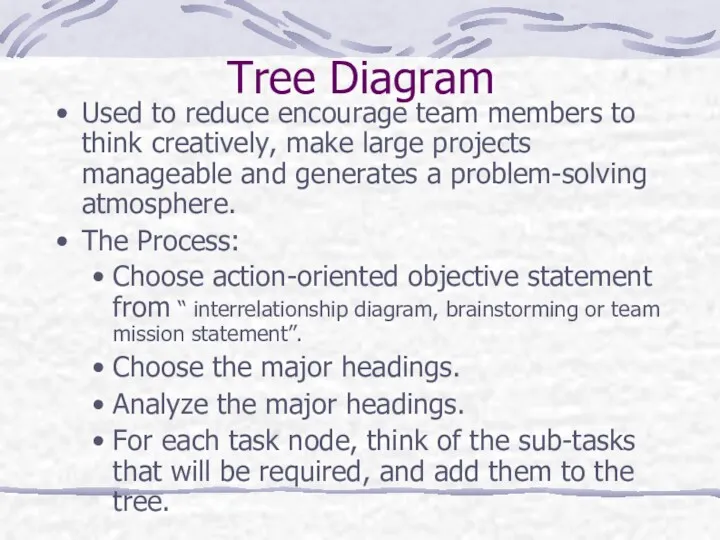
Tree Diagram
Used to reduce encourage team members to think creatively, make
Tree Diagram
Used to reduce encourage team members to think creatively, make
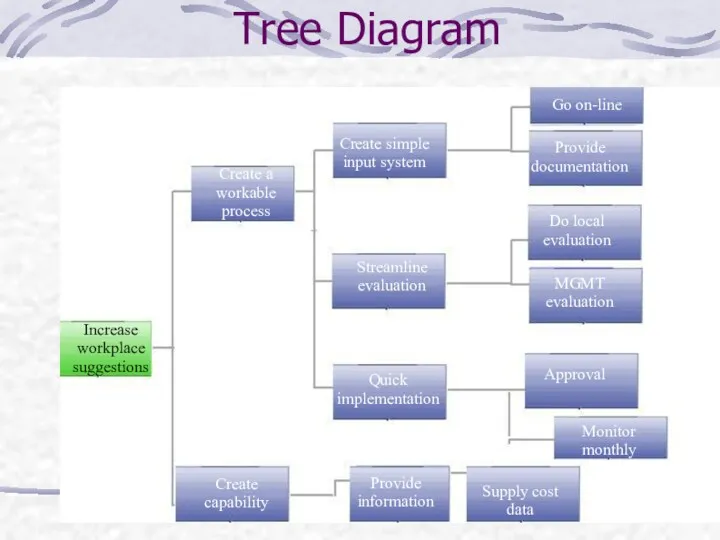
Tree Diagram
Increase workplace suggestions
Create a
workable
process
Create simple
input system
Provide documentation
Do local
Tree Diagram
Increase workplace suggestions
Create a
workable
process
Create simple
input system
Provide documentation
Do local
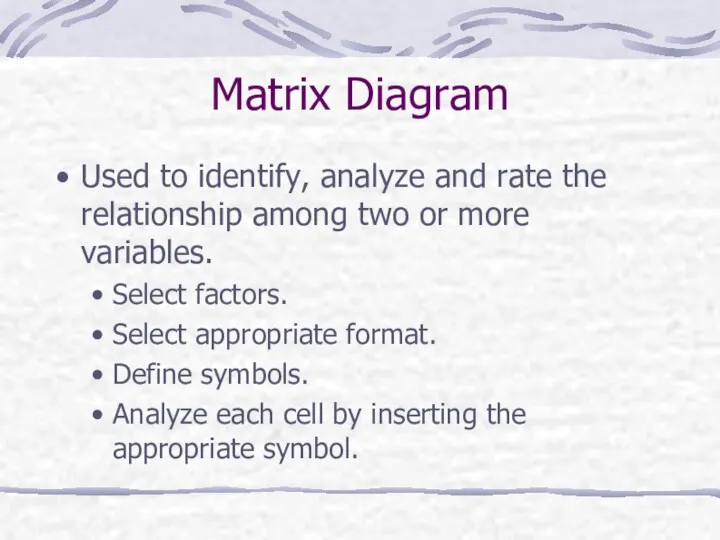
Matrix Diagram
Used to identify, analyze and rate the relationship among two
Matrix Diagram
Used to identify, analyze and rate the relationship among two
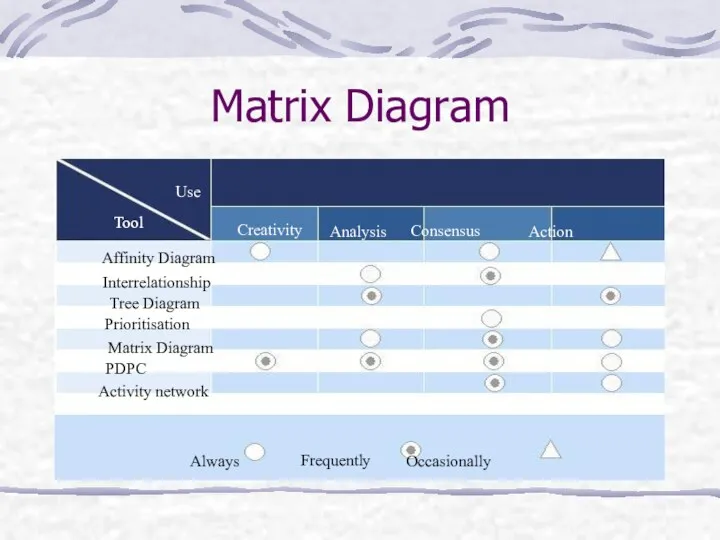
Matrix Diagram
Affinity Diagram
Interrelationship
Tree Diagram
Prioritisation
Matrix Diagram
PDPC
Activity network
Tool
Use
Creativity
Tool
Analysis
Consensus
Action
Always
Frequently
Occasionally
Matrix Diagram
Affinity Diagram
Interrelationship
Tree Diagram
Prioritisation
Matrix Diagram
PDPC
Activity network
Tool
Use
Creativity
Tool
Analysis
Consensus
Action
Always
Frequently
Occasionally
Prioritization Matrix
What it does?
When to use it:
Broad objectives must be broken
Prioritization Matrix
What it does?
When to use it:
Broad objectives must be broken
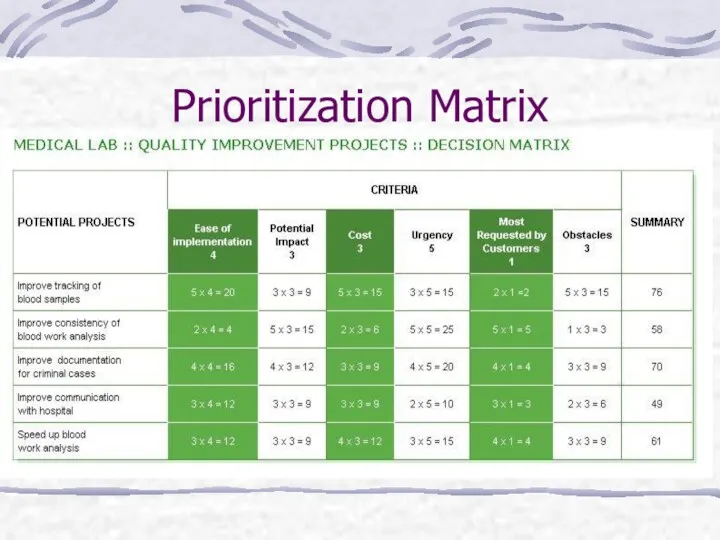
Prioritization Matrix
Prioritization Matrix
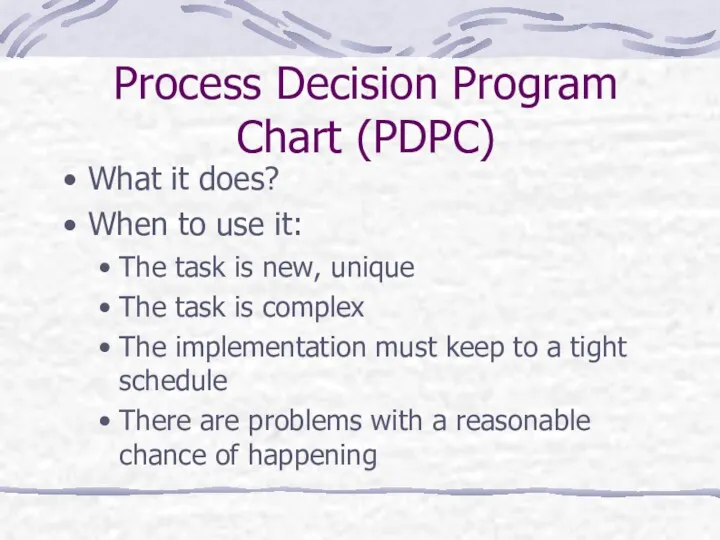
Process Decision Program Chart (PDPC)
What it does?
When to use it:
The task
Process Decision Program Chart (PDPC)
What it does?
When to use it:
The task
PDPC
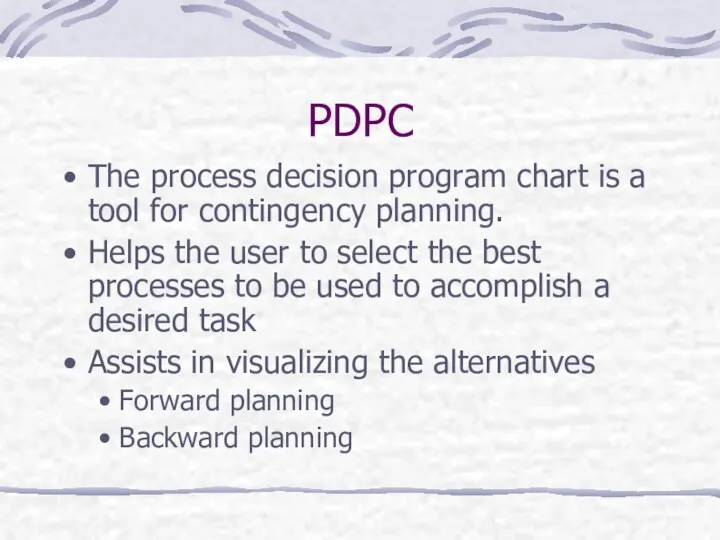
The process decision program chart is a tool for contingency planning.
PDPC
The process decision program chart is a tool for contingency planning.
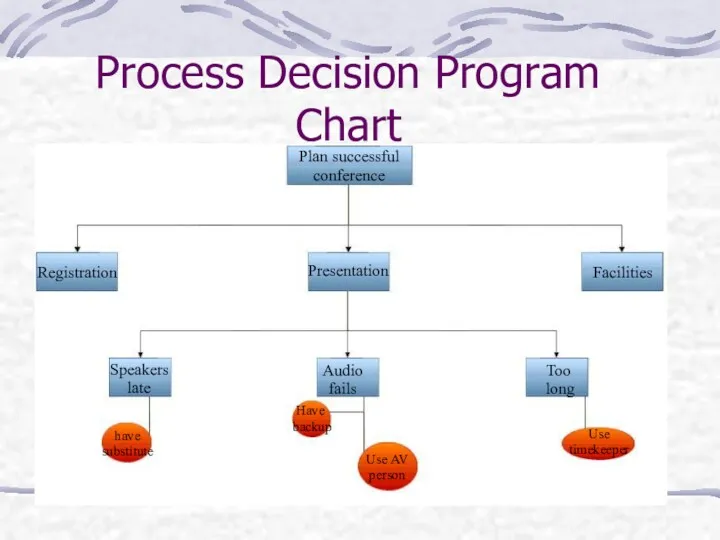
Process Decision Program Chart
Plan successful conference
Registration
Presentation
Facilities
Speakers
late
Audio
fails
Too
long
have
substitute
Have
backup
Use AV
person
Use
timekeeper
Process Decision Program Chart
Plan successful conference
Registration
Presentation
Facilities
Speakers
late
Audio
fails
Too
long
have
substitute
Have
backup
Use AV
person
Use
timekeeper
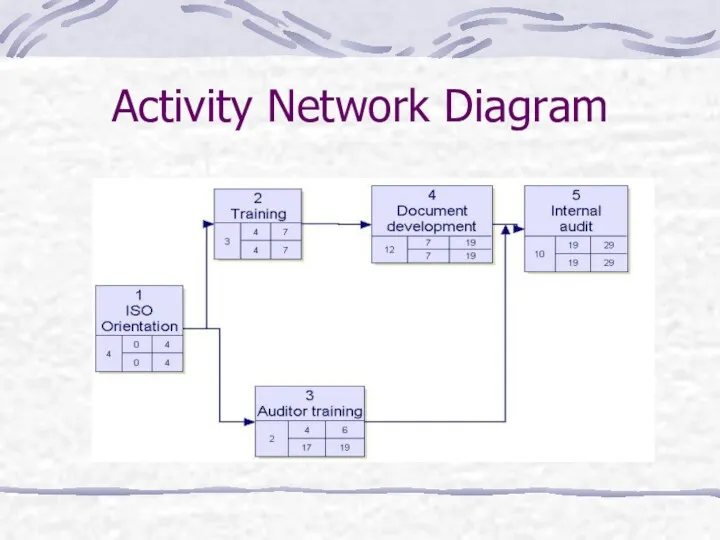
Activity Network Diagram
Activity Network Diagram
Activity Network Diagram
What it does?
When to use it:
The task is a
Activity Network Diagram
What it does?
When to use it:
The task is a
Activity Network Design
Some other versions of this method
PERT chart
Programme evaluation review
Activity Network Design
Some other versions of this method
PERT chart
Programme evaluation review
Quality Control Tools
Cause & Effect (Fish bone)
Flow Chart
Run Chart
Control Chart
Histogram
Pareto Chart
Quality Control Tools
Cause & Effect (Fish bone)
Flow Chart
Run Chart
Control Chart
Histogram
Pareto Chart
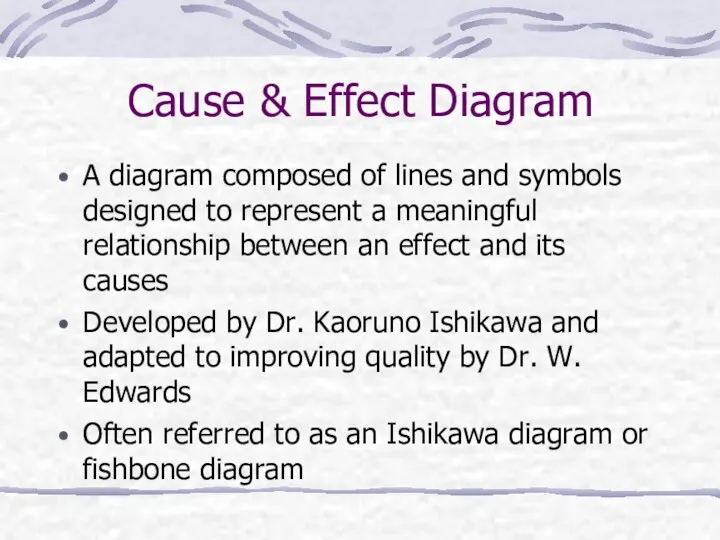
Cause & Effect Diagram
Cause & Effect Diagram
Flow Charts
A flow chart is a pictorial representation showing all of
Flow Charts
A flow chart is a pictorial representation showing all of
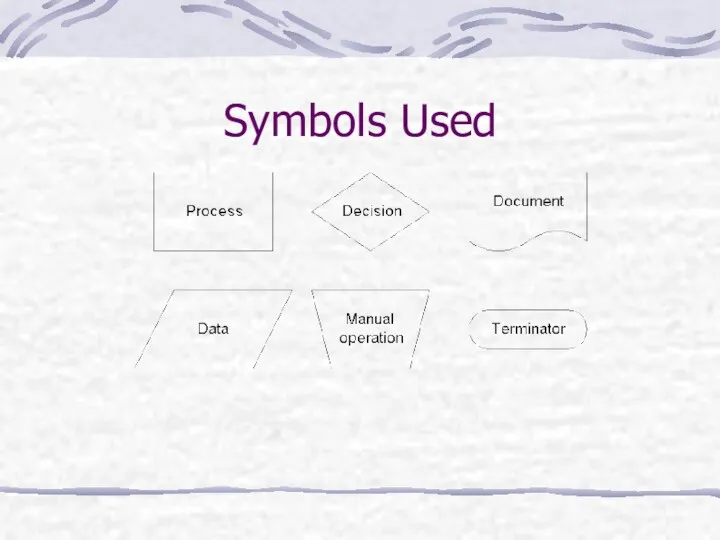
Symbols Used
Symbols Used
Run Chart
Run chart allows teams to study observed data for trends
Run Chart
Run chart allows teams to study observed data for trends
Control Chart
A statistical control chart is a graphic comparison of process
Control Chart
A statistical control chart is a graphic comparison of process
Control Chart
Benefits
Monitor process variation over time
Differentiate between special cause and common
Control Chart
Benefits
Monitor process variation over time
Differentiate between special cause and common
Control Chart
Types of Control charts
Attribute Data
Data that results from counting the
Control Chart
Types of Control charts
Attribute Data
Data that results from counting the
Control Chart
Three types of of charts:
X-Bar and R Chart
Individual X and
Control Chart
Three types of of charts:
X-Bar and R Chart
Individual X and
Histogram
A histogram is a graphic summary of variation in a set
Histogram
A histogram is a graphic summary of variation in a set
Pareto Chart
Pareto analysis is a ranked comparison of factors related to
Pareto Chart
Pareto analysis is a ranked comparison of factors related to
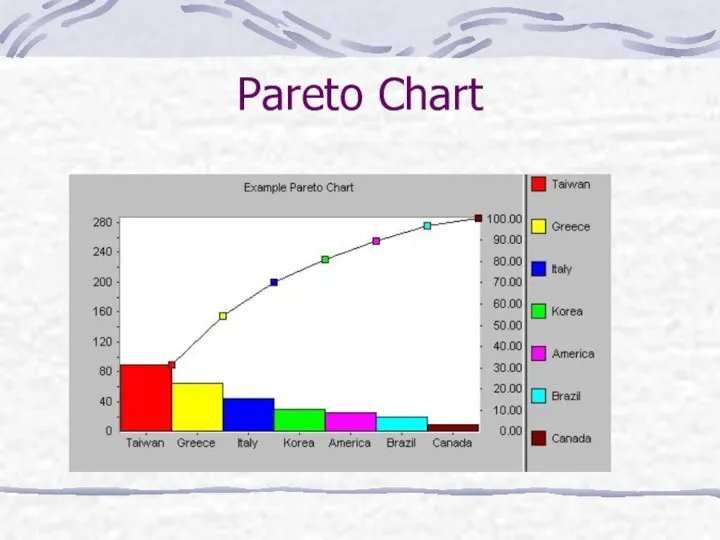
Pareto Chart
Pareto Chart
Creativity Tools
Brainwriting 6-3-5
Classic Brainstorming
Imaginary Brainstorming
Knowledge mapping
Morphological Box
Picture Associations and Biotechniques
Problem Reformulation
Purpose
Creativity Tools
Brainwriting 6-3-5
Classic Brainstorming
Imaginary Brainstorming
Knowledge mapping
Morphological Box
Picture Associations and Biotechniques
Problem Reformulation
Purpose
 Возникновение и исторические этапы развития научного менеджмента
 Система менеджмента качества (СМК)
 Приглашение - это искусство назначения встреч. Основные правила
 Грейдовые системы оплаты труда и возможность их применения в казахстанских фирмах
 Научные школы на которых базируется стратегическое государственное управление
 Басқару және ынтымақтастық
 Управление человеческими ресурсами
 Реструктуризация как способ управления стоимостью бизнеса
 Overcoming obstacles. Chapter 12
 Внутренние стандарты качества в гостиницах
 Технологические основы принятия управленческих решению
 Понятие транспортной организации и транспортного обслуживания
 Pr-технологии в государственном и муниципальном управлении
 Планирование задач проекта в Microsoft Office Project
 Инициирование проекта
 Introduction to Human Resource management
 Японська модель менеджменту
 Кошачье кафе
 Складская логистика
 Международные тарифы на рынке мультимодальных перевозок
 Управление рисками на предприятии (на примере ПАО Биосинтез)
 Стандарты обслуживания покупателей в магазине
 Основы государственного и муниципального управления
 Organizacja jako system otwarty i społeczno-techniczny. (Wyklad 2)
 Антикризисное управление
 Менеджмент эволюциясы
 Риск-ориентированный подход в DIS ISO 9001:2015
 Методы и средства квалиметрии