- Service Quality & Customer Experience Management

Содержание
- 2. CEM & SQM & NPM – Huawei’s Capability SmartCare® Business Value on a Customer Case Use
- 3. CEM / SQM / NPM / SOC – Huawei’s Capability
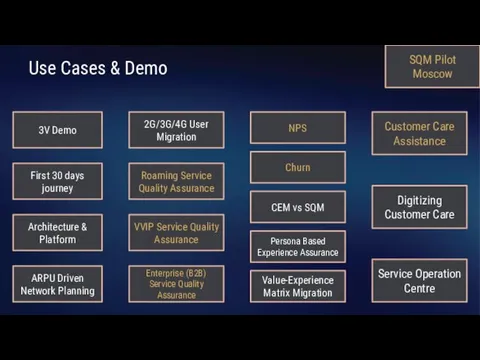
- 4. What Huawei can deliver Platform CEM SQM NPM Geo-Location Optimization Tracing Service Set of Use Case
- 5. CEM & SQM & NPM – Huawei’s Capability SmartCare® Business Value on a Customer Case Use
- 6. Savings and Earnings by Huawei CEM Platform (CCF) Legend: Details per stream are presented in further
- 7. Savings and Earnings by Huawei CEM Platform (Overview) Estimated benefits from CEM Platform on a level
- 8. CEM & SQM & NPM – Huawei’s Capability SmartCare® Business Value on a Customer Case Use
- 9. 3V Demo Architecture & Platform First 30 days journey Use Cases & Demo Roaming Service Quality
- 10. CEM & SQM & NPM – Huawei’s Capability SmartCare® Business Value on a Customer Cases Use
- 11. …delivered projects with tangible value Huawei SmartCare® is Leading the CEM Industry
- 12. Huawei CEM World Class
- 13. HUAWEI SmartCare® 3rd Party Partners
- 15. Appendix & Supportive Materials
- 16. Group C – OPEX Savings in Consumer Operations OPEX Savings in Consumer Operations Efficient CC activity
- 17. Consumer Operations OPEX Savings Calculation Approach Complaints 1,059,872 0.012% per User All Calls 86 Mio per
- 18. Call Centre OPEX reduction – details and clarifications 15% CE / SQ deterioration caused by network
- 19. Group T – Technology Operations and Service Management Savings 0.4 Mio By experience from many MS
- 20. Technology Operations OPEX Savings Estimation (EU TT related) CEM shows NE chain impacting CE / SQ
- 21. Business Services – Efficient Operation and extra Revenue 1.3 Mio Extra support for Enterprises / B2B
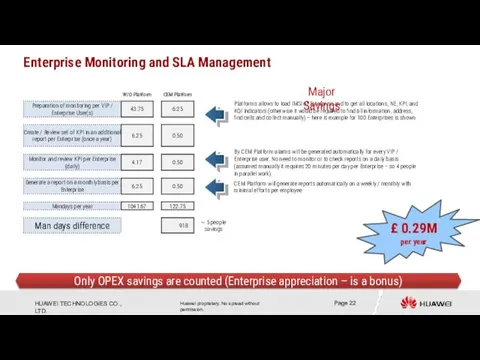
- 22. Only OPEX savings are counted (Enterprise appreciation – is a bonus) Enterprise Monitoring and SLA Management
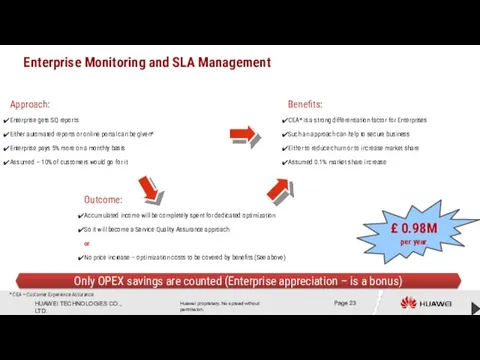
- 23. Only OPEX savings are counted (Enterprise appreciation – is a bonus) Enterprise Monitoring and SLA Management
- 24. Network Strategy and Core – Efficient Operation and extra Revenue 2.5 Mio Extra support for Enterprises
- 25. Business Case Traffic / ARPU / Complaints Planning driven – OPEX Savings 583 60 Manually with
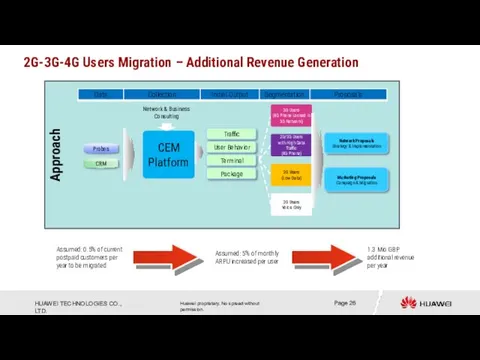
- 26. Approach 2G-3G-4G Users Migration – Additional Revenue Generation
- 27. Roaming Business Leakage Retention – Additional Revenue Assumed: due optimized network the number of active inbound
- 28. Digital Marketing – data usage / CE / SQ Info via MyApp and online* Digital and
- 29. Data Query Calls Efficiency Improvement – OPEX savings 2 min Data Query Calls CC Agent can
- 30. SmartCare® Business Value on a Customer Case Use Cases Set Global References & Why HUAWEI Appendix
- 31. 3V Demo – Supportive Materials
- 32. VIP / VIS / VIA Proactive Care Overview
- 33. 3V Dashboard
- 37. 3V Demo – end of supportive materials
- 38. First 30 days journey – Supportive Materials
- 39. First 30-Day Journey Winner of “Best CEM Culture Transformation Program”
- 40. Complete View of the 30-day Journey
- 41. Complete View of the 30-day Journey
- 42. First 30 days journey – end of supportive materials
- 43. Architecture & Platform – Supportive Materials
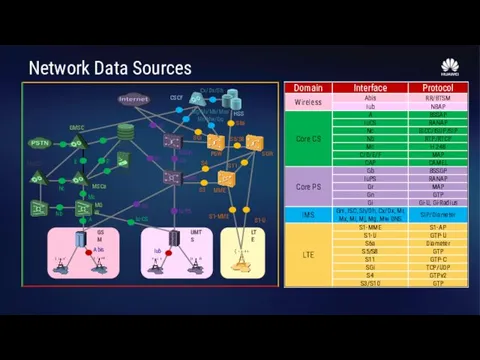
- 44. S1-U SGW Network Data Sources
- 45. 500 Gbps probe capability & 1800+ protocols identification Platform Architecture
- 46. CEM Platform to deliver value through use cases SEQ Analyst Report Engine Data Mediation and Preprocessing
- 47. Architecture & Platform – end of supportive materials
- 48. ARPU Driven Network Planning – Supportive Materials
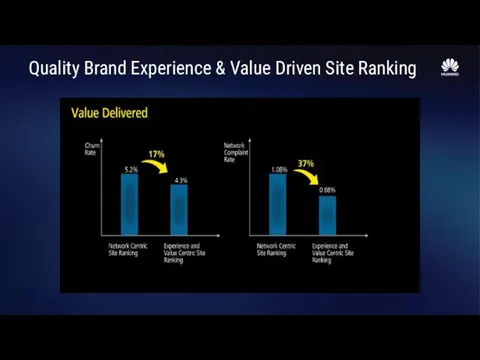
- 49. Quality Brand Experience & Value Driven Site Ranking
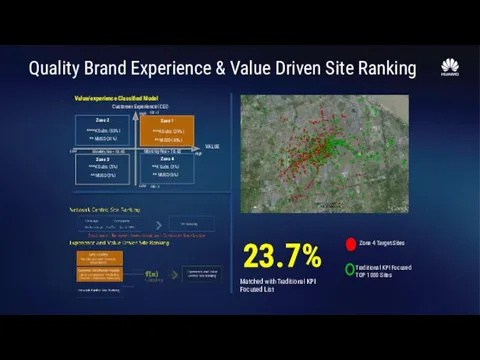
- 50. Value/experience Classified Model Quality Brand Experience & Value Driven Site Ranking
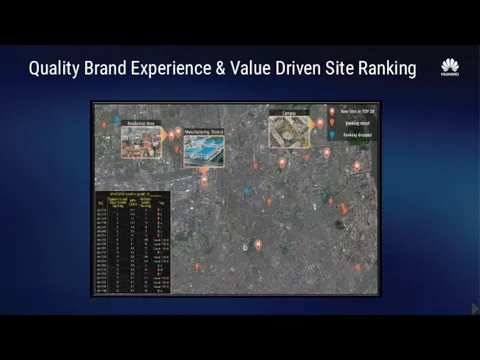
- 51. Quality Brand Experience & Value Driven Site Ranking
- 52. Quality Brand Experience & Value Driven Site Ranking
- 53. ARPU Driven Network Planning – end of supportive materials
- 54. 2G/3G/4G User Migration – Supportive Materials
- 55. 2G to 3G to 4G Subscriber Migration Matrix 2G/3G Terminal 4G Terminal 4G Network 2G/3G Network
- 56. Migration Analytics to Action Overview 2 4G fall back subscriber 7 3G fall back subscriber A
- 57. 20X MB / Data Subscriber / day 2014/4/3 2014/8/21 8% in 2013 2014/4/3 2014/8/21 30% Natural
- 58. 2G/3G/4G User Migration – end of supportive materials
- 59. Roaming Service Quality Assurance – Supportive Materials
- 60. Solution Overview
- 61. Roaming Quality Monitoring Select carrier Select KPI Configure threshold Perform monitoring Key Monitored Contents: Number of
- 62. Inbound and outbound roaming KPI ranking Failure analysis and detail record analysis Performance Ranking Performance Trend
- 63. Identify steering status of carriers in different countries Steering identification Steering failure analysis Steering failure code
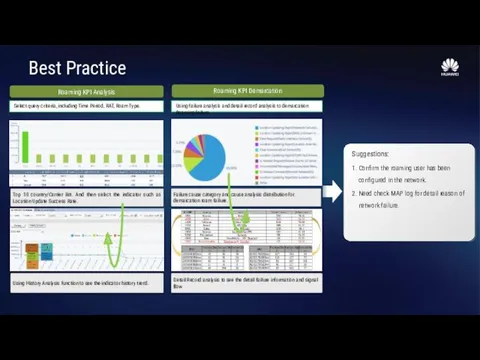
- 64. Best Practice
- 65. International Roaming Issues SMC HLR RNC Node B 3G Iub BTS BSC Abis GRX SGSN (PCU)
- 66. Roaming Business More Effectively
- 67. Roaming Service Quality Assurance – Supportive Materials
- 68. VVIP Service Quality Assurance – Supportive Materials
- 69. VIP Assurance 360°VIP Understanding: What application the VIP is using. - HTTP, Video, MMS, WAP, FTP,
- 70. VIP and VIP Groups Real Time Monitoring VIP Management : 1 000 VVIPs Real-time Care 2
- 71. VIP Experience Insight User 1, High revenue generator Like surfing in internet and prefer Youtube Real-time
- 72. VVIP Service Quality Assurance – Supportive Materials
- 73. Customer Experience from whole Customer Journey Advertisement Product Information Product Comparison Subscribing Activating Using Paying Requesting
- 74. Journey and Touch Points – Experience is in between
- 75. Contract Prolongation Experience Pro-active care experience Selection Experience Trouble Resolution Experience Use Experience Response Experience Activation
- 76. Snapshot to show Impact to User Experience Using Sharing Trouble resolution request Getting resolution Change Request
- 77. How it works – Info to be gathered from whole ICT Using Sharing Trouble resolution request
- 78. See at whole and by details to improve by Influencer CEI (or NPS) Marketing Billing Network
- 79. Huawei’s CEM Solution under the name SmartCare®
- 80. Service Quality Management CEM or SQM What is the difference?
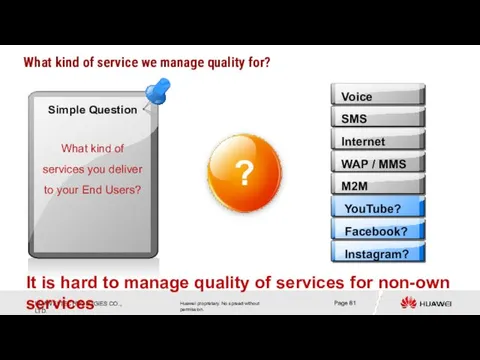
- 81. Internet WAP / MMS M2M Voice Facebook? Instagram? SMS It is hard to manage quality of
- 82. SQM is a typical entity existing almost in all network operators From QoS via Service Quality
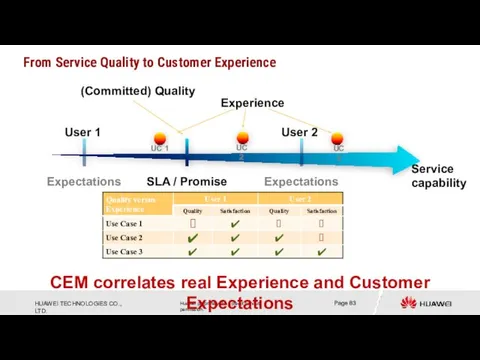
- 83. Experience Service capability CEM correlates real Experience and Customer Expectations From Service Quality to Customer Experience
- 84. Objective measures Subjective measures Aggregation in all journeys and in the user level Aggregation in the
- 85. CEM Summary – from traditional QoS to QoE driven CEM Enhanced SQM by customer journey and
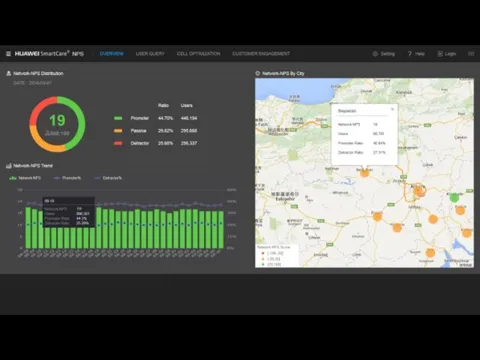
- 86. Net Promoter Score
- 87. VALIDATE POSITIVE IMPACT OF IMPROVING NPS
- 88. UNCOVER NPS INFLUENCING FACTORS PER PERSONA Factors Where The Customer Expectation is High are HYGIENE FACTORS.
- 89. PERSONA BASE NPS IMPROVEMENT APPROACH Reduce Detractors & Monetize Promoters
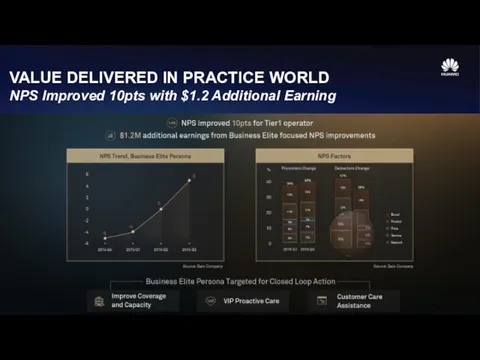
- 90. VALUE DELIVERED IN PRACTICE WORLD NPS Improved 10pts with $1.2 Additional Earning
- 91. NPS Detractors – not a one but many different groups All Users are different and their
- 92. Net Promoter Score Prediction Framework 8000 DNA-pattern maps Source: 24 countries Approach: Individual User Level …
- 93. Let us imagine – measured NPS is 10 (%) 10 Shall we use same improvement mechanism
- 94. User Centric Differentiated Quality Excellence Address Expectations of every NPS Score Group Benchmarking Best capability Newest
- 95. NPS Demo
- 100. Churn Prediction – Details
- 101. Why we should manage Churn? New subscriber attraction cost is 3..10 times higher than retention cost
- 102. FORMULA OF ANTI-CHURN
- 103. Methodology Better Result by Experience Oriented Churn Detection SmartCare Churn Prediction Model Based on Experience Data
- 104. Decide to leave Transition Point Real Churn Point Customer usage based analytics from BSS data only
- 105. Customer Segmentation From contract based segmentation MOT Design 1: 6 types of persona based customer segmentation
- 106. Reference Case - early predication & MOT improve retention effect greatly The churn rate of “Retention
- 107. Achieved 2.4% Churn Rate Reduction ~49,000 Subscribers successfully retained during 7 months (Jun-Dec 2015) 2.4 Pct.
- 108. Output
- 109. Data Explorer Demo – Churn
- 110. In this demo we monitor all users to identify churners among them
- 111. More details are available with a list of potential churners for actions
- 112. Churn Cause Analysis helps to identify Root Causes for churners
- 113. The group to address first Different value groups show customers that bring more value to address
- 114. Even the most preferred communication channel identified & recommended
- 115. Customer Care Assistance Module
- 116. CCA – Call Center Agent Interface
- 117. CCA – Data Query Interface
- 119. SOC to close the loop in the whole Customer Lifecycle Journey
- 120. Service Centric Operations -> Network + Service NOC SOC Network KPI SLA MTTR Experience KQI CSAT
- 121. External Operation Driven By SOC Tools Processes Organization
- 122. Example of NOC-SOC Synergy SOC NOC Service Quality Monitoring & Reporting Service Problem Demarcation Troubleshooting &
- 123. Huawei has delivered already 30+ SOC over the world Service Operation Centre will enhance customer life
- 124. Separator
- 125. Value-Experience Matrix Migration Result in Operator X 1X.x% improvement in revenue Subscriber are shifting towards good
- 126. Separator
- 127. General Description
- 128. Solution Overview User distribution User quantity trend Traffic trend Application-based traffic distribution Range-based traffic distribution User-based
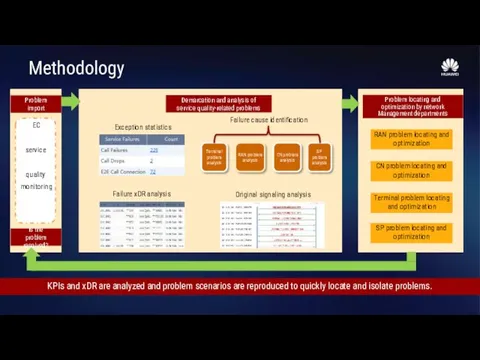
- 129. Methodology KPIs and xDR are analyzed and problem scenarios are reproduced to quickly locate and isolate
- 130. Best Practice
- 131. Separator
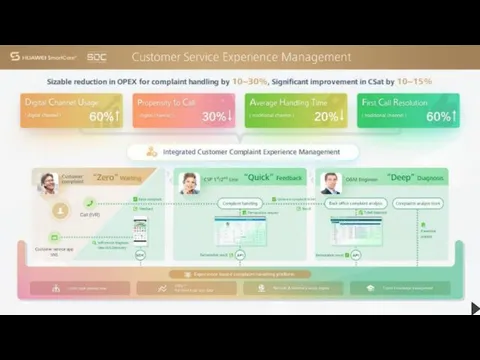
- 132. Digitizing Customer Care
- 133. Digitizing Customer Care
- 134. Digitizing Customer Care
- 135. Digitizing Customer Care
- 136. Separator
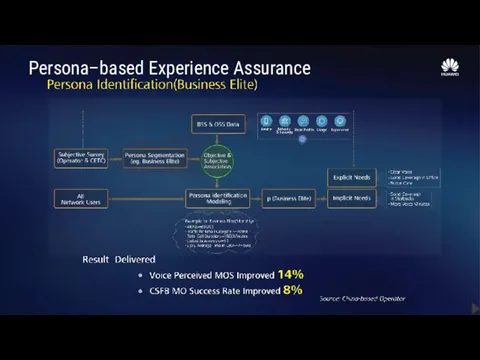
- 137. Persona–based Experience Assurance
- 138. Persona–based Experience Assurance
- 139. Persona–based Experience Assurance
- 140. Separator
- 141. Scope of Pilot – Use Case Delivery 5 Use Cases supporting operation & maintenance has been
- 142. UC 1 Implementation & Verification Milestones & Progress Feb Apr Mar Jan 03.01 04.0 02.01 01.01
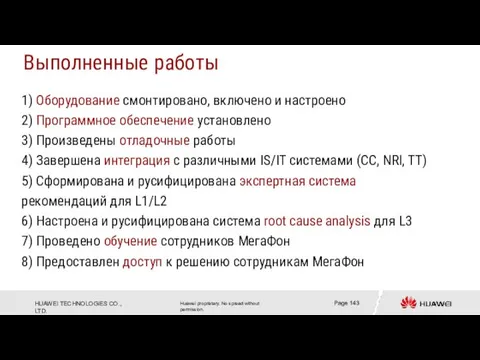
- 143. 1) Оборудование смонтировано, включено и настроено 2) Программное обеспечение установлено 3) Произведены отладочные работы 4) Завершена
- 144. 1) Проверка полноты и целостности входных данных 2) Калибровка KPI/KQI, установка пороговых значений аварий 3) Реализация,
- 145. Собираемые KPI
- 147. Скачать презентацию
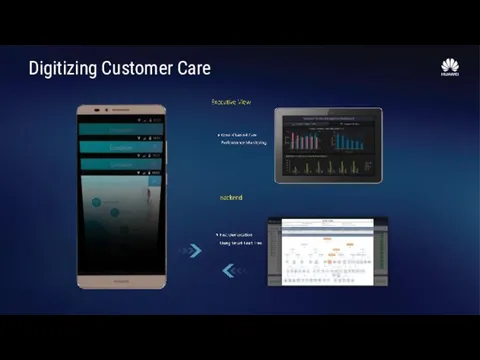
CEM & SQM & NPM – Huawei’s Capability
SmartCare® Business Value on
CEM & SQM & NPM – Huawei’s Capability
SmartCare® Business Value on
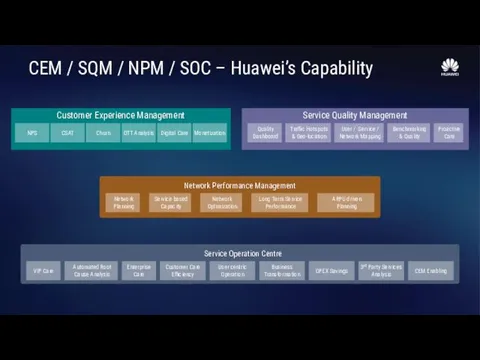
CEM / SQM / NPM / SOC – Huawei’s Capability
CEM / SQM / NPM / SOC – Huawei’s Capability
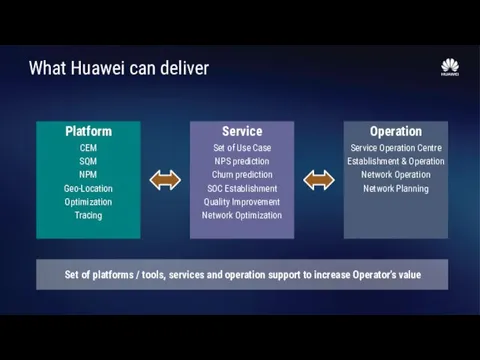
What Huawei can deliver
Platform
CEM
SQM
NPM
Geo-Location
Optimization
Tracing
Service
Set of Use Case
NPS prediction
Churn prediction
SOC Establishment
Quality Improvement
Network
What Huawei can deliver
Platform
CEM
SQM
NPM
Geo-Location
Optimization
Tracing
Service
Set of Use Case
NPS prediction
Churn prediction
SOC Establishment
Quality Improvement
Network
CEM & SQM & NPM – Huawei’s Capability
SmartCare® Business Value on
CEM & SQM & NPM – Huawei’s Capability
SmartCare® Business Value on
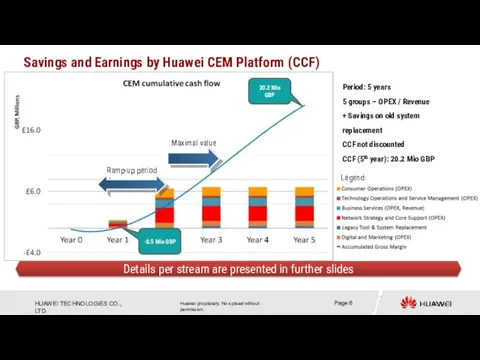
Savings and Earnings by Huawei CEM Platform (CCF)
Legend:
Details per stream are
Savings and Earnings by Huawei CEM Platform (CCF)
Legend:
Details per stream are
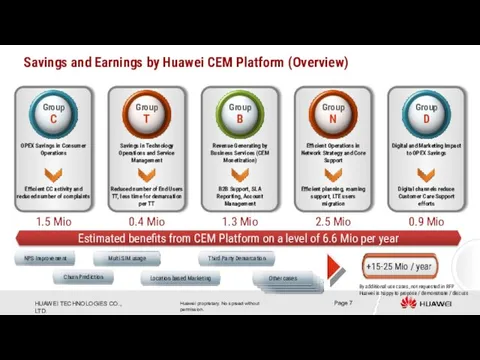
Savings and Earnings by Huawei CEM Platform (Overview)
Estimated benefits from CEM
Savings and Earnings by Huawei CEM Platform (Overview)
Estimated benefits from CEM
CEM & SQM & NPM – Huawei’s Capability
SmartCare® Business Value on
CEM & SQM & NPM – Huawei’s Capability
SmartCare® Business Value on
3V Demo
Architecture & Platform
First 30 days journey
Use Cases & Demo
Roaming Service
3V Demo
Architecture & Platform
First 30 days journey
Use Cases & Demo
Roaming Service
CEM & SQM & NPM – Huawei’s Capability
SmartCare® Business Value on
CEM & SQM & NPM – Huawei’s Capability
SmartCare® Business Value on
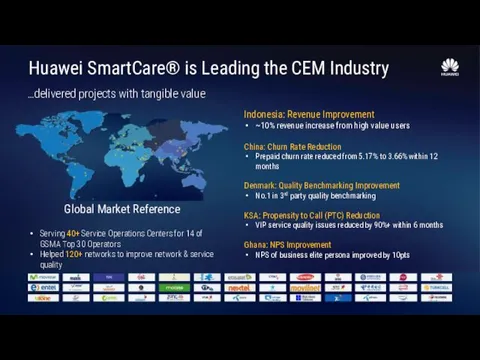
…delivered projects with tangible value
Huawei SmartCare® is Leading the CEM Industry
…delivered projects with tangible value
Huawei SmartCare® is Leading the CEM Industry
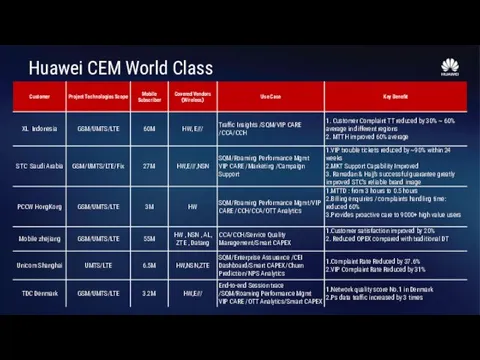
Huawei CEM World Class
Huawei CEM World Class
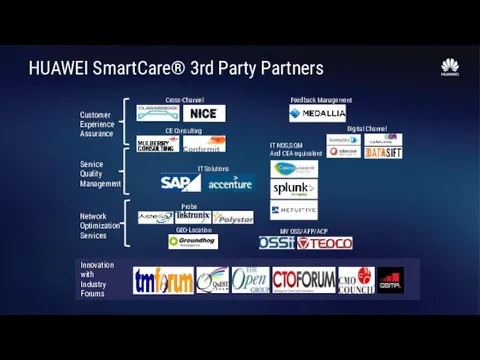
HUAWEI SmartCare® 3rd Party Partners
HUAWEI SmartCare® 3rd Party Partners


Appendix & Supportive Materials
Appendix & Supportive Materials
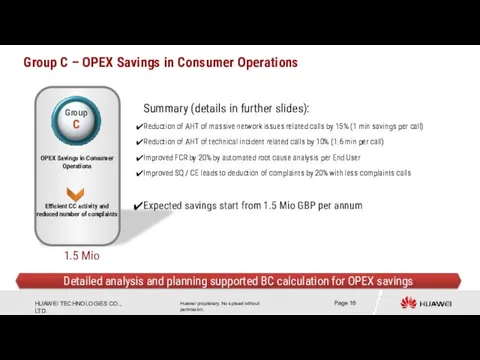
Group C – OPEX Savings in Consumer Operations
OPEX Savings in Consumer
Group C – OPEX Savings in Consumer Operations
OPEX Savings in Consumer
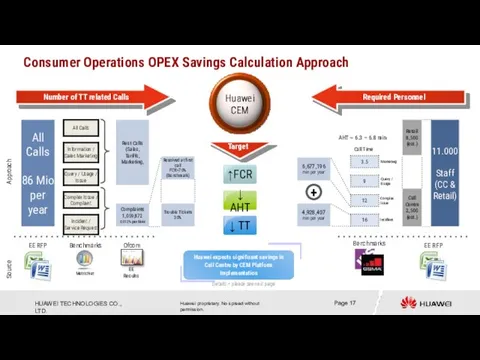
Consumer Operations OPEX Savings Calculation Approach
Complaints
1,059,872
0.012% per User
All Calls
86 Mio per
Consumer Operations OPEX Savings Calculation Approach
Complaints
1,059,872
0.012% per User
All Calls
86 Mio per
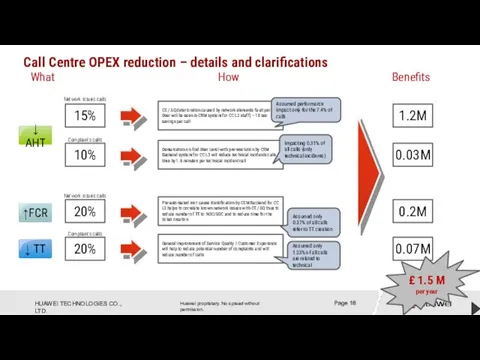
Call Centre OPEX reduction – details and clarifications
15%
CE / SQ deterioration
Call Centre OPEX reduction – details and clarifications
15%
CE / SQ deterioration
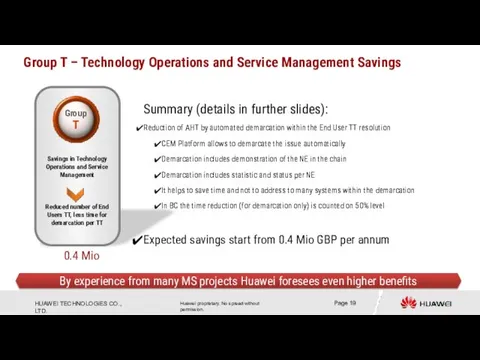
Group T – Technology Operations and Service Management Savings
0.4 Mio
By experience
Group T – Technology Operations and Service Management Savings
0.4 Mio
By experience
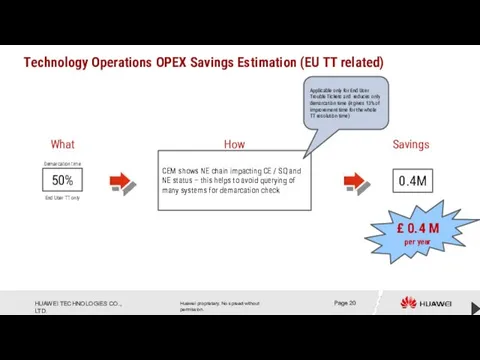
Technology Operations OPEX Savings Estimation (EU TT related)
CEM shows NE chain
Technology Operations OPEX Savings Estimation (EU TT related)
CEM shows NE chain
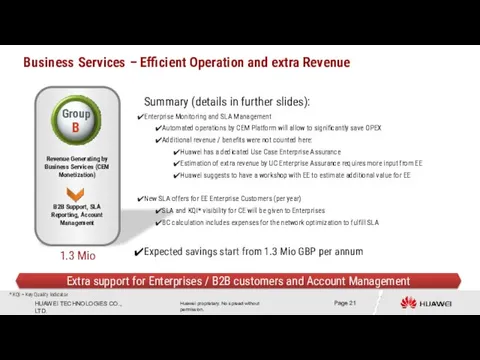
Business Services – Efficient Operation and extra Revenue
1.3 Mio
Extra support for
Business Services – Efficient Operation and extra Revenue
1.3 Mio
Extra support for
Only OPEX savings are counted (Enterprise appreciation – is a bonus)
Enterprise
Only OPEX savings are counted (Enterprise appreciation – is a bonus)
Enterprise
Only OPEX savings are counted (Enterprise appreciation – is a bonus)
Enterprise
Only OPEX savings are counted (Enterprise appreciation – is a bonus)
Enterprise
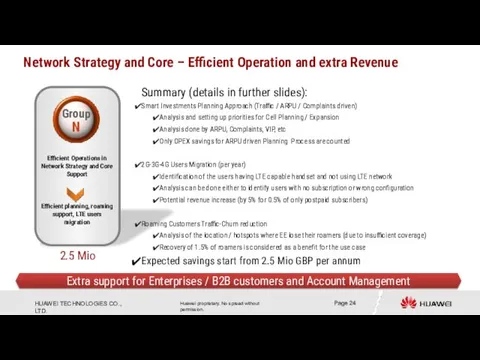
Network Strategy and Core – Efficient Operation and extra Revenue
2.5 Mio
Extra
Network Strategy and Core – Efficient Operation and extra Revenue
2.5 Mio
Extra
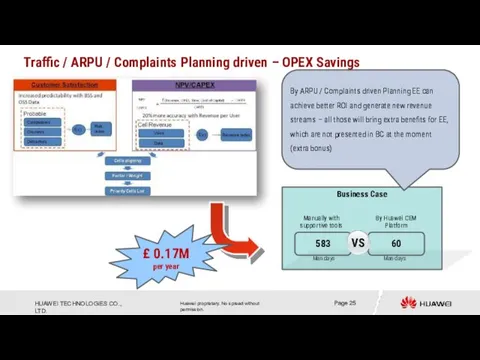
Business Case
Traffic / ARPU / Complaints Planning driven – OPEX Savings
583
60
Manually
Business Case
Traffic / ARPU / Complaints Planning driven – OPEX Savings
583
60
Manually
Approach
2G-3G-4G Users Migration – Additional Revenue Generation
Approach
2G-3G-4G Users Migration – Additional Revenue Generation
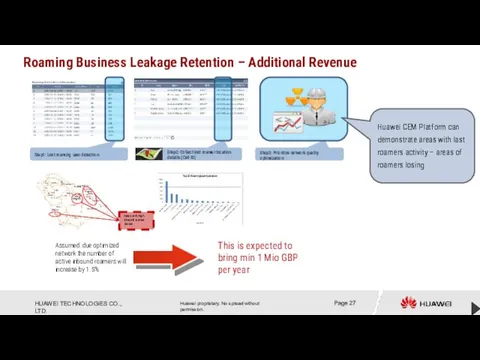
Roaming Business Leakage Retention – Additional Revenue
Assumed: due optimized network the
Roaming Business Leakage Retention – Additional Revenue
Assumed: due optimized network the
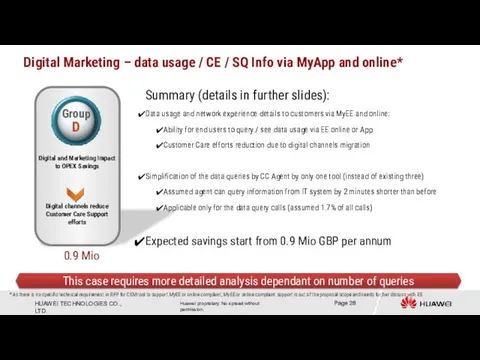
Digital Marketing – data usage / CE / SQ Info via
Digital Marketing – data usage / CE / SQ Info via
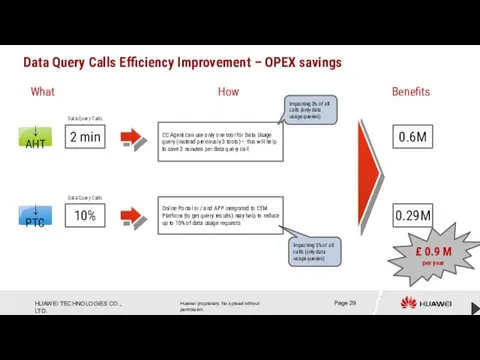
Data Query Calls Efficiency Improvement – OPEX savings
2 min
Data Query Calls
CC
Data Query Calls Efficiency Improvement – OPEX savings
2 min
Data Query Calls
CC
SmartCare® Business Value on a Customer Case
Use Cases Set
Global References &
SmartCare® Business Value on a Customer Case
Use Cases Set
Global References &

3V Demo – Supportive Materials
3V Demo – Supportive Materials
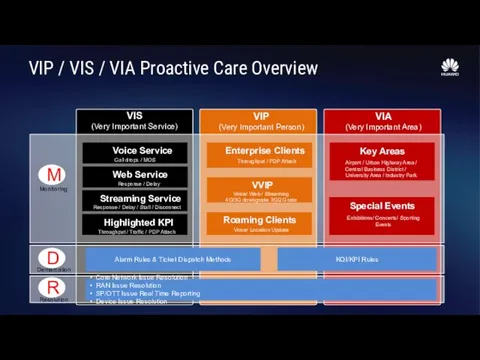
VIP / VIS / VIA Proactive Care Overview
VIP / VIS / VIA Proactive Care Overview
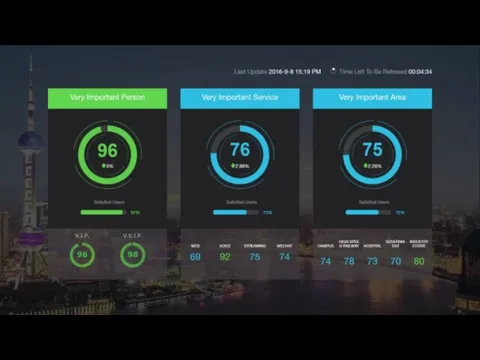
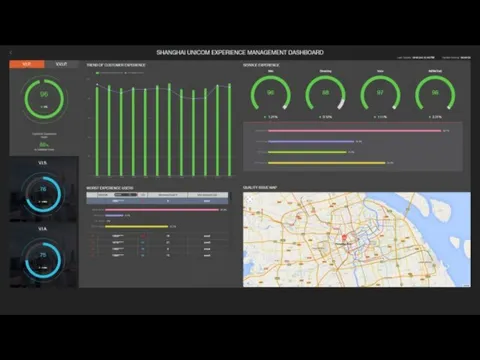
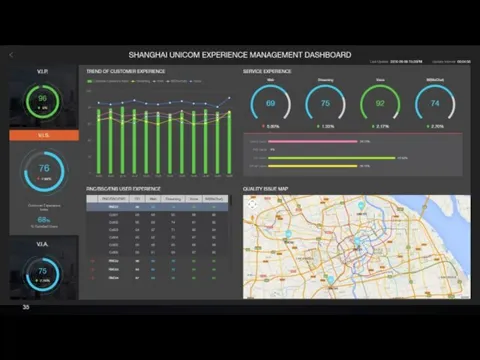
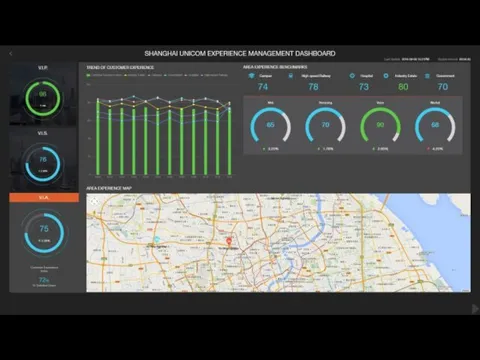
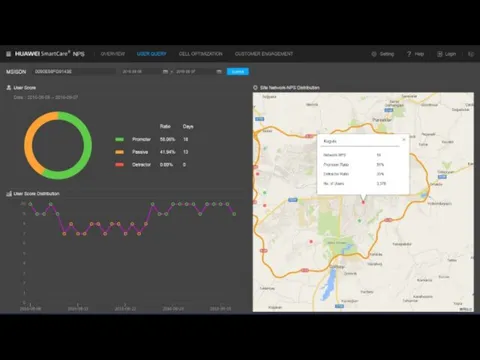
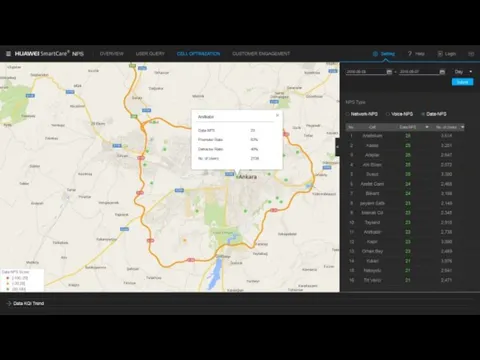
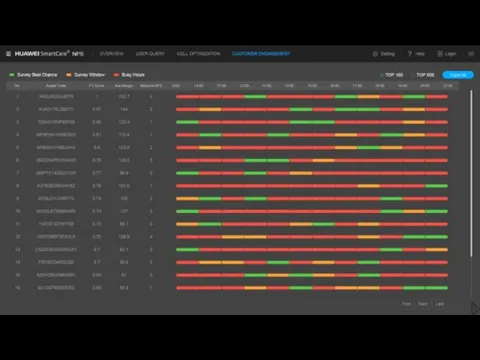
3V Dashboard
3V Dashboard

3V Demo – end of supportive materials
3V Demo – end of supportive materials

First 30 days journey – Supportive Materials
First 30 days journey – Supportive Materials
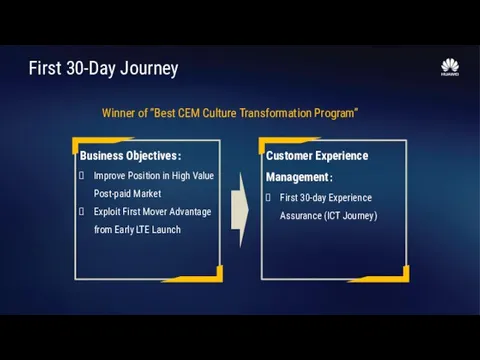
First 30-Day Journey
Winner of “Best CEM Culture Transformation Program”
First 30-Day Journey
Winner of “Best CEM Culture Transformation Program”
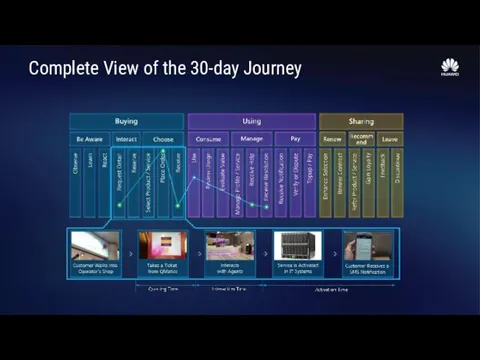
Complete View of the 30-day Journey
Complete View of the 30-day Journey
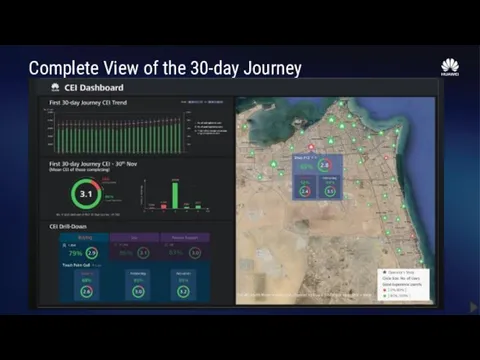
Complete View of the 30-day Journey
Complete View of the 30-day Journey

First 30 days journey – end of supportive materials
First 30 days journey – end of supportive materials

Architecture & Platform – Supportive Materials
Architecture & Platform – Supportive Materials
S1-U
SGW
Network Data Sources
S1-U
SGW
Network Data Sources
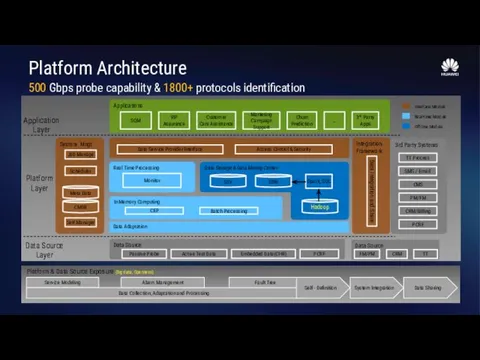
500 Gbps probe capability & 1800+ protocols identification
Platform Architecture
500 Gbps probe capability & 1800+ protocols identification
Platform Architecture
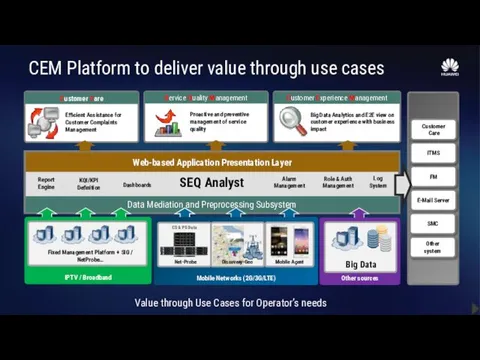
CEM Platform to deliver value through use cases
SEQ Analyst
Report
Engine
Data Mediation
CEM Platform to deliver value through use cases
SEQ Analyst
Report
Engine
Data Mediation

Architecture & Platform – end of supportive materials
Architecture & Platform – end of supportive materials

ARPU Driven Network Planning – Supportive Materials
ARPU Driven Network Planning – Supportive Materials
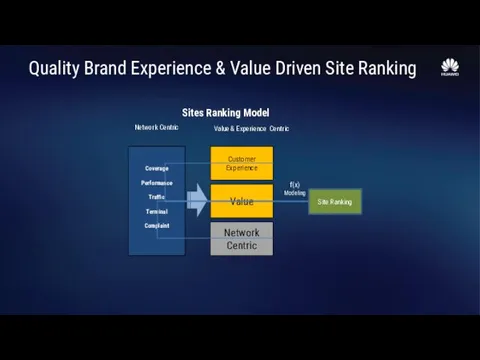
Quality Brand Experience & Value Driven Site Ranking
Quality Brand Experience & Value Driven Site Ranking
Value/experience Classified Model
Quality Brand Experience & Value Driven Site Ranking
Value/experience Classified Model
Quality Brand Experience & Value Driven Site Ranking
Quality Brand Experience & Value Driven Site Ranking
Quality Brand Experience & Value Driven Site Ranking
Quality Brand Experience & Value Driven Site Ranking
Quality Brand Experience & Value Driven Site Ranking

ARPU Driven Network Planning – end of supportive materials
ARPU Driven Network Planning – end of supportive materials

2G/3G/4G User Migration – Supportive Materials
2G/3G/4G User Migration – Supportive Materials
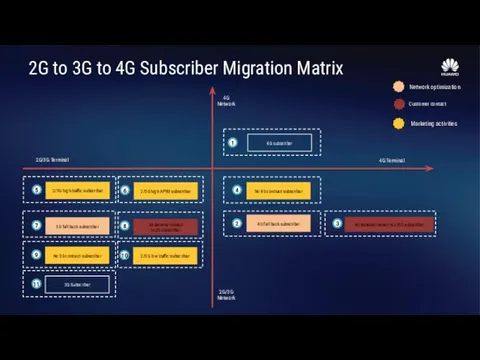
2G to 3G to 4G Subscriber Migration Matrix
2G/3G Terminal
4G Terminal
4G
Network
2G/3G
Network
1
4G subscriber
2G to 3G to 4G Subscriber Migration Matrix
2G/3G Terminal
4G Terminal
4G
Network
2G/3G
Network
1
4G subscriber
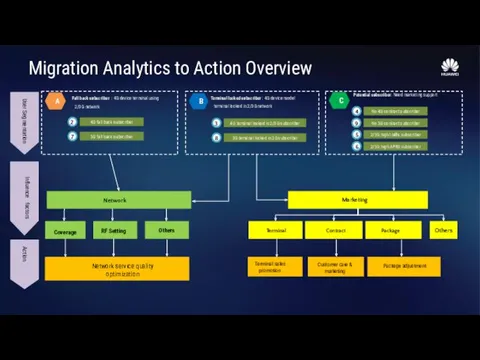
Migration Analytics to Action Overview
2
4G fall back subscriber
7
3G fall back
Migration Analytics to Action Overview
2
4G fall back subscriber
7
3G fall back
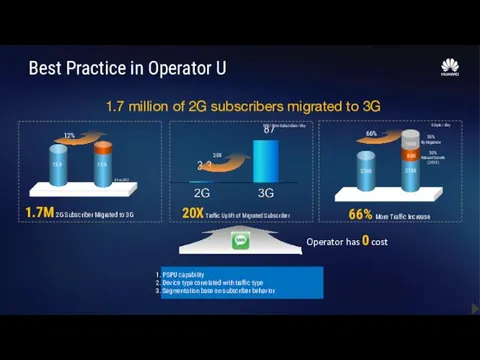
20X
MB / Data Subscriber / day
2014/4/3
2014/8/21
8% in 2013
2014/4/3
2014/8/21
30%
Natural Growth
( 2013)
1.7M
20X
MB / Data Subscriber / day
2014/4/3
2014/8/21
8% in 2013
2014/4/3
2014/8/21
30%
Natural Growth
( 2013)
1.7M

2G/3G/4G User Migration – end of supportive materials
2G/3G/4G User Migration – end of supportive materials

Roaming Service Quality Assurance – Supportive Materials
Roaming Service Quality Assurance – Supportive Materials
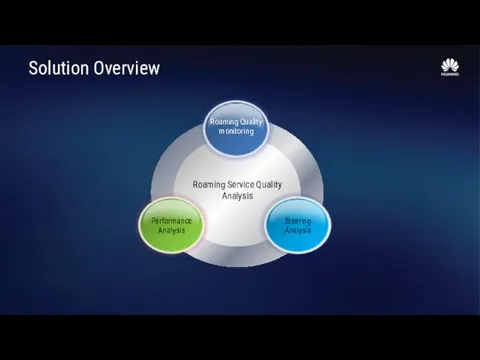
Solution Overview
Solution Overview
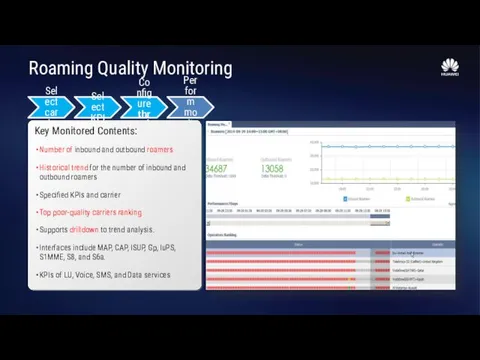
Roaming Quality Monitoring
Select carrier
Select KPI
Configure threshold
Perform monitoring
Key Monitored Contents:
Number of inbound
Roaming Quality Monitoring
Select carrier
Select KPI
Configure threshold
Perform monitoring
Key Monitored Contents:
Number of inbound
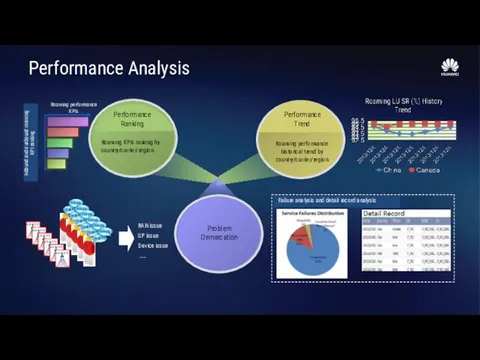
Inbound and outbound roaming KPI ranking
Failure analysis and detail record analysis
Performance
Inbound and outbound roaming KPI ranking
Failure analysis and detail record analysis
Performance
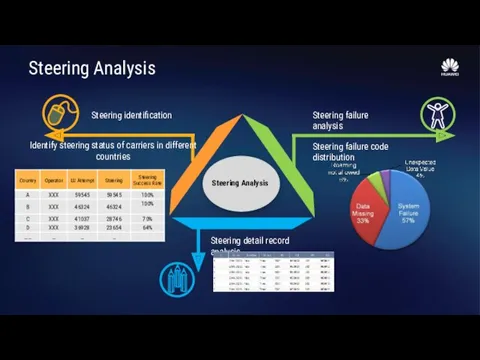
Identify steering status of carriers in different countries
Steering identification
Steering failure analysis
Steering
Identify steering status of carriers in different countries
Steering identification
Steering failure analysis
Steering
Best Practice
Best Practice
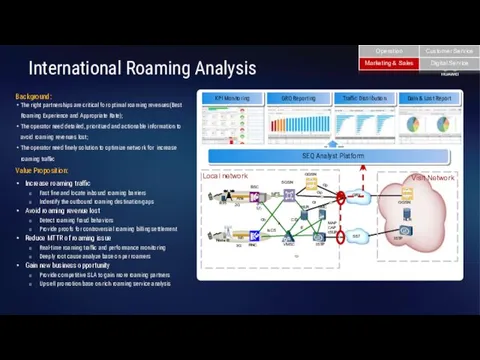
International Roaming Issues
SMC
HLR
RNC
Node B
3G
Iub
BTS
BSC
Abis
GRX
SGSN
(PCU)
2G
SS7
GGSN
ISTP
VMSC
ISTP
GGSN
HLR
Local network
Visit Network
A
IuCS
Gb
IuPS
CD
E
MAP
CAP
ISUP
Gr
Gp
Gp
KPI Monitoring
GRQ
International Roaming Issues
SMC
HLR
RNC
Node B
3G
Iub
BTS
BSC
Abis
GRX
SGSN
(PCU)
2G
SS7
GGSN
ISTP
VMSC
ISTP
GGSN
HLR
Local network
Visit Network
A
IuCS
Gb
IuPS
CD
E
MAP
CAP
ISUP
Gr
Gp
Gp
KPI Monitoring
GRQ
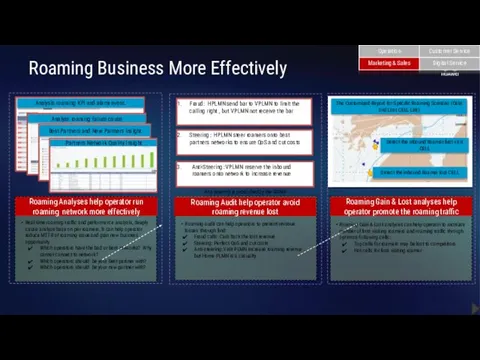
Roaming Business More Effectively
Roaming Business More Effectively

Roaming Service Quality Assurance – Supportive Materials
Roaming Service Quality Assurance – Supportive Materials

VVIP Service Quality Assurance – Supportive Materials
VVIP Service Quality Assurance – Supportive Materials
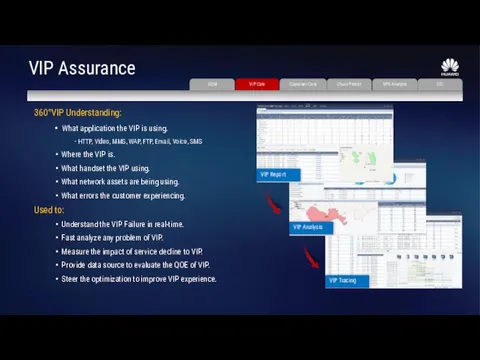
VIP Assurance
360°VIP Understanding:
What application the VIP is using.
- HTTP,
VIP Assurance
360°VIP Understanding:
What application the VIP is using.
- HTTP,
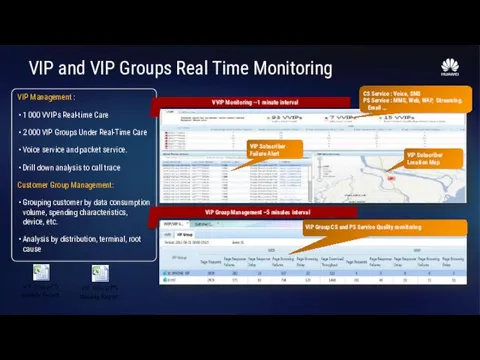
VIP and VIP Groups Real Time Monitoring
VIP Management :
1 000 VVIPs
VIP and VIP Groups Real Time Monitoring
VIP Management :
1 000 VVIPs
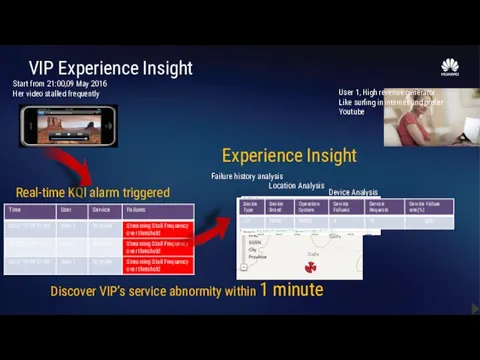
VIP Experience Insight
User 1, High revenue generator
Like surfing in internet and
VIP Experience Insight
User 1, High revenue generator
Like surfing in internet and

VVIP Service Quality Assurance – Supportive Materials
VVIP Service Quality Assurance – Supportive Materials
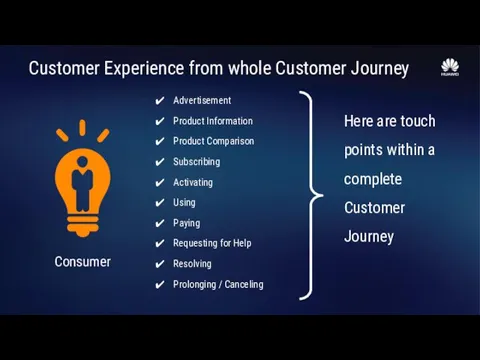
Customer Experience from whole Customer Journey
Advertisement
Product Information
Product Comparison
Subscribing
Activating
Using
Paying
Requesting for Help
Resolving
Prolonging /
Customer Experience from whole Customer Journey
Advertisement
Product Information
Product Comparison
Subscribing
Activating
Using
Paying
Requesting for Help
Resolving
Prolonging /
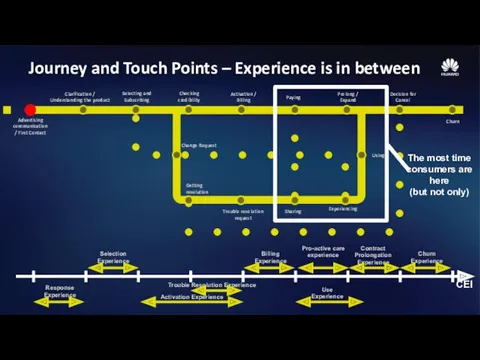
Journey and Touch Points – Experience is in between
Journey and Touch Points – Experience is in between
Contract Prolongation Experience
Pro-active care experience
Selection Experience
Trouble Resolution Experience
Use
Experience
Response Experience
Activation Experience
Churn Experience
Billing
Contract Prolongation Experience
Pro-active care experience
Selection Experience
Trouble Resolution Experience
Use
Experience
Response Experience
Activation Experience
Churn Experience
Billing
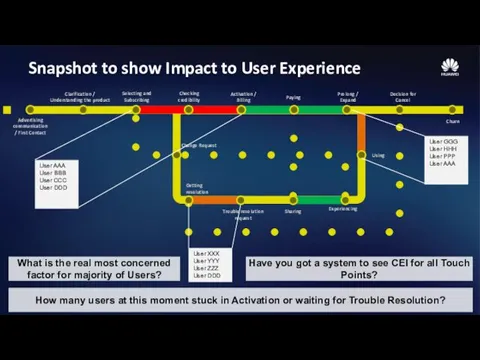
Snapshot to show Impact to User Experience
Using
Sharing
Trouble resolution request
Getting resolution
Change Request
Experiencing
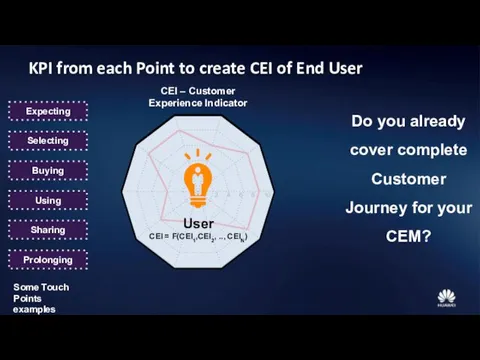
User
Snapshot to show Impact to User Experience
Using
Sharing
Trouble resolution request
Getting resolution
Change Request
Experiencing
User
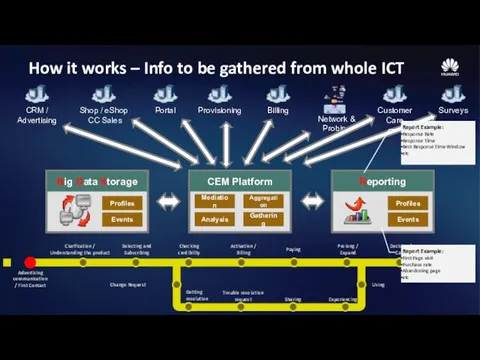
How it works – Info to be gathered from whole ICT
Using
Sharing
Trouble
How it works – Info to be gathered from whole ICT
Using
Sharing
Trouble
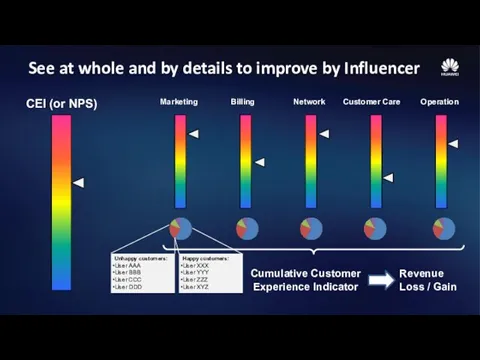
See at whole and by details to improve by Influencer
CEI (or
See at whole and by details to improve by Influencer
CEI (or
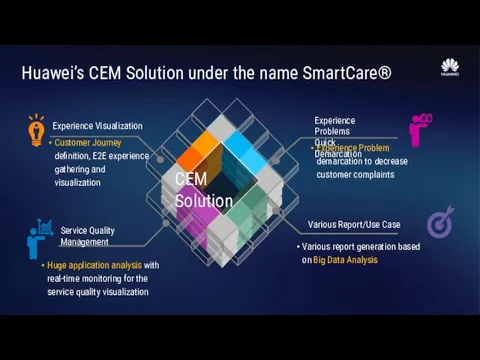
Huawei’s CEM Solution under the name SmartCare®
Huawei’s CEM Solution under the name SmartCare®
Service Quality Management
CEM or SQM
What is the difference?
Service Quality Management
CEM or SQM
What is the difference?
Internet
WAP / MMS
M2M
Voice
Facebook?
Instagram?
SMS
It is hard to manage quality of
Internet
WAP / MMS
M2M
Voice
Facebook?
Instagram?
SMS
It is hard to manage quality of
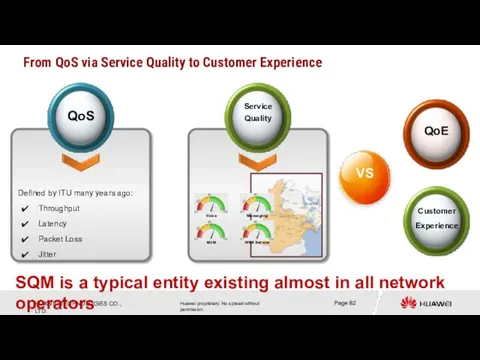
SQM is a typical entity existing almost in all network operators
From
SQM is a typical entity existing almost in all network operators
From
Experience
Service
capability
CEM correlates real Experience and Customer Expectations
From Service Quality to Customer
Experience
Service
capability
CEM correlates real Experience and Customer Expectations
From Service Quality to Customer
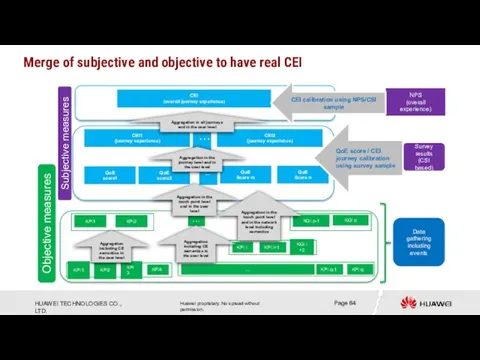
Objective measures
Subjective measures
Aggregation in all journeys
and in the user level
Aggregation in
Objective measures
Subjective measures
Aggregation in all journeys
and in the user level
Aggregation in
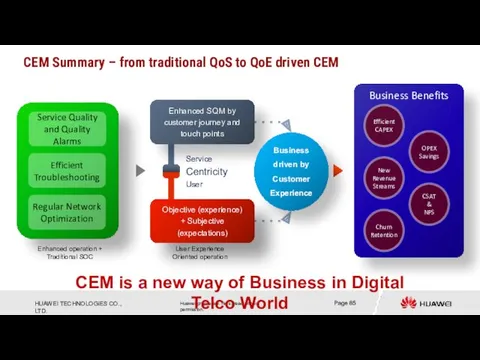
CEM Summary – from traditional QoS to QoE driven CEM
Enhanced SQM
CEM Summary – from traditional QoS to QoE driven CEM
Enhanced SQM

Net Promoter Score
Net Promoter Score
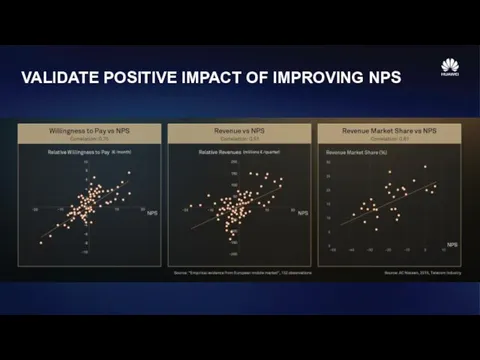
VALIDATE POSITIVE IMPACT OF IMPROVING NPS
VALIDATE POSITIVE IMPACT OF IMPROVING NPS
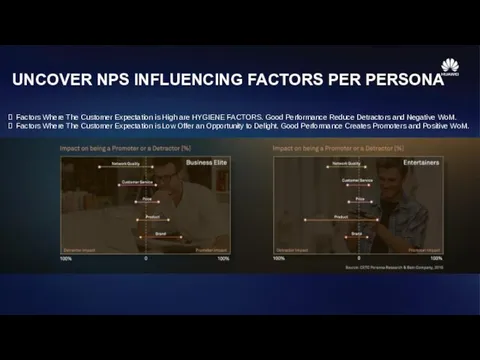
UNCOVER NPS INFLUENCING FACTORS PER PERSONA
Factors Where The Customer Expectation
UNCOVER NPS INFLUENCING FACTORS PER PERSONA
Factors Where The Customer Expectation
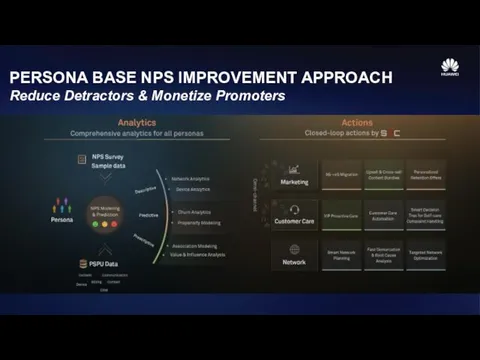
PERSONA BASE NPS IMPROVEMENT APPROACH
Reduce Detractors & Monetize Promoters
PERSONA BASE NPS IMPROVEMENT APPROACH
Reduce Detractors & Monetize Promoters
VALUE DELIVERED IN PRACTICE WORLD
NPS Improved 10pts with $1.2 Additional Earning
VALUE DELIVERED IN PRACTICE WORLD
NPS Improved 10pts with $1.2 Additional Earning
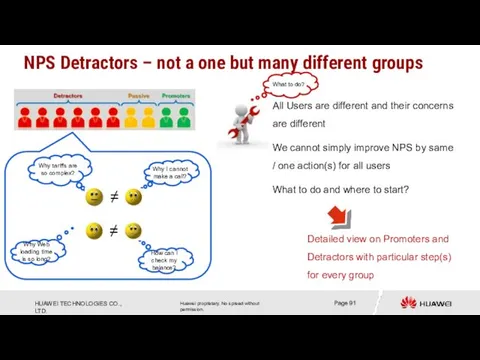
NPS Detractors – not a one but many different groups
All Users
NPS Detractors – not a one but many different groups
All Users
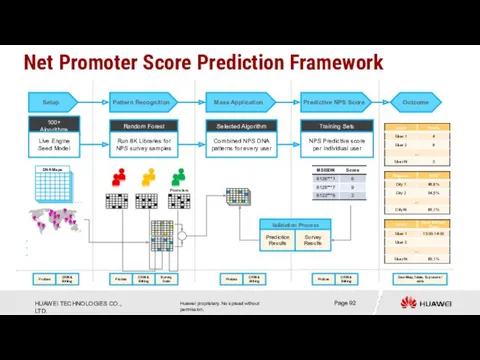
Net Promoter Score Prediction Framework
8000 DNA-pattern maps
Source: 24 countries
Approach: Individual User
Net Promoter Score Prediction Framework
8000 DNA-pattern maps
Source: 24 countries
Approach: Individual User
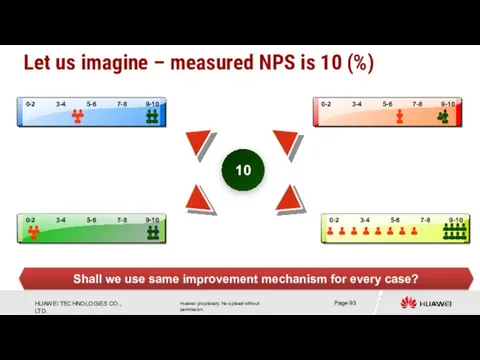
Let us imagine – measured NPS is 10 (%)
10
Shall we use
Let us imagine – measured NPS is 10 (%)
10
Shall we use
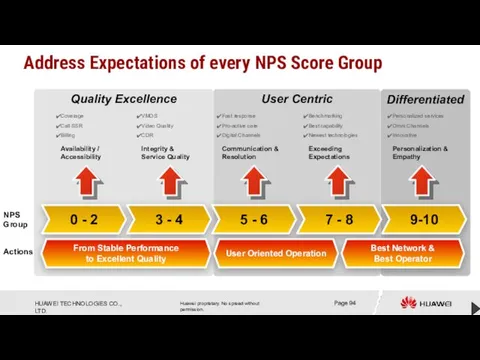
User Centric
Differentiated
Quality Excellence
Address Expectations of every NPS Score Group
Benchmarking
Best capability
Newest technologies
Exceeding
User Centric
Differentiated
Quality Excellence
Address Expectations of every NPS Score Group
Benchmarking
Best capability
Newest technologies
Exceeding

NPS Demo
NPS Demo

Churn Prediction – Details
Churn Prediction – Details
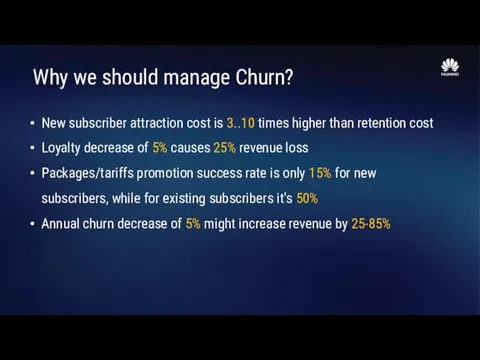
Why we should manage Churn?
New subscriber attraction cost is 3..10 times
Why we should manage Churn?
New subscriber attraction cost is 3..10 times
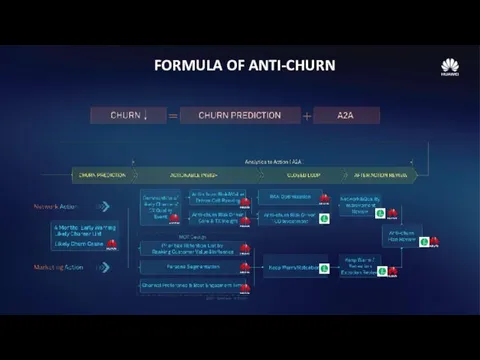
FORMULA OF ANTI-CHURN
FORMULA OF ANTI-CHURN
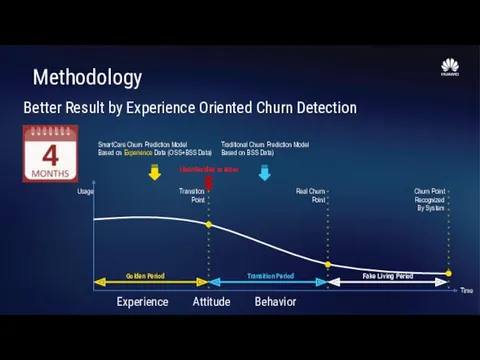
Methodology
Better Result by Experience Oriented Churn Detection
SmartCare Churn Prediction Model
Based on
Methodology
Better Result by Experience Oriented Churn Detection
SmartCare Churn Prediction Model
Based on
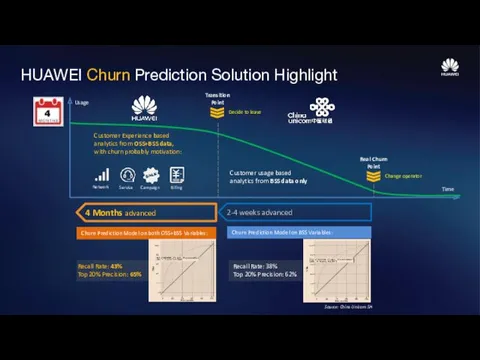
Decide to leave
Transition Point
Real Churn Point
Customer usage based analytics from BSS
Decide to leave
Transition Point
Real Churn Point
Customer usage based analytics from BSS
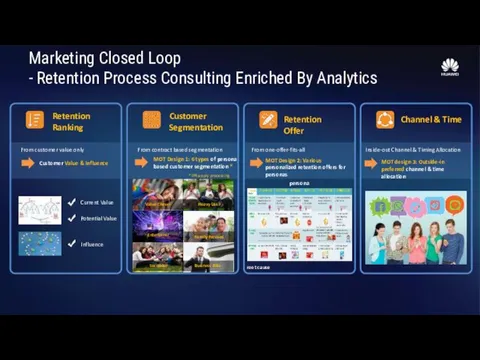
Customer Segmentation
From contract based segmentation
MOT Design 1: 6 types of
Customer Segmentation
From contract based segmentation
MOT Design 1: 6 types of
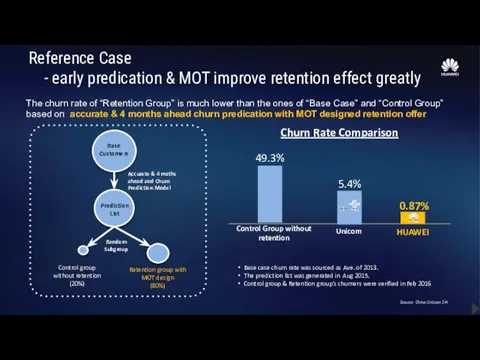
Reference Case
- early predication & MOT improve retention effect greatly
The
Reference Case
- early predication & MOT improve retention effect greatly
The
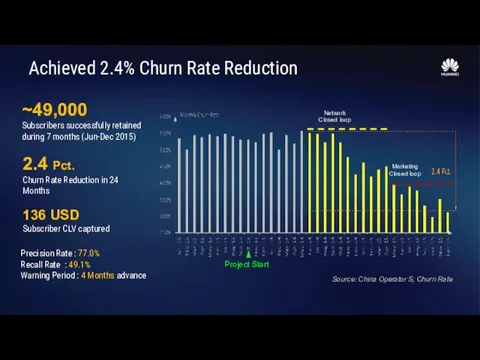
Achieved 2.4% Churn Rate Reduction
~49,000
Subscribers successfully retained
during 7 months (Jun-Dec 2015)
2.4
Achieved 2.4% Churn Rate Reduction
~49,000
Subscribers successfully retained
during 7 months (Jun-Dec 2015)
2.4
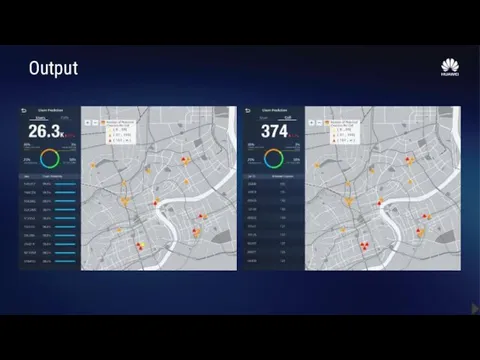
Output
Output
Data Explorer Demo – Churn
Data Explorer Demo – Churn
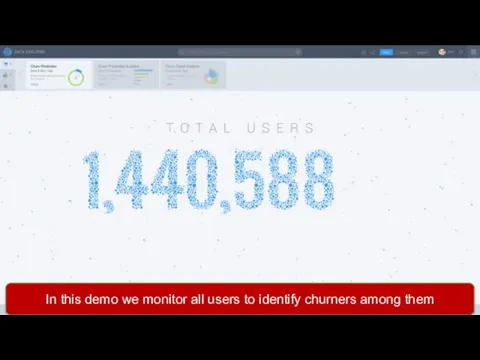
In this demo we monitor all users to identify churners among
In this demo we monitor all users to identify churners among
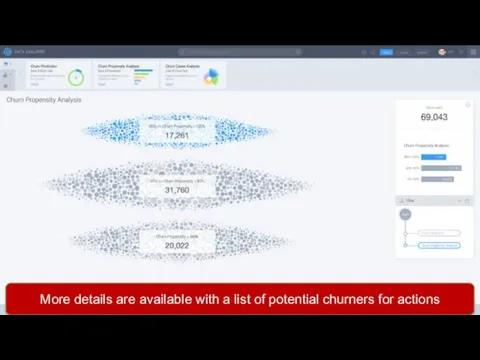
More details are available with a list of potential churners for
More details are available with a list of potential churners for
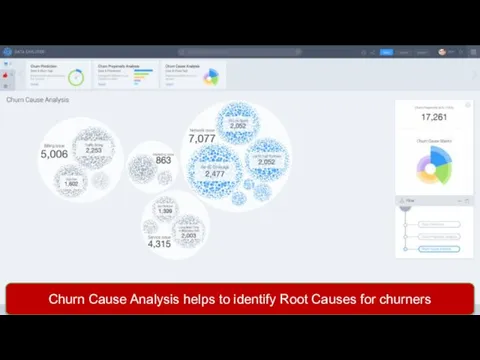
Churn Cause Analysis helps to identify Root Causes for churners
Churn Cause Analysis helps to identify Root Causes for churners
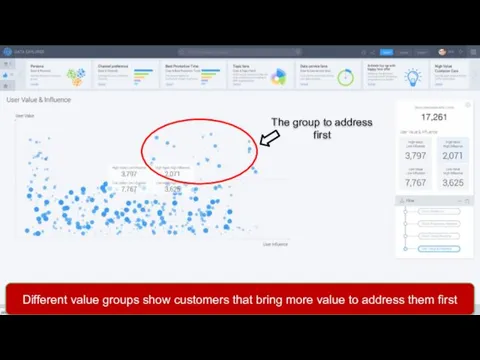
The group to address first
Different value groups show customers that bring
The group to address first
Different value groups show customers that bring
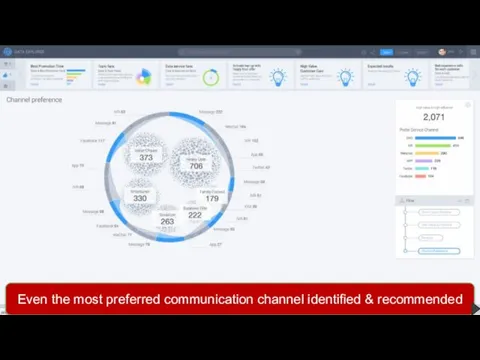
Even the most preferred communication channel identified & recommended
Even the most preferred communication channel identified & recommended

Customer Care Assistance Module
Customer Care Assistance Module
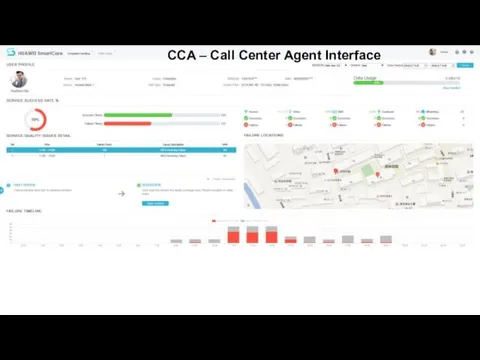
CCA – Call Center Agent Interface
CCA – Call Center Agent Interface
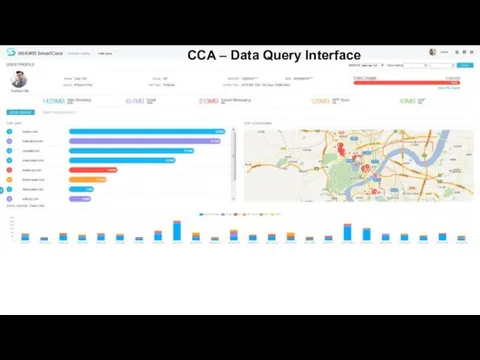
CCA – Data Query Interface
CCA – Data Query Interface

SOC to close the loop in the whole Customer Lifecycle Journey
SOC to close the loop in the whole Customer Lifecycle Journey
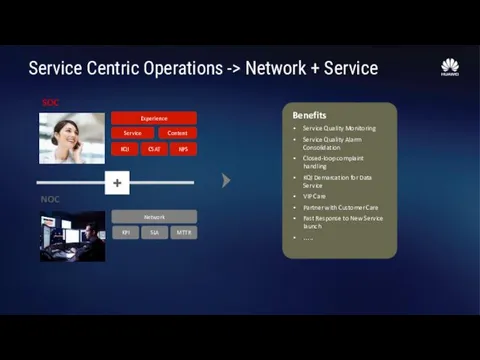
Service Centric Operations -> Network + Service
NOC
SOC
Network
KPI
SLA
MTTR
Experience
KQI
CSAT
NPS
Service
Content
+
Benefits
Service Quality Monitoring
Service
Service Centric Operations -> Network + Service
NOC
SOC
Network
KPI
SLA
MTTR
Experience
KQI
CSAT
NPS
Service
Content
+
Benefits
Service Quality Monitoring
Service
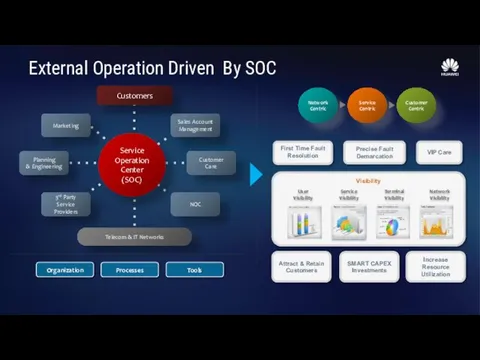
External Operation Driven By SOC
Tools
Processes
Organization
External Operation Driven By SOC
Tools
Processes
Organization
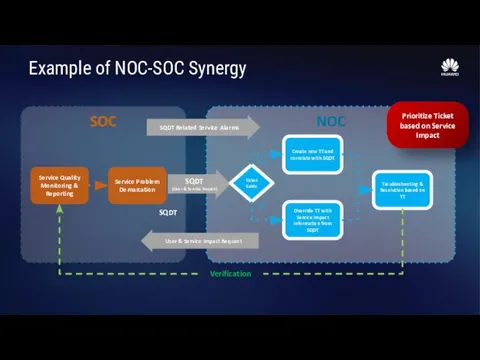
Example of NOC-SOC Synergy
SOC
NOC
Service Quality Monitoring & Reporting
Service Problem Demarcation
Troubleshooting &
Example of NOC-SOC Synergy
SOC
NOC
Service Quality Monitoring & Reporting
Service Problem Demarcation
Troubleshooting &
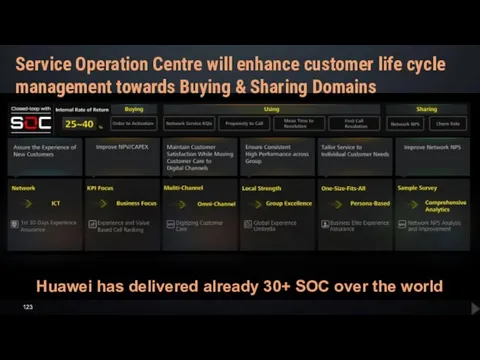
Huawei has delivered already 30+ SOC over the world
Service Operation Centre
Huawei has delivered already 30+ SOC over the world
Service Operation Centre

Separator
Separator
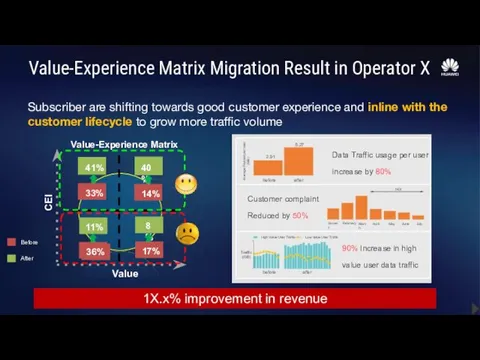
Value-Experience Matrix Migration Result in Operator X
1X.x% improvement in revenue
Subscriber are
Value-Experience Matrix Migration Result in Operator X
1X.x% improvement in revenue
Subscriber are

Separator
Separator
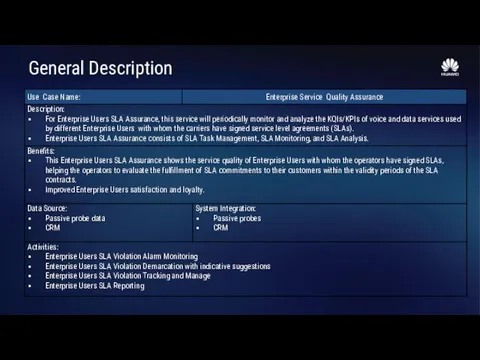
General Description
General Description
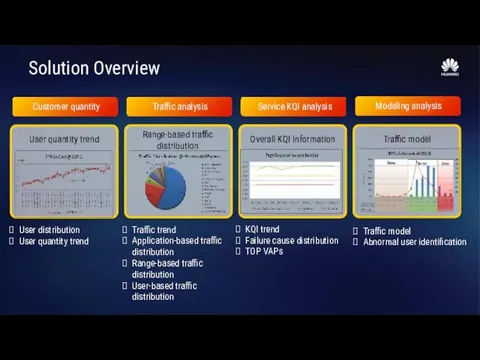
Solution Overview
User distribution
User quantity trend
Traffic trend
Application-based traffic distribution
Range-based traffic distribution
User-based traffic
Solution Overview
User distribution
User quantity trend
Traffic trend
Application-based traffic distribution
Range-based traffic distribution
User-based traffic
Methodology
KPIs and xDR are analyzed and problem scenarios are reproduced to
Methodology
KPIs and xDR are analyzed and problem scenarios are reproduced to
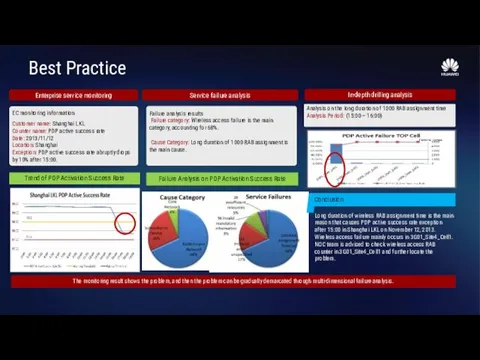
Best Practice
Best Practice

Separator
Separator
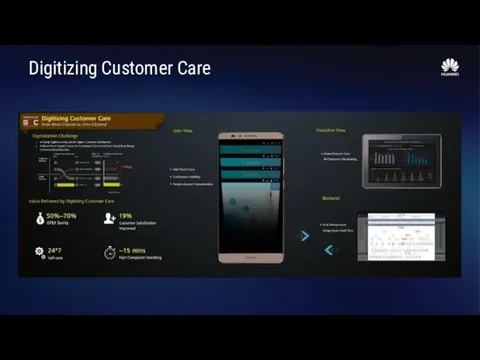
Digitizing Customer Care
Digitizing Customer Care
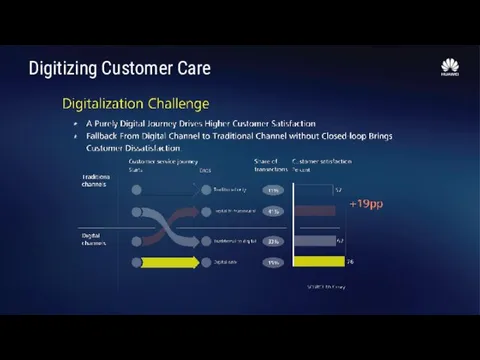
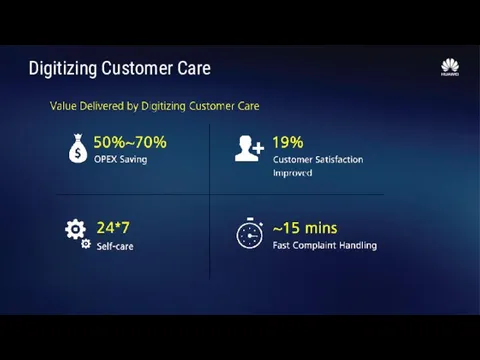
Digitizing Customer Care
Digitizing Customer Care
Digitizing Customer Care
Digitizing Customer Care
Digitizing Customer Care
Digitizing Customer Care

Separator
Separator
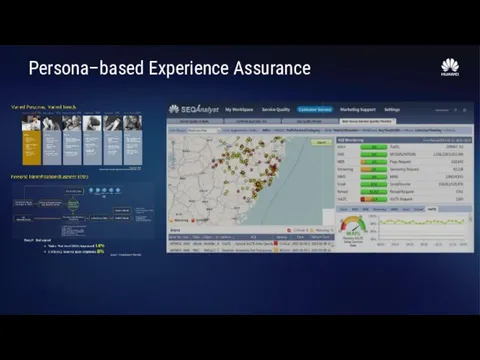
Persona–based Experience Assurance
Persona–based Experience Assurance
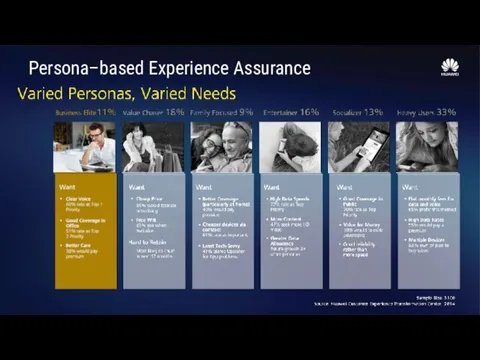
Persona–based Experience Assurance
Persona–based Experience Assurance
Persona–based Experience Assurance
Persona–based Experience Assurance

Separator
Separator
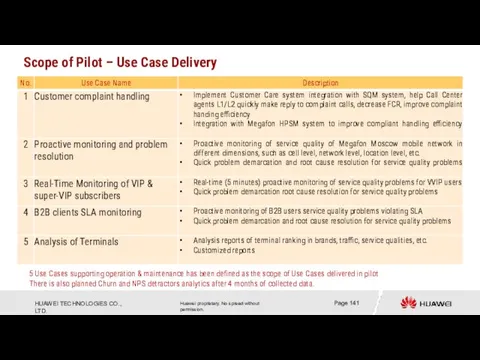
Scope of Pilot – Use Case Delivery
5 Use Cases supporting operation
Scope of Pilot – Use Case Delivery
5 Use Cases supporting operation
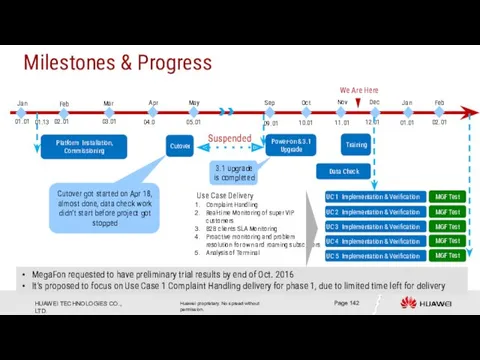
UC 1 Implementation & Verification
Milestones & Progress
Feb
Apr
Mar
Jan
03.01
04.0
02.01
01.01
Platform Installation, Commissioning
Use Case Delivery
Complaint
UC 1 Implementation & Verification
Milestones & Progress
Feb
Apr
Mar
Jan
03.01
04.0
02.01
01.01
Platform Installation, Commissioning
Use Case Delivery
Complaint
1) Оборудование смонтировано, включено и настроено
2) Программное обеспечение установлено
3) Произведены отладочные
1) Оборудование смонтировано, включено и настроено
2) Программное обеспечение установлено
3) Произведены отладочные
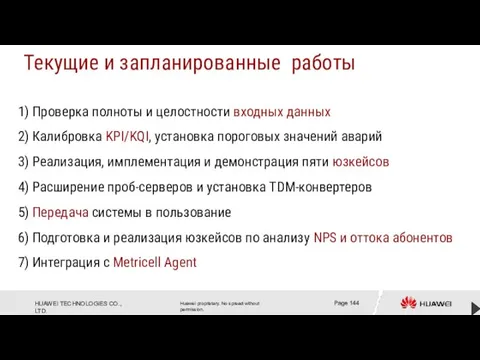
1) Проверка полноты и целостности входных данных
2) Калибровка KPI/KQI, установка пороговых
1) Проверка полноты и целостности входных данных 2) Калибровка KPI/KQI, установка пороговых
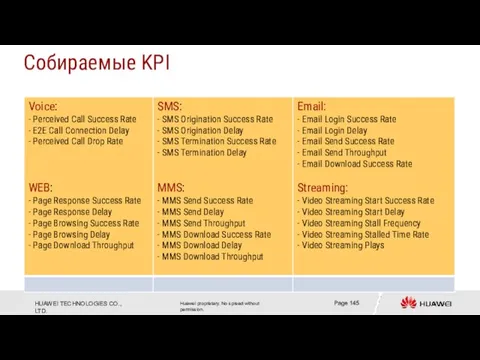
Собираемые KPI
Собираемые KPI
 Организация как социально-экономическая система
 Практики управління знаннями при наданні публічних послуг
 Management Tools
 Управленческие решения
 Бизнес-план проекта. Часть 3. План менеджмента
 Документационное обеспечение управления. Документооборот в управлении
 Автоматизация рабочего места специалиста по кадрам
 Современные тенденции управления в сфере гостеприимства
 Системы управления качеством. Лекция 3
 Современные тенденции в развитии GR-менеджмента и осуществление лоббистской деятельности в России и за рубежом
 Мотивация сотрудников
 Информационные разработки на службе ЖКХ: эффективное управление предприятиями ЖКХ разных форм собственности
 Производственные потери. Система 5S.Все наинается с малого...
 Организационная культура
 Совершенствование процессов снабжения предприятия быстрого питания кафе Ori Puri
 Классификация моделей систем управления качеством. Цели их использования, преимущества и ограничения
 Доклад И.В. Кузнецова Результаты мониторинга совершения таможенных операций на таможенных постах
 Системный подход к бизнесу в международном клубе Авто
 Презентация БП для СТБ (студенты)
 Логистика для интернет-магазина. Подводные камни и успешные модели
 Fast food restaurant
 Мировые управленческие концепции
 КБ Ренессанс кредит. ООО Поиск клининговой компании для офиса в г. Москва
 Кадровый консалтинг и аудит персонала
 ВКР: Разработка подсистемы учета движения комплектующих материалов и сырья
 Влияние изменении таможенного законодательства на логистическую цепь поставки товаров
 Как оптимизировать управление финансами на предприятии
 Системный анализ. Анализ проблемы