- Economics exam

Содержание
- 2. Today’s Outline We’ll review the exam from Friday
- 3. Which of the following reasons can explain why people have preferences for holding money? It yields
- 4. A rise in the central bank refinance rate will: Increase the money supply. Reduce the money
- 5. In the IS-LM model, a decrease in net exports (NX) will: Shift the IS curve to
- 6. Suppose the demand for money is given by: MD=100-8r, where r denotes the interest rate. The
- 7. In the IS-LM model: a simultaneous increase in government spending and lower money supply will: Lower
- 8. The “Crowding Out” effect following a rise in government expenditures (for example) is associated with: A
- 9. Crowding-out effect the tendency of an increase in government expenditure to increase the rate of interest,
- 10. In a liquidity trap: Monetary policy is effective in stabilizing the economy. Fiscal Policy is effective
- 11. Note from Roy on Q7: Recall that the LM curve in the liquidity trap is completely
- 12. The IS curve depicts: A positive relationship between output and prices A negative relationship between output
- 13. Week 19: The IS Curve IS Curve Recap IS curve plots combinations of the rate of
- 14. If the demand for money becomes less responsive to changes in the rate of interest then:
- 15. From Week 20: The strength of the crowding-out effect depends on: The responsiveness of consumption and
- 16. Assume consumption expenditures=2500, investment=2500, government purchases=1000, net exports=0. What is the gross domestic product (Y) and
- 17. For an economy with a consumption function of: C=0.75 (Y-T), where Y denotes output and T
- 18. For an economy characterized by: C=1800+0.6(Y-T), I=900, G=1500, NX=100, T=1500 and Y*=9000, what is the output
- 19. A central bank can _____________ in order to prevent an increase in the equilibrium interest rate.
- 20. A fall in the interest rate, increases liquidity preference, as it encourages investment expenditure reduces liquidity
- 21. A rise in real income, increases liquidity preference, as it reduces saving decreases liquidity preference, as
- 22. A Keynesian ‘fixed price’ macroeconomic model assumes: inflation is ‘always a monetary phenomenon’ monetary expansion raises
- 23. Sir John Hicks Alvin Hansen (1904-1989) (1887-1975) e.g., money financed fiscal expansion … full employment without
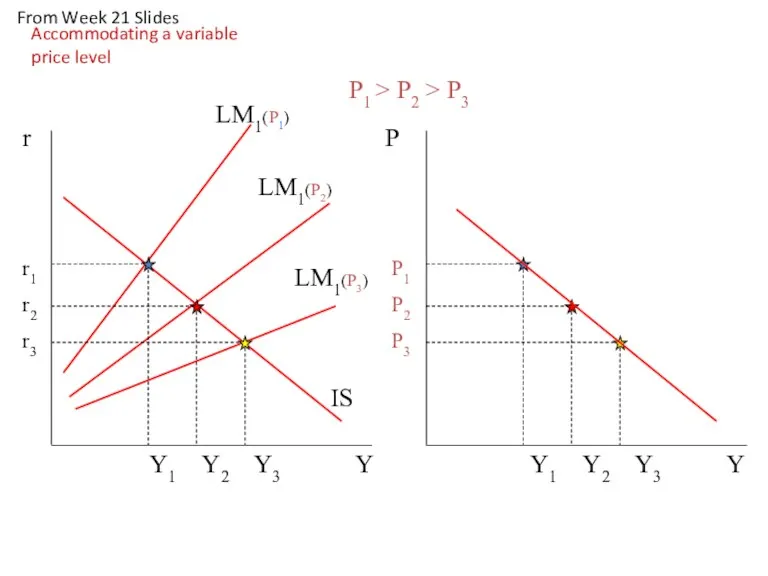
- 24. To derive aggregate demand from ISLM, it is necessary to relax the assumption of money illusion
- 25. Y r LM1(P1) LM2(P1) Y P1 Y1 Y2 Y1 Y2 r1 r2 IS P M1 liquidity
- 26. Y r LM1(P2) Y P1 P2 Y1 Y2 Y1 Y2 r1 r2 IS P LM1(P1) P1
- 27. Y r LM1(P2) LM1(P3) Y P1 > P2 > P3 P1 P2 P3 Y1 Y2 Y3
- 28. The aggregate supply curve is drawn under the assumption that prices are constant employment is constant
- 29. The exogenous force that drives the original Phillips curve is the business cycle monetary policy trade
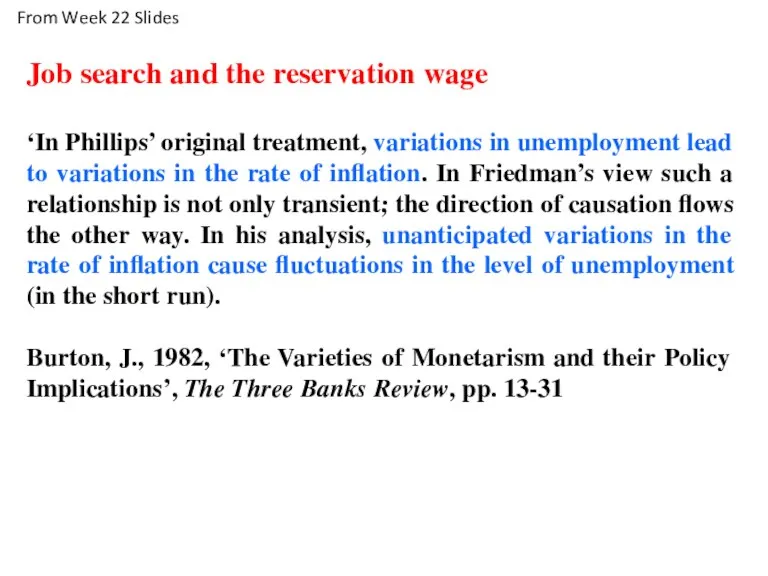
- 30. Job search and the reservation wage ‘In Phillips’ original treatment, variations in unemployment lead to variations
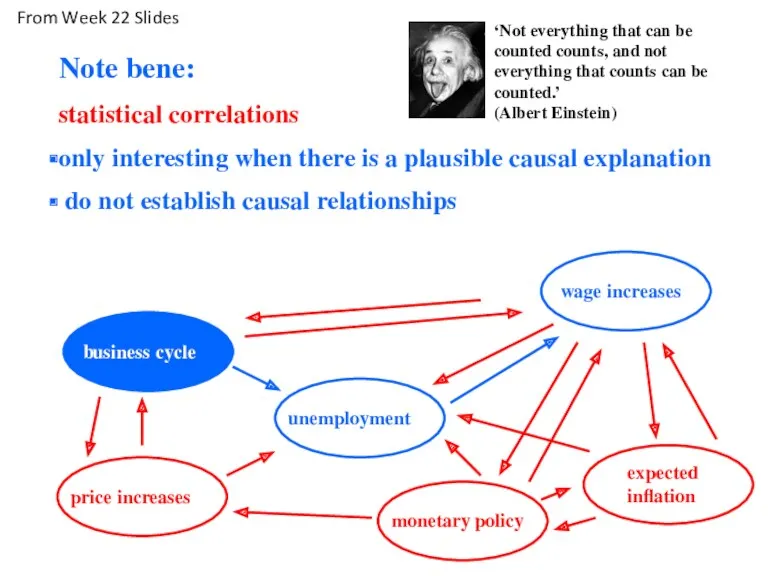
- 31. Note bene: statistical correlations only interesting when there is a plausible causal explanation do not establish
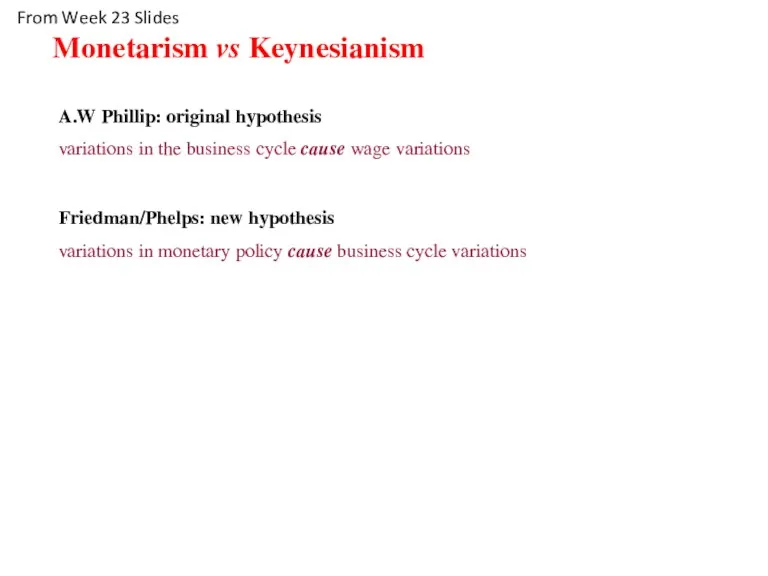
- 32. A.W Phillip: original hypothesis variations in the business cycle cause wage variations Friedman/Phelps: new hypothesis variations
- 33. The exogenous force that drives the price-expectations augmented Phillips curve is the business cycle monetary policy
- 34. Job search and the reservation wage ‘In Phillips’ original treatment, variations in unemployment lead to variations
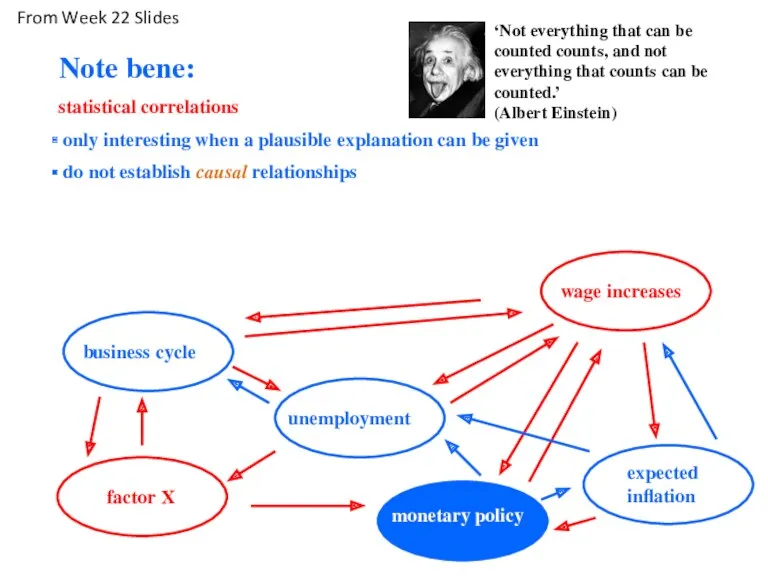
- 35. Note bene: statistical correlations only interesting when a plausible explanation can be given do not establish
- 36. A.W Phillip: original hypothesis variations in the business cycle cause wage variations Friedman/Phelps: new hypothesis variations
- 37. Keynesian cost-push inflation occurs when trade unions go on strike when money supply exceeds money demand
- 38. Keynes, J.M. (1936) ‘an increase in the quantity of money will have no effect whatever on
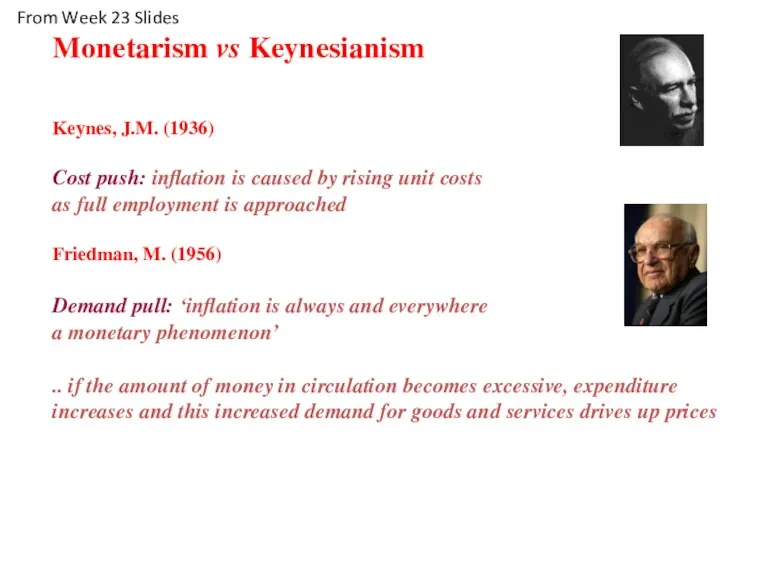
- 39. Monetarism vs Keynesianism Keynes, J.M. (1936) Cost push: inflation is caused by rising unit costs as
- 40. Classical demand-pull inflation occurs when trade unions go on strike when money supply exceeds money demand
- 41. Monetarism vs Keynesianism Keynes, J.M. (1936) Cost push: inflation is caused by rising unit costs as
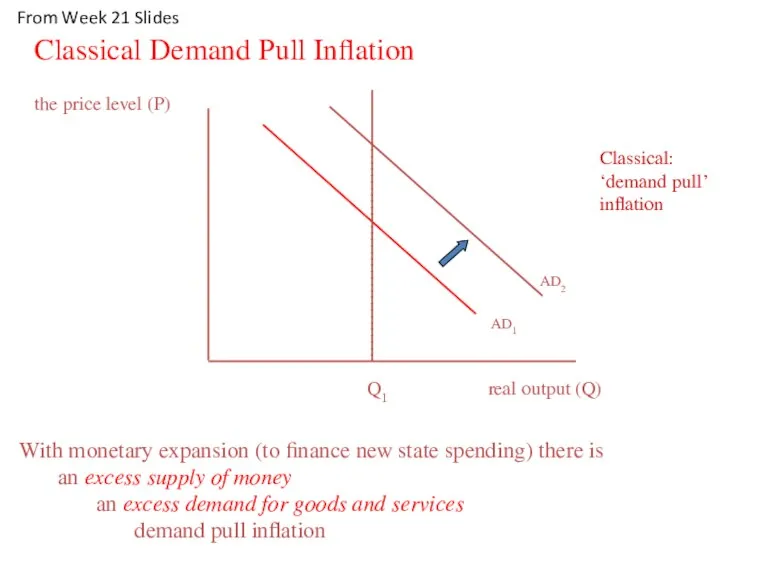
- 42. AD1 Classical Demand Pull Inflation AD2 real output (Q) Q1 Classical: ‘demand pull’ inflation the price
- 43. Monetarism argues for a stable relationship between real balances and the transactions demand for money inflation
- 44. Within the UK account of international payments, the ‘balance for official financing’ shows the level of
- 45. The general structure: BoP ≡ X - M + IOU (loan/credit) ≡ 0 BoP ≡ current
- 46. With increased saving and a fall in the rate of interest, there is relatively greater incentive
- 48. Скачать презентацию

Today’s Outline
We’ll review the exam from Friday
Today’s Outline
We’ll review the exam from Friday
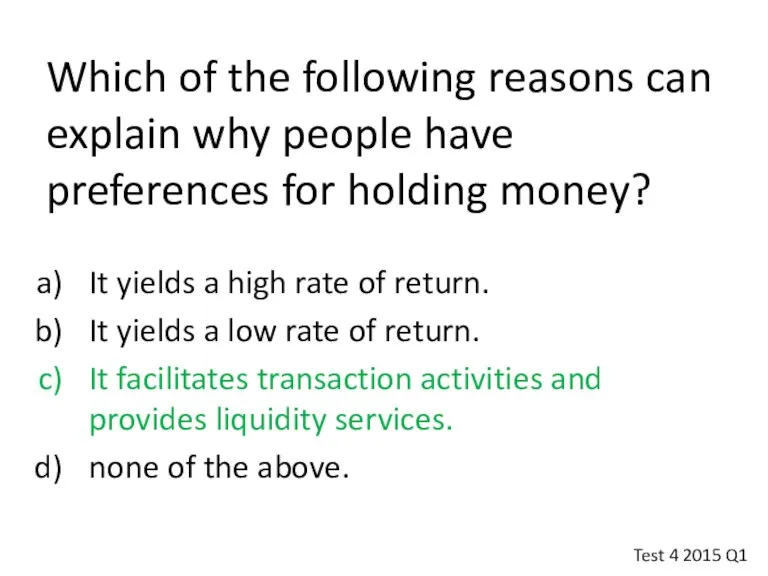
Which of the following reasons can explain why people have preferences
Which of the following reasons can explain why people have preferences
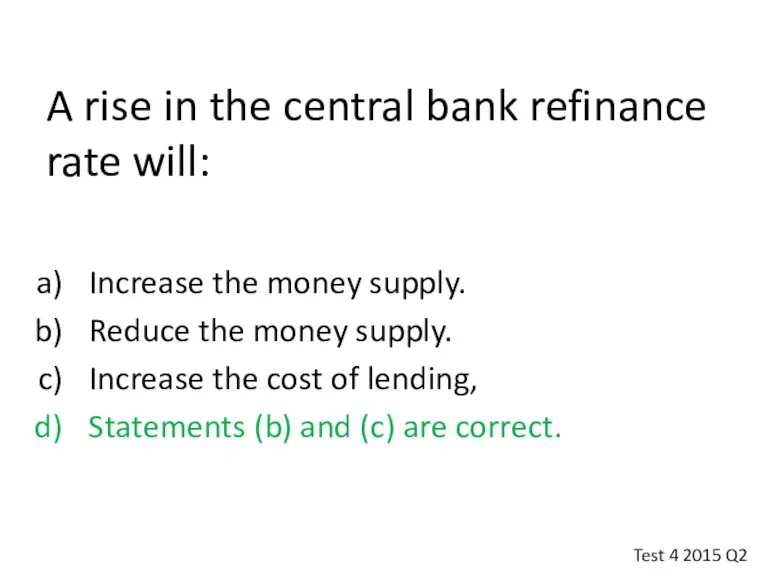
A rise in the central bank refinance rate will:
Increase the money
A rise in the central bank refinance rate will:
Increase the money
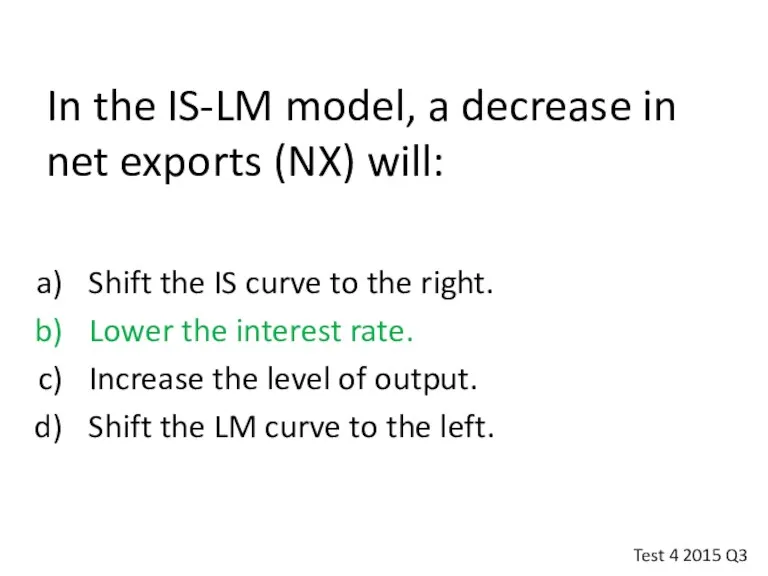
In the IS-LM model, a decrease in net exports (NX) will:
In the IS-LM model, a decrease in net exports (NX) will:
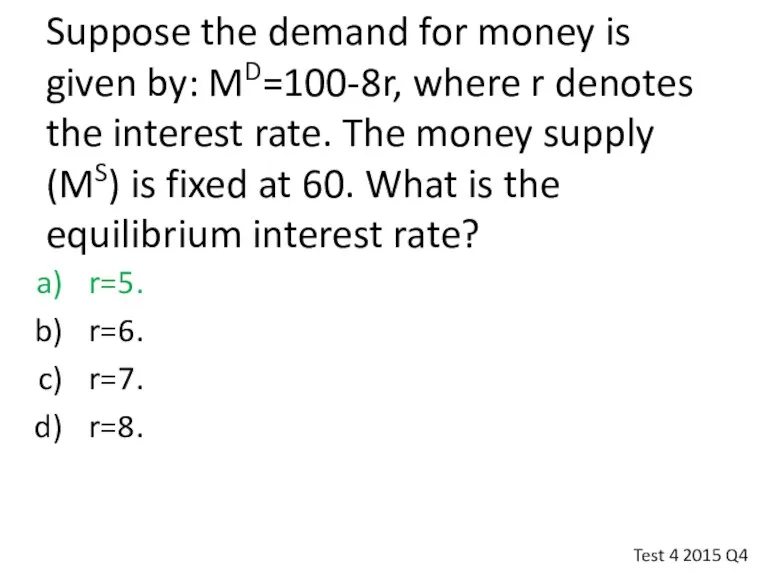
Suppose the demand for money is given by: MD=100-8r, where r
Suppose the demand for money is given by: MD=100-8r, where r
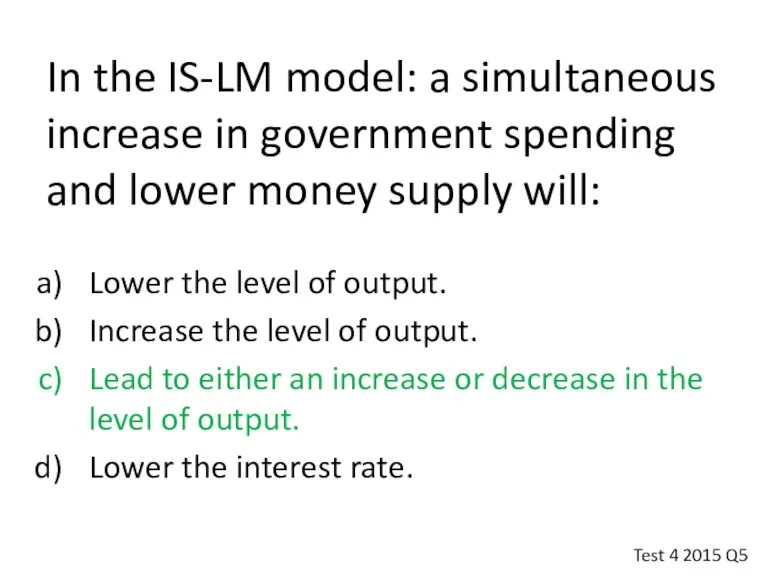
In the IS-LM model: a simultaneous increase in government spending and
In the IS-LM model: a simultaneous increase in government spending and
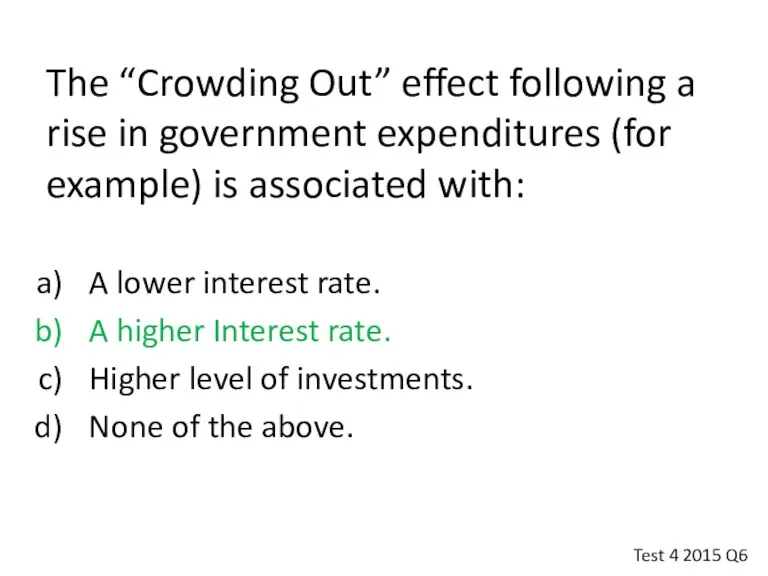
The “Crowding Out” effect following a rise in government expenditures (for
The “Crowding Out” effect following a rise in government expenditures (for
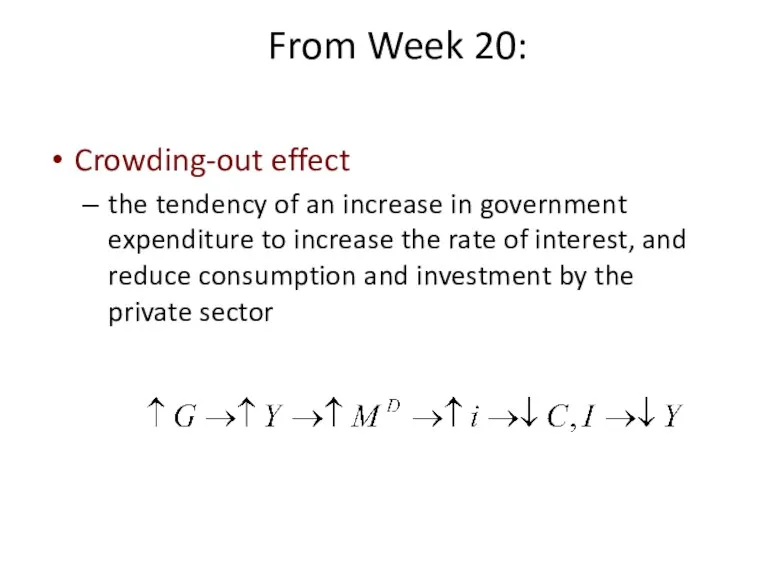
Crowding-out effect
the tendency of an increase in government expenditure to increase
Crowding-out effect
the tendency of an increase in government expenditure to increase
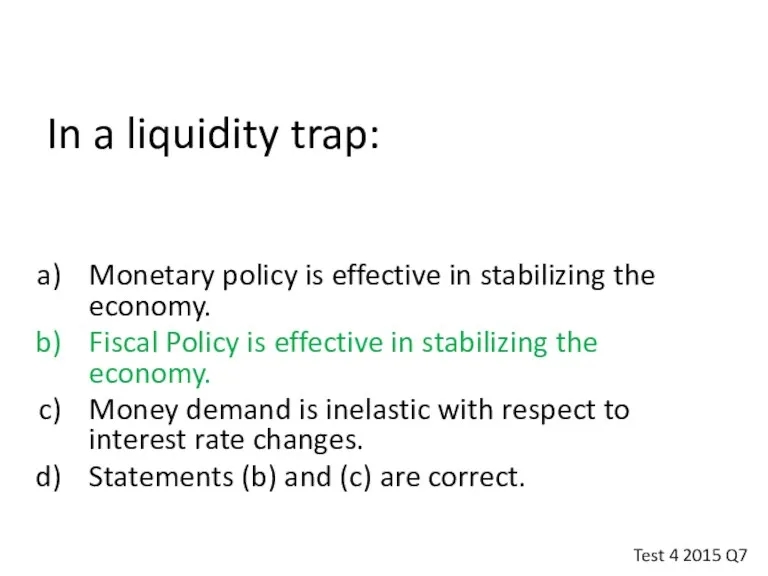
In a liquidity trap:
Monetary policy is effective in stabilizing the economy.
Fiscal
In a liquidity trap:
Monetary policy is effective in stabilizing the economy.
Fiscal
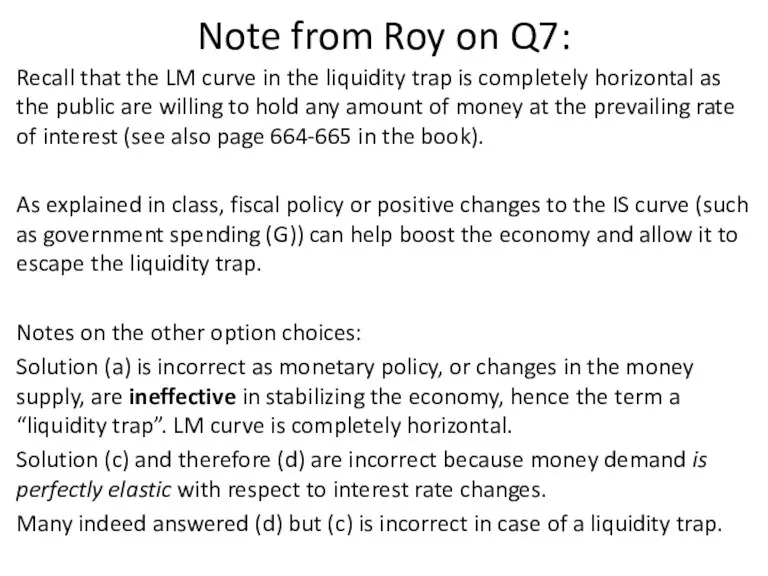
Note from Roy on Q7:
Recall that the LM curve in the
Note from Roy on Q7:
Recall that the LM curve in the
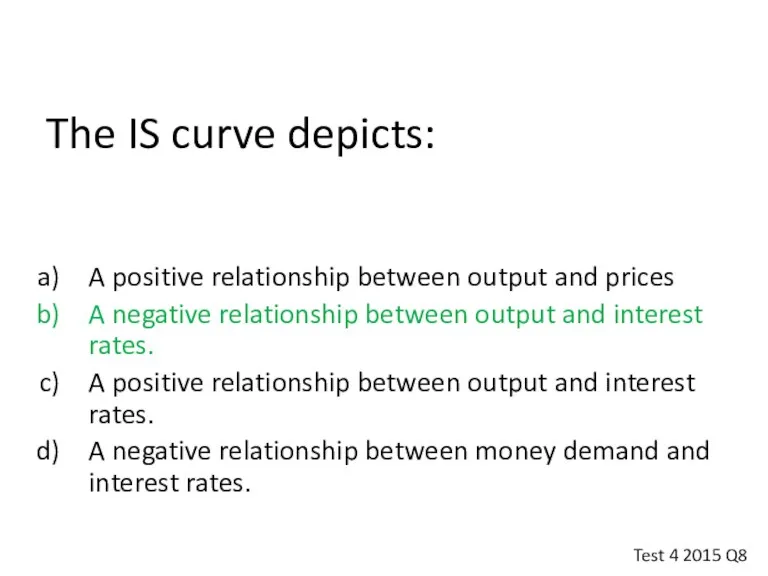
The IS curve depicts:
A positive relationship between output and prices
A negative
The IS curve depicts:
A positive relationship between output and prices
A negative
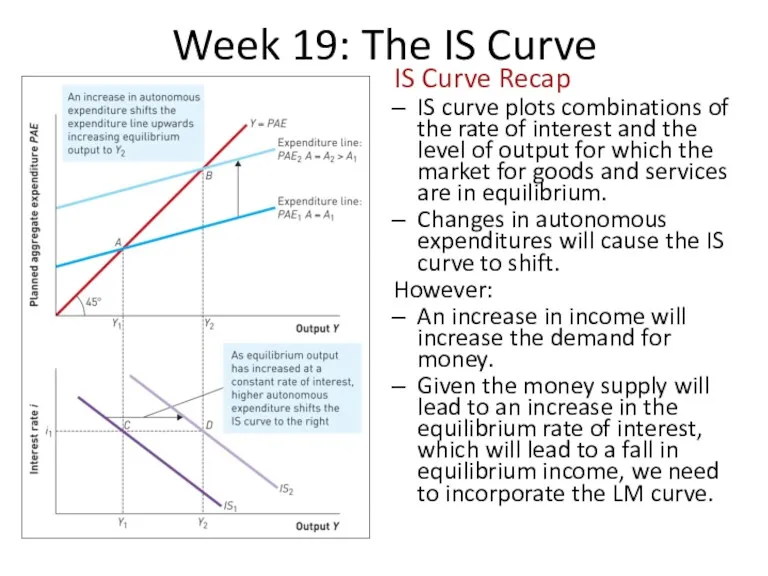
Week 19: The IS Curve
IS Curve Recap
IS curve plots combinations of
Week 19: The IS Curve
IS Curve Recap
IS curve plots combinations of
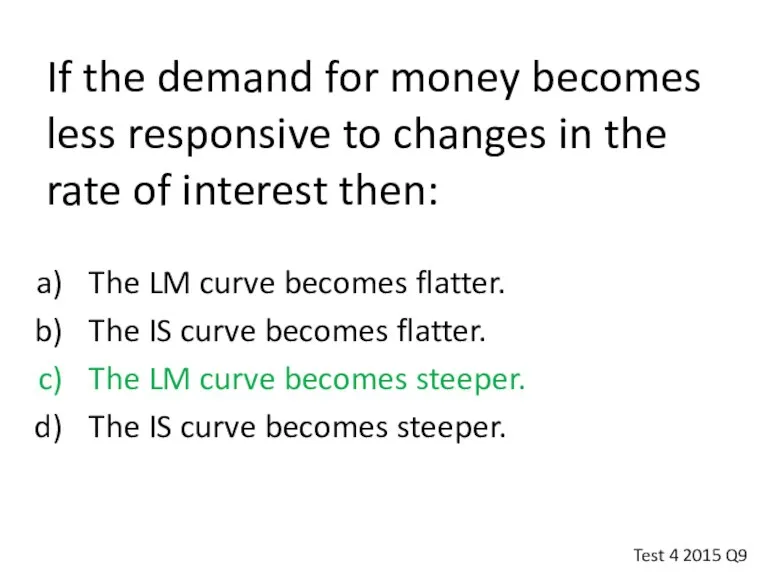
If the demand for money becomes less responsive to changes in
If the demand for money becomes less responsive to changes in
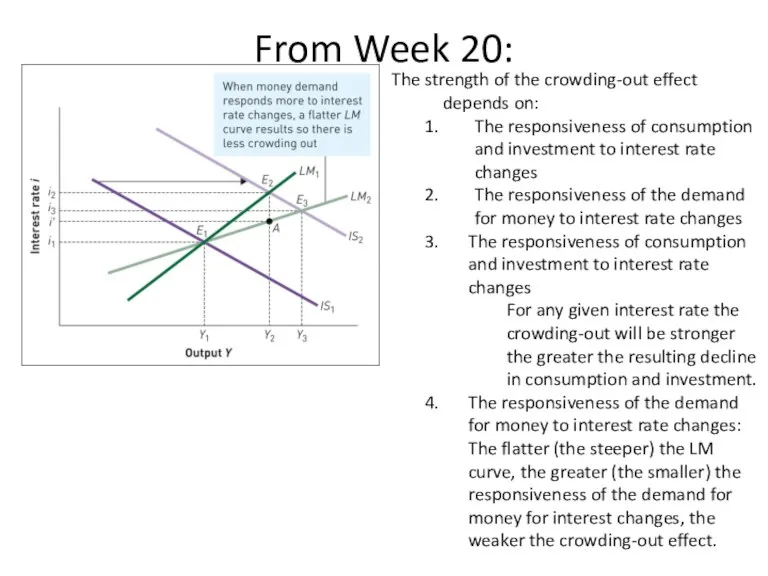
From Week 20:
The strength of the crowding-out effect depends on:
The responsiveness
From Week 20:
The strength of the crowding-out effect depends on:
The responsiveness
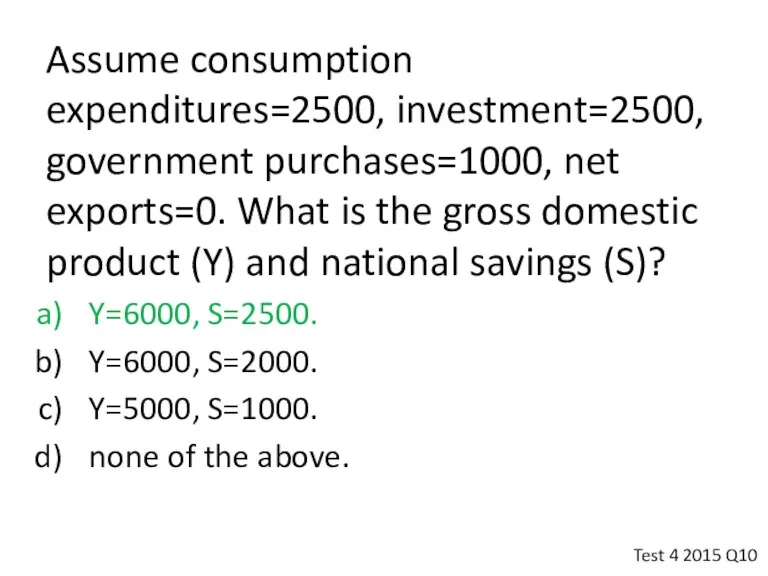
Assume consumption expenditures=2500, investment=2500, government purchases=1000, net exports=0. What is the
Assume consumption expenditures=2500, investment=2500, government purchases=1000, net exports=0. What is the
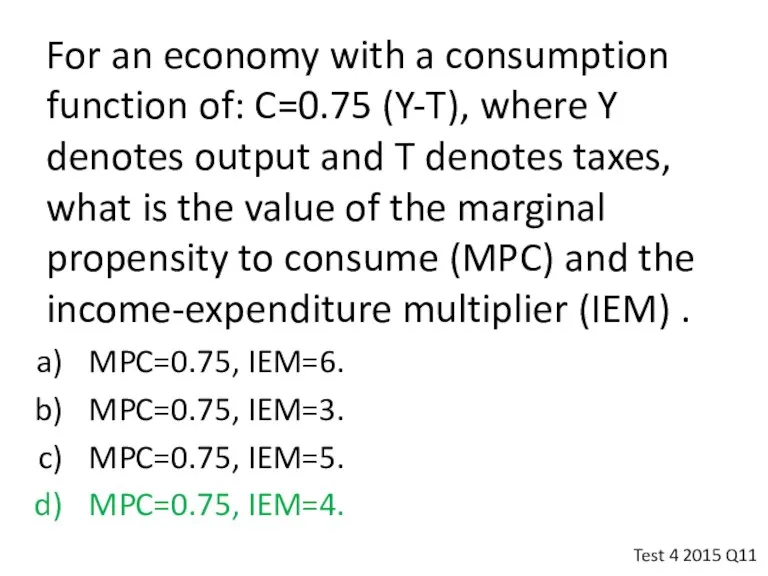
For an economy with a consumption function of: C=0.75 (Y-T), where
For an economy with a consumption function of: C=0.75 (Y-T), where
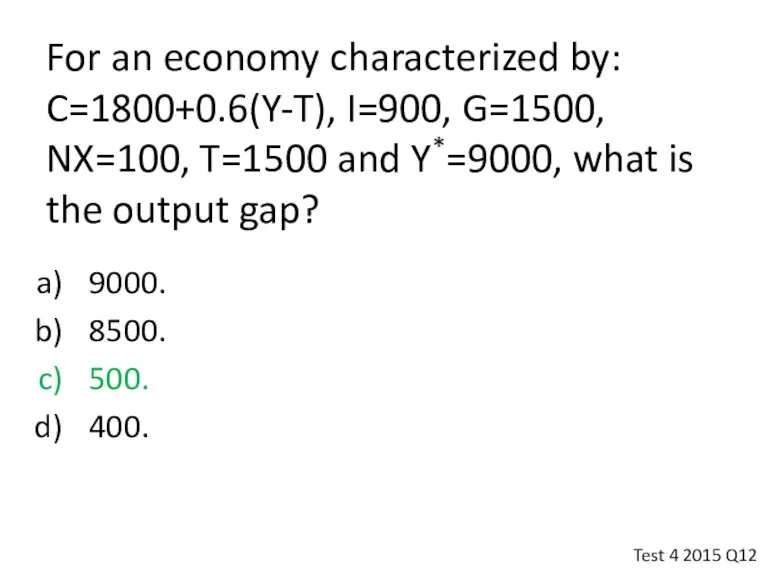
For an economy characterized by: C=1800+0.6(Y-T), I=900, G=1500, NX=100, T=1500 and
For an economy characterized by: C=1800+0.6(Y-T), I=900, G=1500, NX=100, T=1500 and
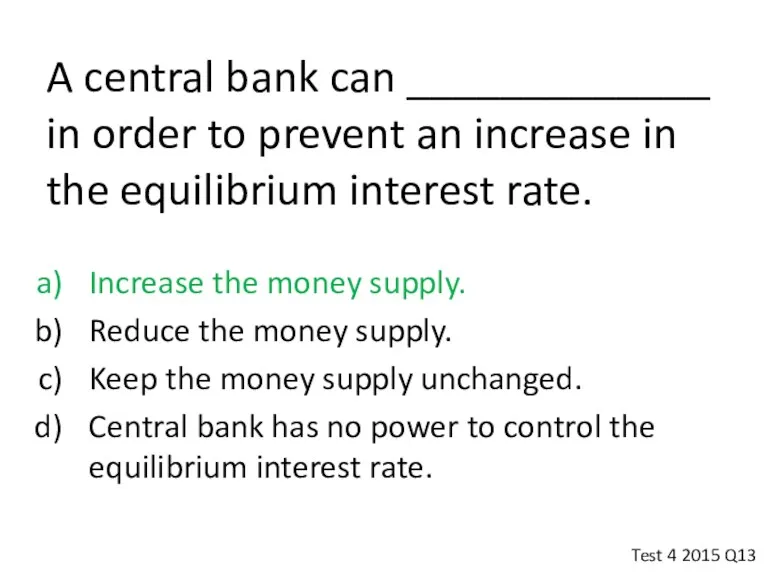
A central bank can _____________ in order to prevent an increase
A central bank can _____________ in order to prevent an increase
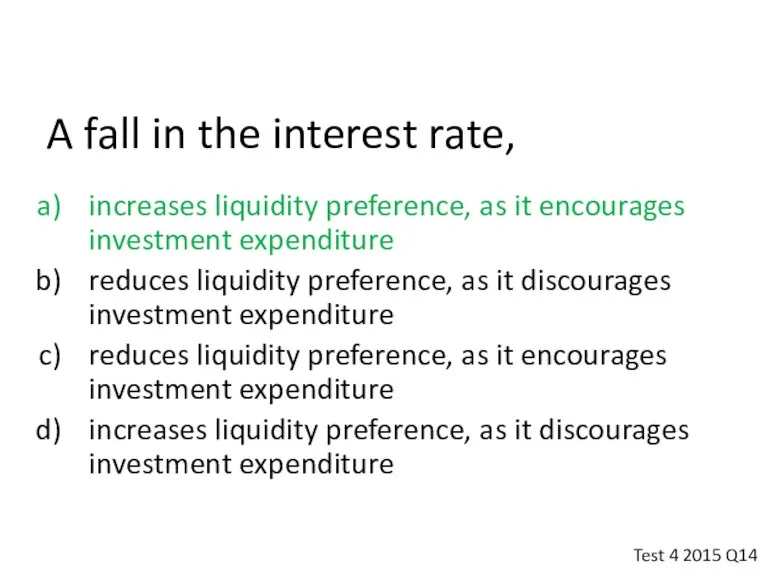
A fall in the interest rate,
increases liquidity preference, as it
A fall in the interest rate,
increases liquidity preference, as it
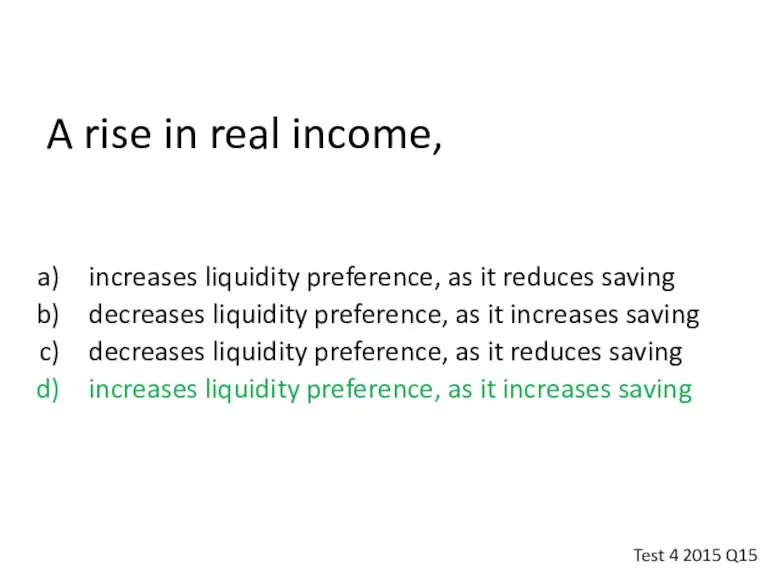
A rise in real income,
increases liquidity preference, as it reduces
A rise in real income,
increases liquidity preference, as it reduces
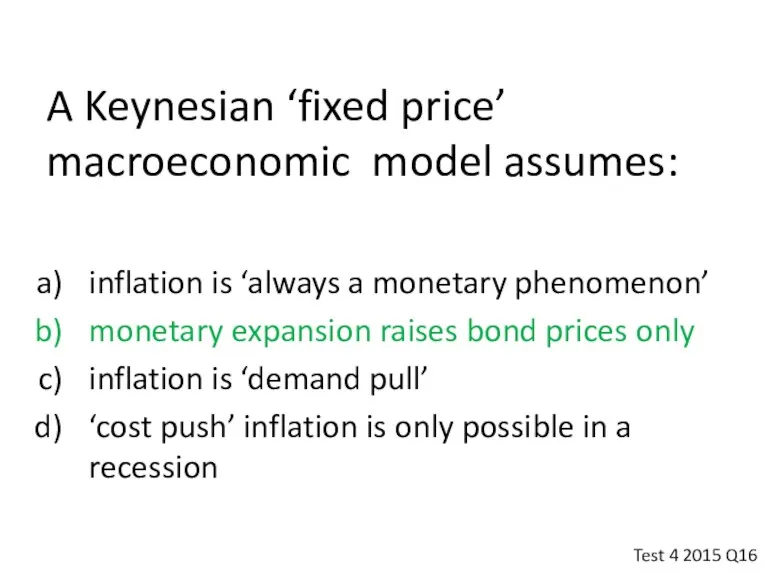
A Keynesian ‘fixed price’ macroeconomic model assumes:
inflation is ‘always a
A Keynesian ‘fixed price’ macroeconomic model assumes:
inflation is ‘always a
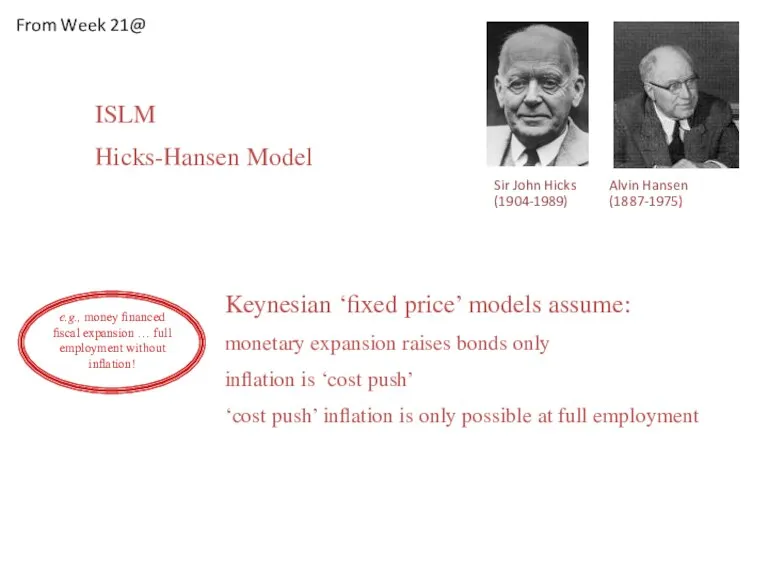
Sir John Hicks Alvin Hansen
(1904-1989) (1887-1975)
e.g., money financed
fiscal expansion
Sir John Hicks Alvin Hansen
(1904-1989) (1887-1975)
e.g., money financed
fiscal expansion
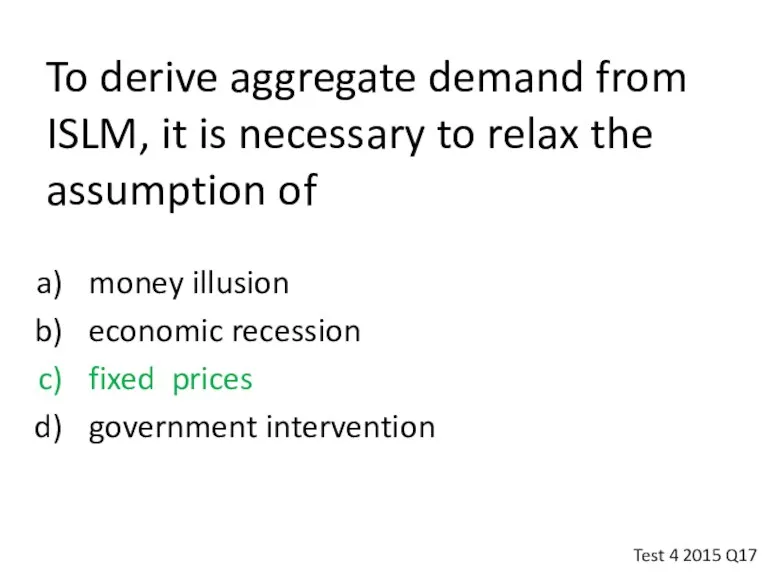
To derive aggregate demand from ISLM, it is necessary to relax
To derive aggregate demand from ISLM, it is necessary to relax
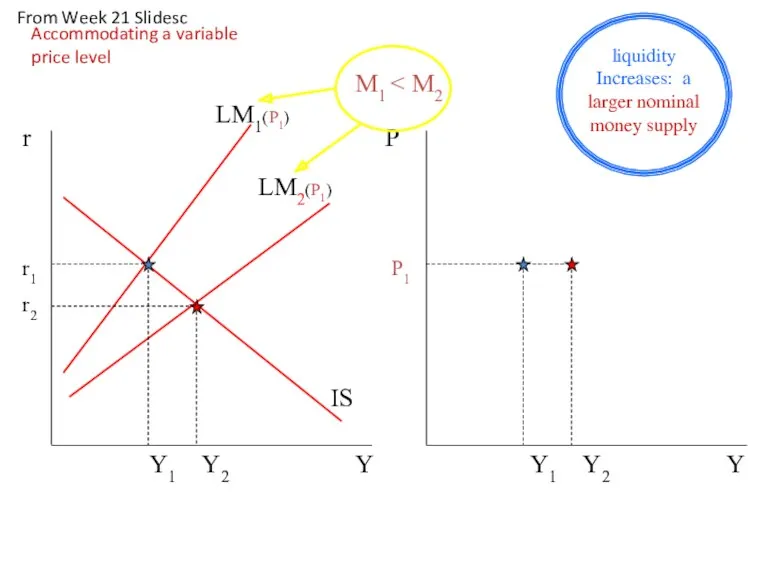
Y
r
LM1(P1)
LM2(P1)
Y
P1
Y1 Y2
Y1 Y2
r1
r2
IS
P
M1 < M2
liquidity
Increases: a
Y
r
LM1(P1)
LM2(P1)
Y
P1
Y1 Y2
Y1 Y2
r1
r2
IS
P
M1 < M2
liquidity
Increases: a
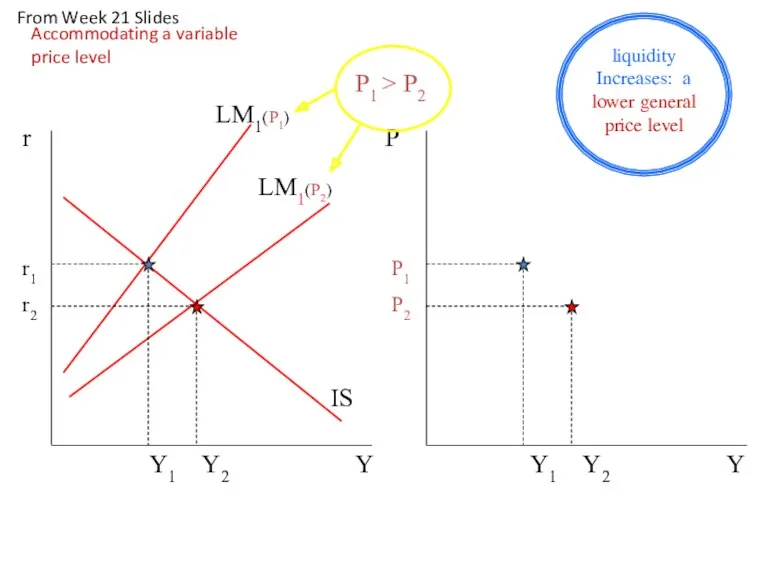
Y
r
LM1(P2)
Y
P1
P2
Y1 Y2
Y1 Y2
r1
r2
IS
P
LM1(P1)
P1 > P2
liquidity
Increases:
Y
r
LM1(P2)
Y
P1
P2
Y1 Y2
Y1 Y2
r1
r2
IS
P
LM1(P1)
P1 > P2
liquidity
Increases:
Y
r
LM1(P2)
LM1(P3)
Y
P1 > P2 > P3
P1
P2
P3
Y1 Y2 Y3
Y1 Y2 Y3
r1
Y
r
LM1(P2)
LM1(P3)
Y
P1 > P2 > P3
P1
P2
P3
Y1 Y2 Y3
Y1 Y2 Y3
r1
The aggregate supply curve is drawn under the assumption that
prices
The aggregate supply curve is drawn under the assumption that
prices
The exogenous force that drives the original Phillips curve is
the business
The exogenous force that drives the original Phillips curve is
the business
Job search and the reservation wage
‘In Phillips’ original treatment, variations
Job search and the reservation wage
‘In Phillips’ original treatment, variations
Note bene:
statistical correlations
only interesting when there is a plausible
Note bene:
statistical correlations
only interesting when there is a plausible

A.W Phillip: original hypothesis
variations in the business cycle cause wage
A.W Phillip: original hypothesis
variations in the business cycle cause wage
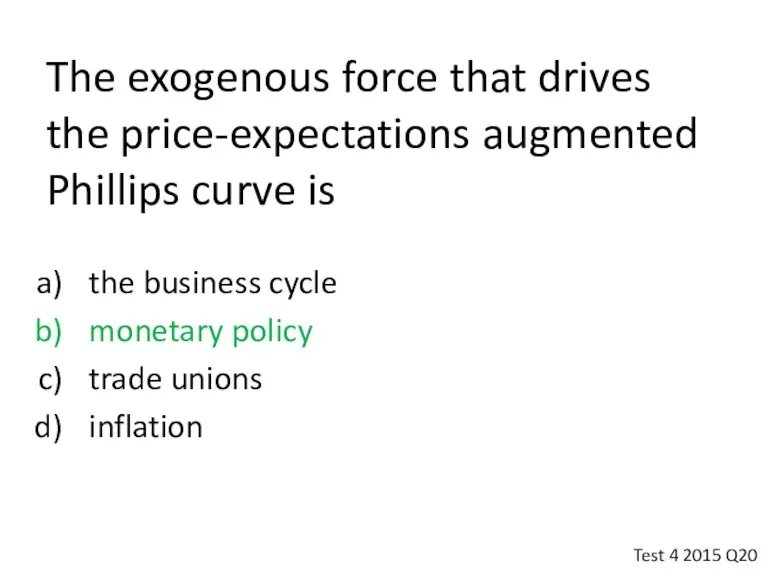
The exogenous force that drives the price-expectations augmented Phillips curve is
the
The exogenous force that drives the price-expectations augmented Phillips curve is
the

Job search and the reservation wage
‘In Phillips’ original treatment, variations
Job search and the reservation wage
‘In Phillips’ original treatment, variations
Note bene:
statistical correlations
only interesting when a plausible explanation
Note bene:
statistical correlations
only interesting when a plausible explanation
A.W Phillip: original hypothesis
variations in the business cycle cause wage
A.W Phillip: original hypothesis
variations in the business cycle cause wage
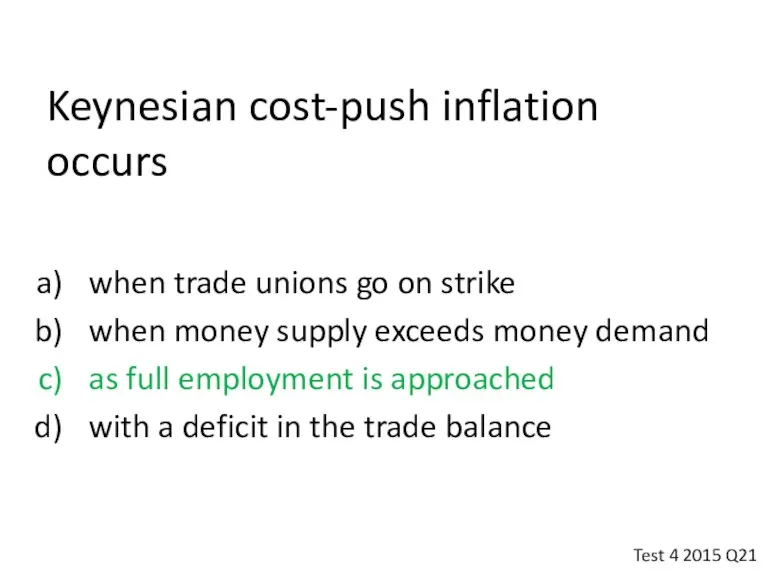
Keynesian cost-push inflation occurs
when trade unions go on strike
when money supply
Keynesian cost-push inflation occurs
when trade unions go on strike
when money supply
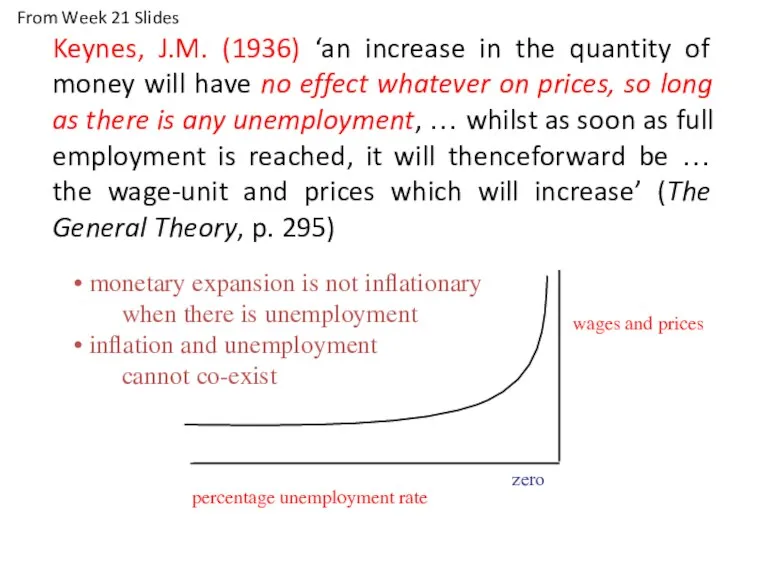
Keynes, J.M. (1936) ‘an increase in the quantity of money
Keynes, J.M. (1936) ‘an increase in the quantity of money

Monetarism vs Keynesianism
Keynes, J.M. (1936)
Cost push: inflation is caused by
Monetarism vs Keynesianism
Keynes, J.M. (1936)
Cost push: inflation is caused by
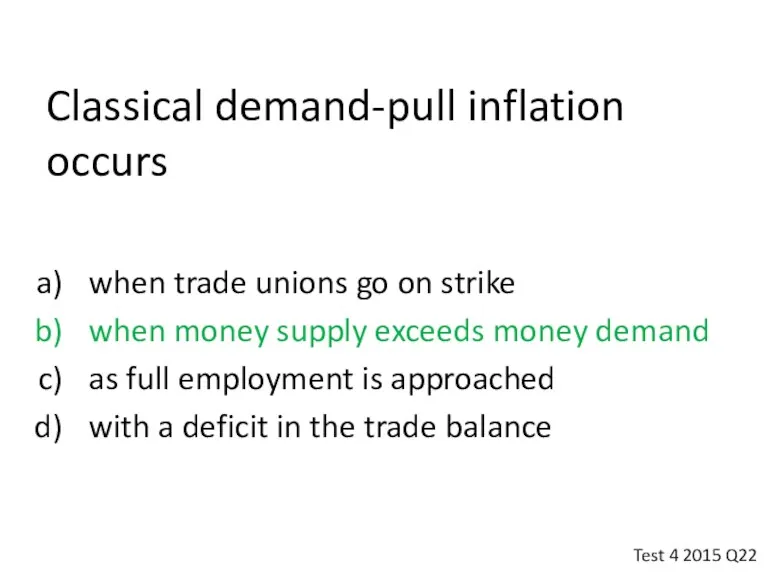
Classical demand-pull inflation occurs
when trade unions go on strike
when money supply
Classical demand-pull inflation occurs
when trade unions go on strike
when money supply
Monetarism vs Keynesianism
Keynes, J.M. (1936)
Cost push: inflation is caused by
Monetarism vs Keynesianism
Keynes, J.M. (1936)
Cost push: inflation is caused by
AD1
Classical Demand Pull Inflation
AD2
real output (Q)
Q1
Classical:
‘demand
AD1
Classical Demand Pull Inflation
AD2
real output (Q)
Q1
Classical:
‘demand
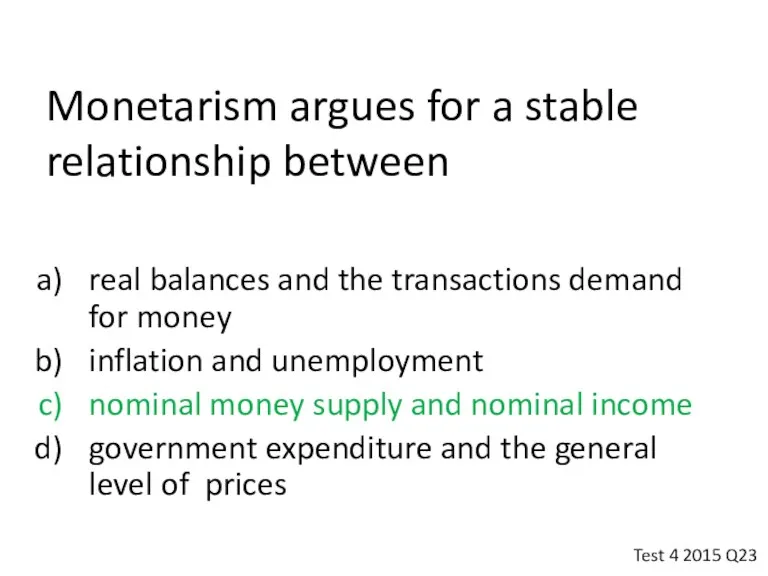
Monetarism argues for a stable relationship between
real balances and the transactions
Monetarism argues for a stable relationship between
real balances and the transactions
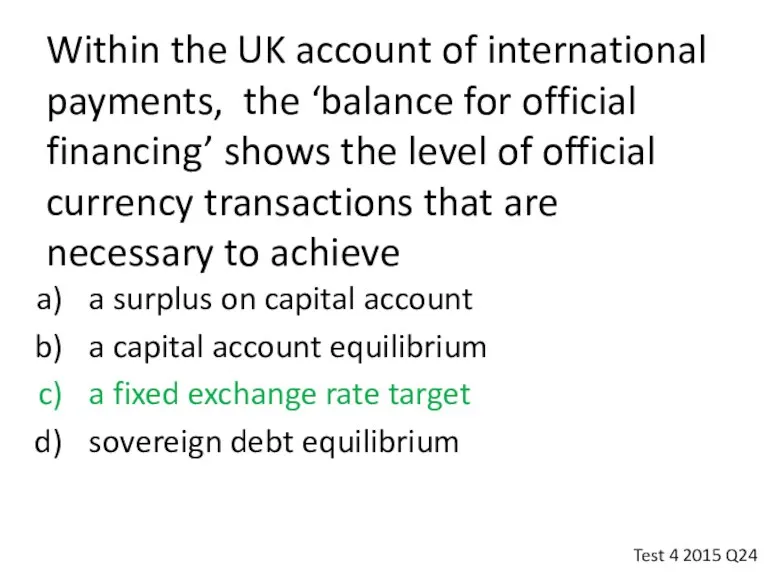
Within the UK account of international payments, the ‘balance for official
Within the UK account of international payments, the ‘balance for official
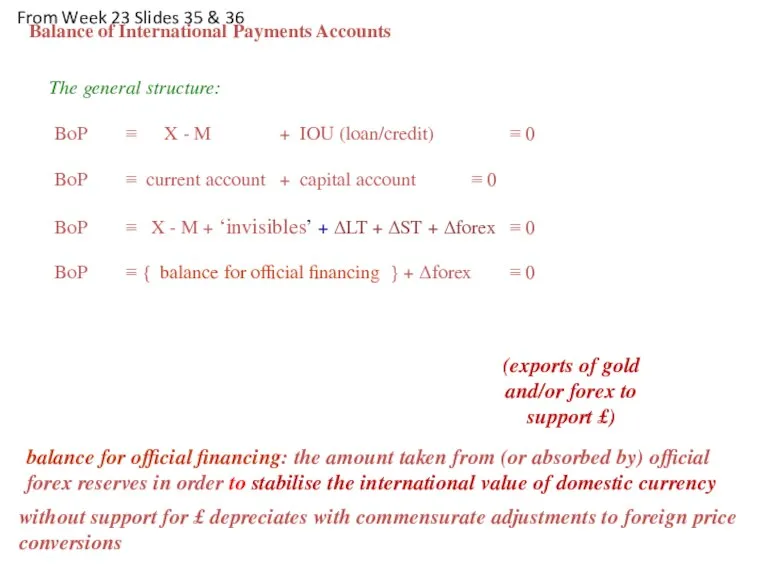
The general structure:
BoP ≡ X - M + IOU (loan/credit)
The general structure:
BoP ≡ X - M + IOU (loan/credit)
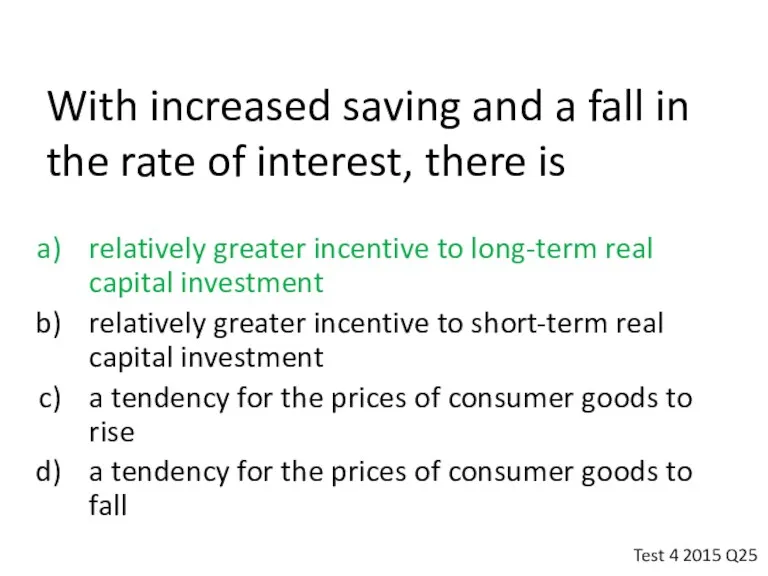
With increased saving and a fall in the rate of interest,
With increased saving and a fall in the rate of interest,
 Концепция развития строительного комплекса Республики Беларусь на 2011 - 2020 годы
 Развитие торгово - экономических связей между Китаем и Россией
 Медицинская демография. Медико-социальные аспекты
 Экономическая политика государства. Тема 6
 Рынок и рыночный механизм. Спрос и предложение
 Основы рыночного хозяйства и его структура. Тема № 2
 Межцивилизационные конфликты как основа нового противостояния в мире
 Система национальных счетов
 Поведенческая экономика
 Малый бизнес в российской экономике
 Принципы экономики. Экономика и человек
 Формирование уставного капитала и его назначение. Потребности в основных и оборотных средствах. Тема № 3
 Организация экономического сотрудничества и развития как инструмент экономической дипломатии
 Предприятие как производственная система, его организационно-правовые основы
 Макроэкономическая нестабильность
 Викторина Веселая экономика
 Экономическая безопасность
 Прогнозирование и планирование в условиях рынка
 Monetary policy
 Государственная поддержка малого и среднего бизнеса
 Научно-технический прогресс, как фактор глобализации
 Расчет финансового результата от реализации продукции
 Стратегическое планирование в Республике Казахстан
 Атлас специализации регионов России
 Организация производства. Предмет, содержание и задачи курса
 Управление эксплуатацией жилищного фонда. Жилищное самоуправление. (Тема 4)
 Российское предприятие на мировом рынке. Сравнительный анализ преимуществ и недостатков его конкурентоспособности
 Цифровая трансформация национальной экономики Беларуси