- Financial Statement Analysis

Содержание
- 2. Outline Meaning of Financial Statements and Financial Statement Analysis Significance of Financial Statements Types of Financial
- 3. Focus The focus will be on financial statement analysis and its use in corporate finance. financial
- 4. Meaning of Financial Statements Financial statements are summaries of the operating, financing, and investment activities of
- 5. The financial statements are expected to be prepared in accordance with a set of standards known
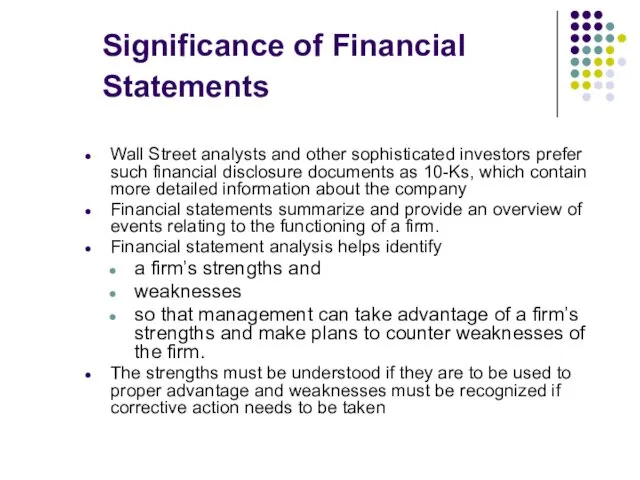
- 6. Significance of Financial Statements Wall Street analysts and other sophisticated investors prefer such financial disclosure documents
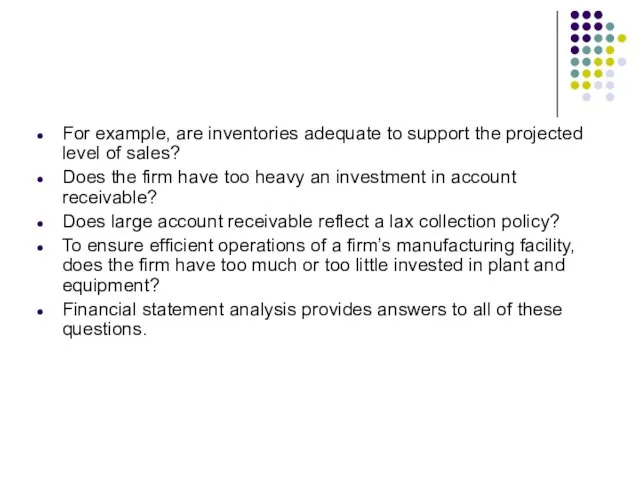
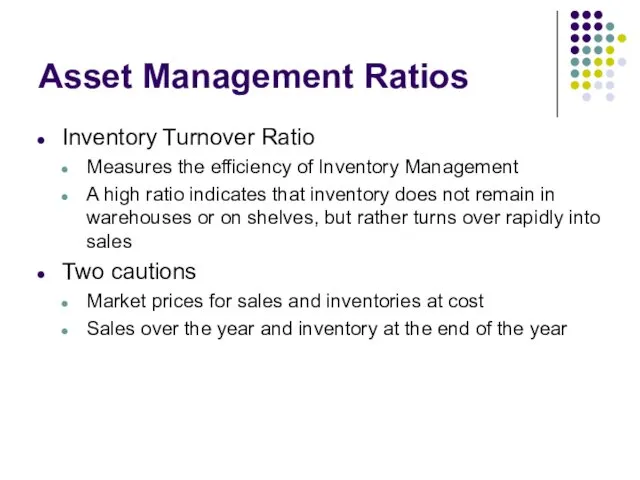
- 7. For example, are inventories adequate to support the projected level of sales? Does the firm have
- 8. Types of Financial Statements and Reports ⮚ The Income Statement ⮚ The Balance Sheet ⮚ The
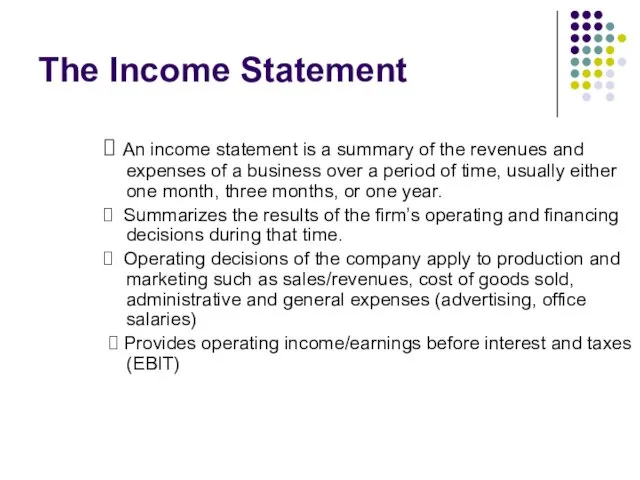
- 9. The Income Statement ⮚ An income statement is a summary of the revenues and expenses of
- 10. Results of financing decisions are reflected in the remainder of the income statement. When interest expenses
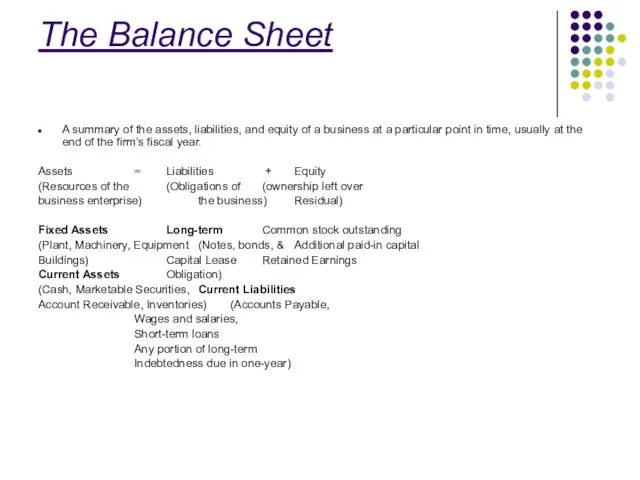
- 11. The Balance Sheet A summary of the assets, liabilities, and equity of a business at a
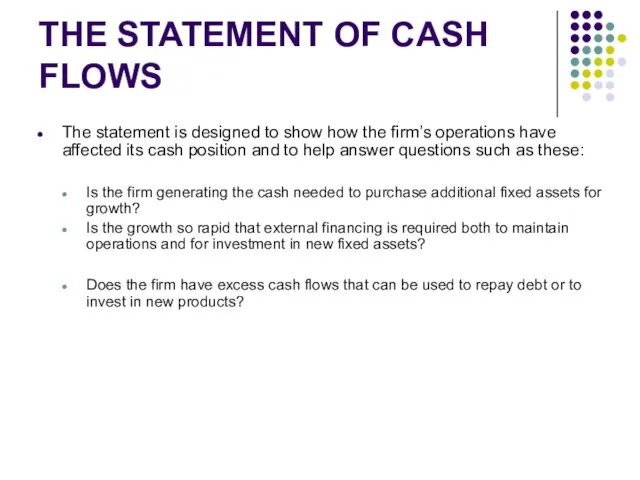
- 12. THE STATEMENT OF CASH FLOWS The statement is designed to show how the firm’s operations have
- 13. RATIO ANALYSIS Financial statements report both on a firm’s position at a point in time and
- 14. Ratio analysis begins with the calculation of a set of financial ratios designed to show the
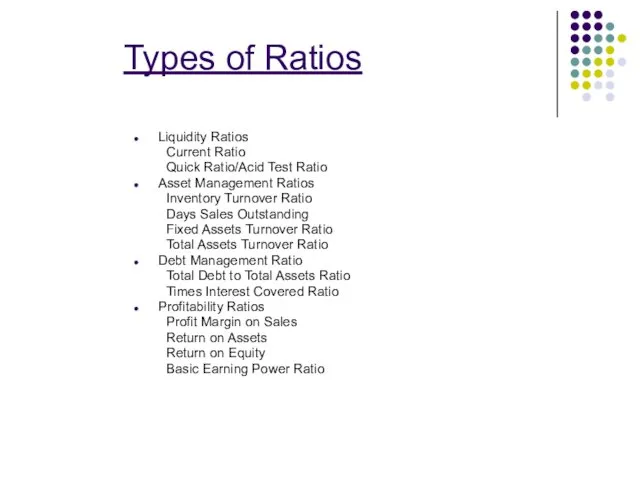
- 15. Types of Ratios Liquidity Ratios Current Ratio Quick Ratio/Acid Test Ratio Asset Management Ratios Inventory Turnover
- 16. Liquidity Ratio A liquid asset is one that can be easily converted into cash at a
- 17. Asset Management Ratios Asset management ratio measures how effectively the firm is managing/using its assets Do
- 18. Asset Management Ratios Inventory Turnover Ratio Measures the efficiency of Inventory Management A high ratio indicates
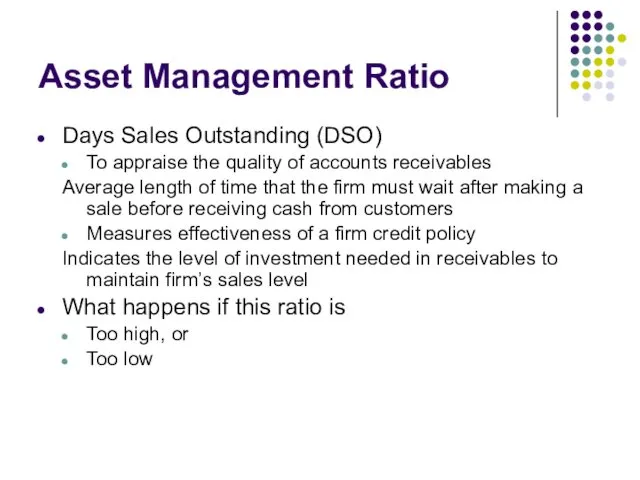
- 19. Asset Management Ratio Days Sales Outstanding (DSO) To appraise the quality of accounts receivables Average length
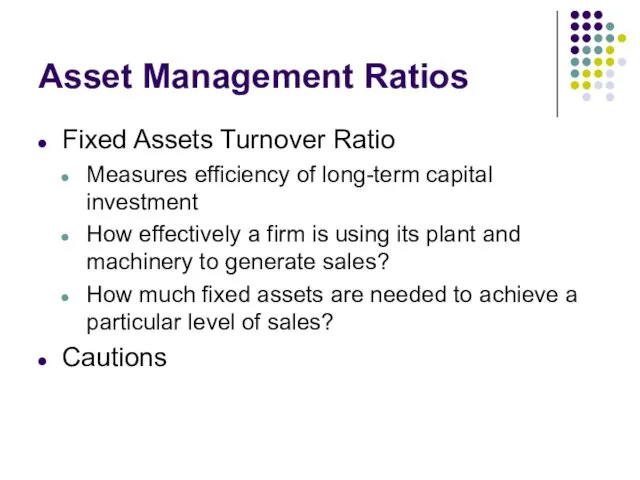
- 20. Asset Management Ratios Fixed Assets Turnover Ratio Measures efficiency of long-term capital investment How effectively a
- 21. Asset Management Ratio Total Asset Turnover Ratio Measure efficiency of total assets for the company as
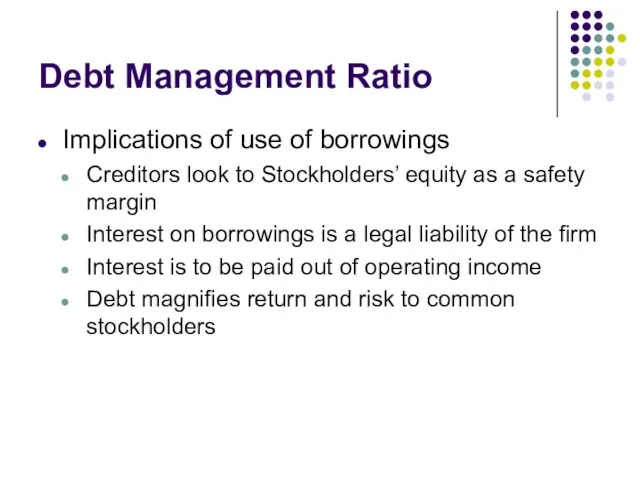
- 22. Debt Management Ratio Implications of use of borrowings Creditors look to Stockholders’ equity as a safety
- 23. Total Debt to Total Assets Ratio Measures percentage of assets being financed through borrowings Too high
- 24. Times Earned Interest (TIE) Measure the extent to which operating income can decline before the firm
- 25. Profitability Ratios Net result of a number of policies and decisions Show the combined effect of
- 26. Net Profit Margin on Sales Relates net income available to common stockholders to sales Basic Earning
- 28. Скачать презентацию
Outline
Meaning of Financial Statements and Financial Statement Analysis
Significance of Financial Statements
Types
Outline
Meaning of Financial Statements and Financial Statement Analysis
Significance of Financial Statements
Types
Focus
The focus will be on financial statement analysis and its use
Focus
The focus will be on financial statement analysis and its use
Meaning of Financial Statements
Financial statements are summaries of the operating, financing,
Meaning of Financial Statements
Financial statements are summaries of the operating, financing,
The financial statements are expected to be prepared in accordance with
The financial statements are expected to be prepared in accordance with
Significance of Financial Statements
Wall Street analysts and other sophisticated investors
Significance of Financial Statements
Wall Street analysts and other sophisticated investors
For example, are inventories adequate to support the projected level of
For example, are inventories adequate to support the projected level of
Types of Financial Statements and Reports
⮚ The Income Statement
⮚ The
Types of Financial Statements and Reports
⮚ The Income Statement
⮚ The
The Income Statement
⮚ An income statement is a summary of the
The Income Statement
⮚ An income statement is a summary of the
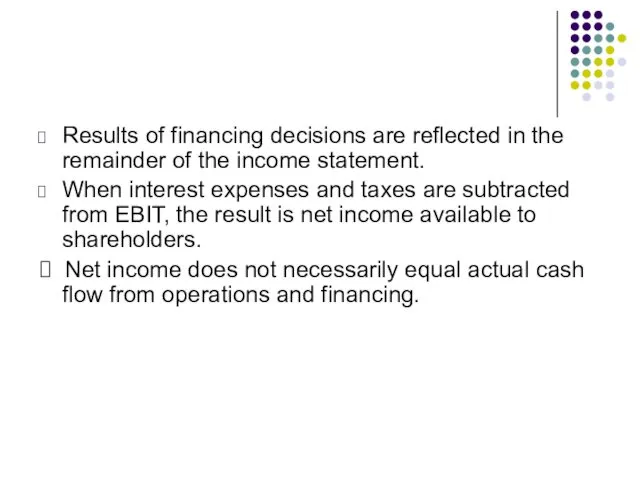
Results of financing decisions are reflected in the remainder of the
Results of financing decisions are reflected in the remainder of the
The Balance Sheet
A summary of the assets, liabilities, and equity of
The Balance Sheet
A summary of the assets, liabilities, and equity of
THE STATEMENT OF CASH FLOWS
The statement is designed to show
THE STATEMENT OF CASH FLOWS
The statement is designed to show
RATIO ANALYSIS
Financial statements report both on a firm’s position at a
RATIO ANALYSIS
Financial statements report both on a firm’s position at a
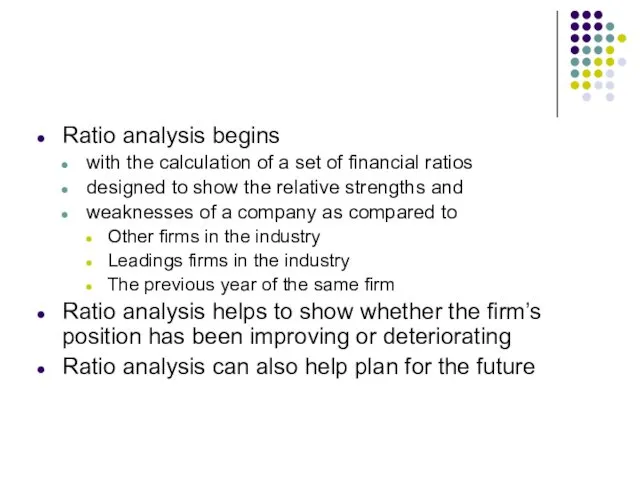
Ratio analysis begins
with the calculation of a set of financial
Ratio analysis begins
with the calculation of a set of financial
Types of Ratios
Liquidity Ratios
Current Ratio
Quick Ratio/Acid Test Ratio
Asset Management Ratios
Inventory Turnover
Types of Ratios
Liquidity Ratios
Current Ratio
Quick Ratio/Acid Test Ratio
Asset Management Ratios
Inventory Turnover
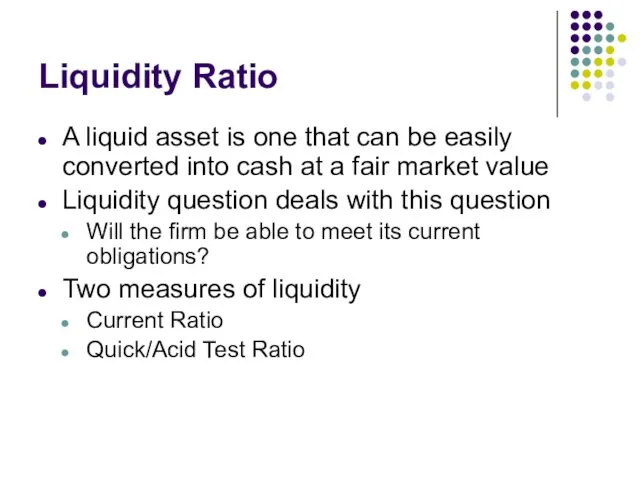
Liquidity Ratio
A liquid asset is one that can be easily converted
Liquidity Ratio
A liquid asset is one that can be easily converted
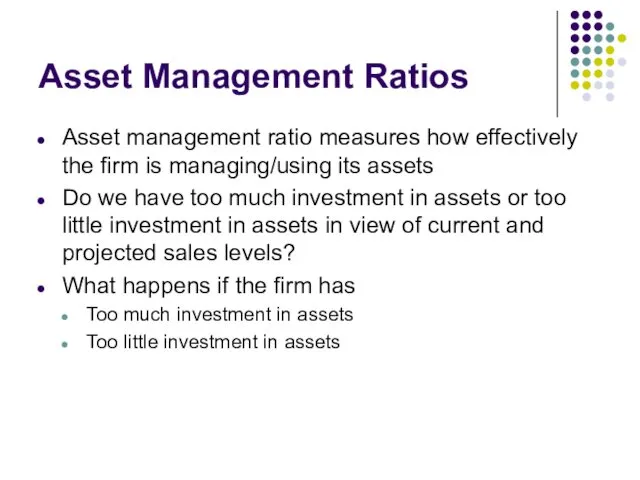
Asset Management Ratios
Asset management ratio measures how effectively the firm is
Asset Management Ratios
Asset management ratio measures how effectively the firm is
Asset Management Ratios
Inventory Turnover Ratio
Measures the efficiency of Inventory Management
A high
Asset Management Ratios
Inventory Turnover Ratio
Measures the efficiency of Inventory Management
A high
Asset Management Ratio
Days Sales Outstanding (DSO)
To appraise the quality of accounts
Asset Management Ratio
Days Sales Outstanding (DSO)
To appraise the quality of accounts
Asset Management Ratios
Fixed Assets Turnover Ratio
Measures efficiency of long-term capital investment
How
Asset Management Ratios
Fixed Assets Turnover Ratio
Measures efficiency of long-term capital investment
How
Asset Management Ratio
Total Asset Turnover Ratio
Measure efficiency of total assets for
Asset Management Ratio
Total Asset Turnover Ratio
Measure efficiency of total assets for
Debt Management Ratio
Implications of use of borrowings
Creditors look to Stockholders’ equity
Debt Management Ratio
Implications of use of borrowings
Creditors look to Stockholders’ equity
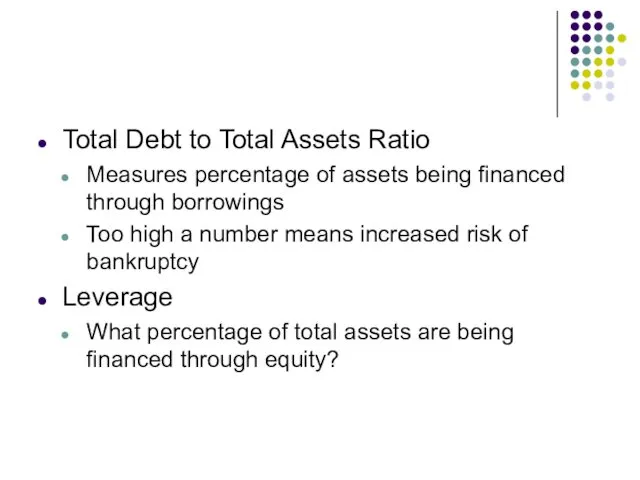
Total Debt to Total Assets Ratio
Measures percentage of assets being financed
Total Debt to Total Assets Ratio
Measures percentage of assets being financed
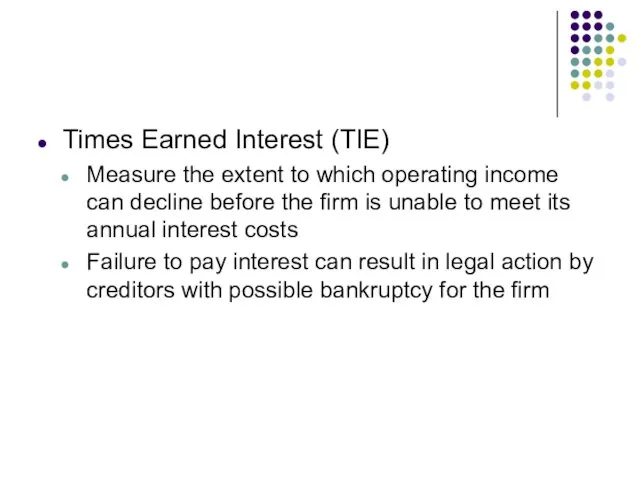
Times Earned Interest (TIE)
Measure the extent to which operating income can
Times Earned Interest (TIE)
Measure the extent to which operating income can
Profitability Ratios
Net result of a number of policies and decisions
Show the
Profitability Ratios
Net result of a number of policies and decisions
Show the
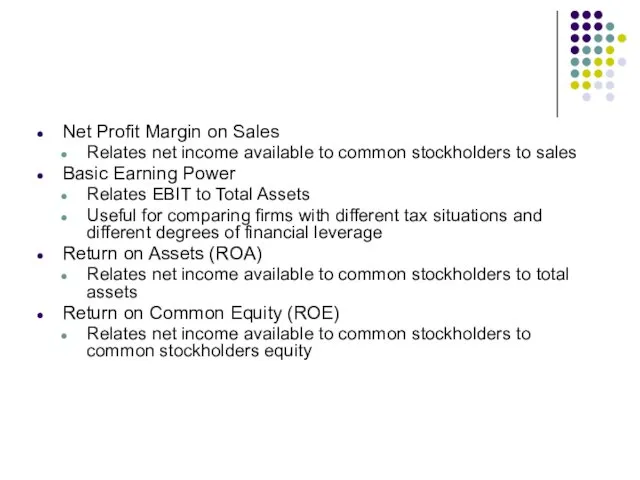
Net Profit Margin on Sales
Relates net income available to common stockholders
Net Profit Margin on Sales
Relates net income available to common stockholders
 Ндфл. НК РФ налог на доходы физических лиц
 Бухгалтерский учет и анализ эффективности использования материально-производственных запасов
 Технический анализ финансовых рынков
 Ценообразование и цены на продукцию АПК
 Индивидуальные инвестиционные cчета
 Сводная таблица расчетов транспортных издержек
 Регулирование и надзор за деятельностью институтов кредитного рынка в России в сфере финансового посредничества
 Финансовая система страны
 Бюджетная система государства, основы ее построения
 Ценные бумаги
 Пенсионное обеспечение в Российской Федерации
 Налоги и налогообложение на предприятии
 Отчет о выполнении отраслевого соглашения в области оплаты труда. Росатом
 Налогообложение индивидуальных предпринимателей в РФ
 Тест Хауи в США: современная практика его применения
 Исполнение налоговой обязанности
 Особенности определения налоговой базы налога на прибыль:
 Всероссийская олимпиада по финансовой грамотности, финансовому рынку и защите прав потребителей финансовых услуг
 Доходы и прибыль предприятия
 Валютні операції комерційного банку
 Бюджет. Бюджетная классификация доходов и расходов. (Тема 1)
 Развитие банковской системы в России
 Товарные и фондовые биржи
 Израиль банк жүйесі
 Взаимосвязь финансов с экономическими категориями (кредит, цена, право)
 Учет и анализ финансовых результатов в ОАО Псковавиа
 Антикризисный менеджмент. Сущность и причины неплатежеспособности предприятия. (Лекция 4)
 Управление инвестиционной деятельностью компании