- Financial Statement. Analysis

Содержание
- 2. Profitability Margins and return ratios provide information on the profitability of a company and the efficiency
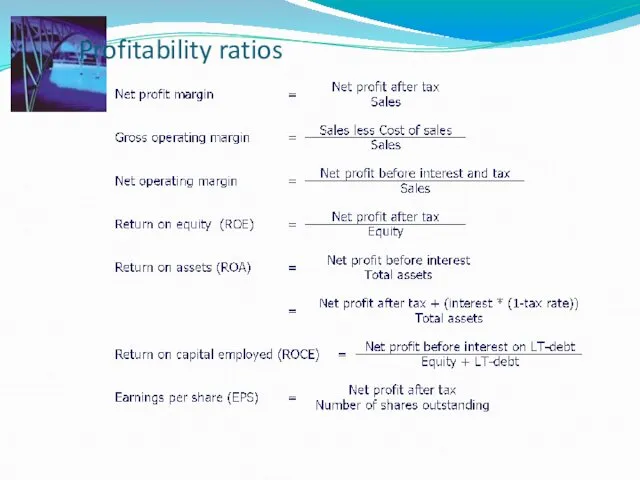
- 3. Profitability ratios
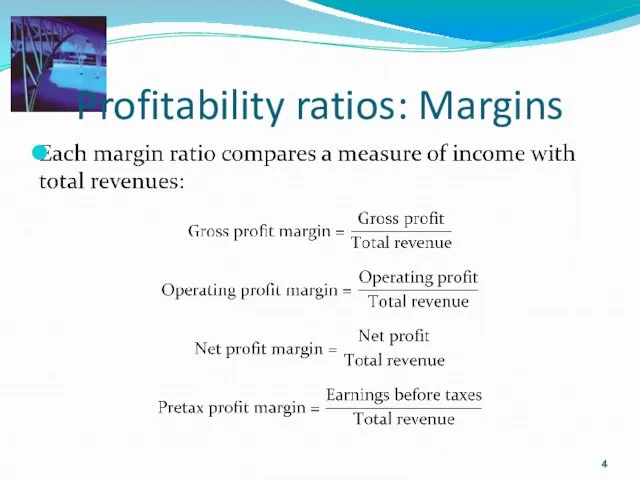
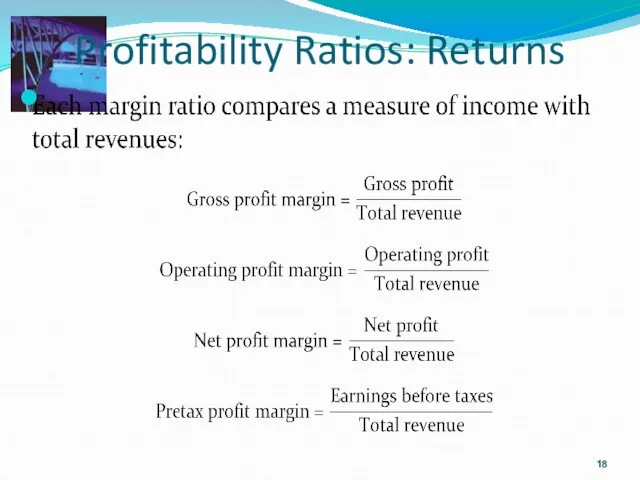
- 4. Profitability ratios: Margins
- 5. Earnings, (or net income,) are simply revenues minus costs. They are an accounting measure of profits.
- 6. Retained earnings Retained earnings are the earnings re-invested into the firm: Retained earnings = earnings -
- 7. Measuring profit Return on equity (ROE) uses accounting values: earnings divided by book value of equity.
- 8. Return on assets Return on assets (ROA) is another important measure of portability. Again, ROA uses
- 9. AAA’s Balance Sheet (Asset Side) a. How the firm stands on a specific date. b. What
- 10. AAA’s Balance Sheet (Liability Side) a. Note, Assets = Liabilities + Equity. b. What AAA owed
- 11. AAA’s Income Statement a. Measures profitability over a time period. b. Received, or receivable, from customers.
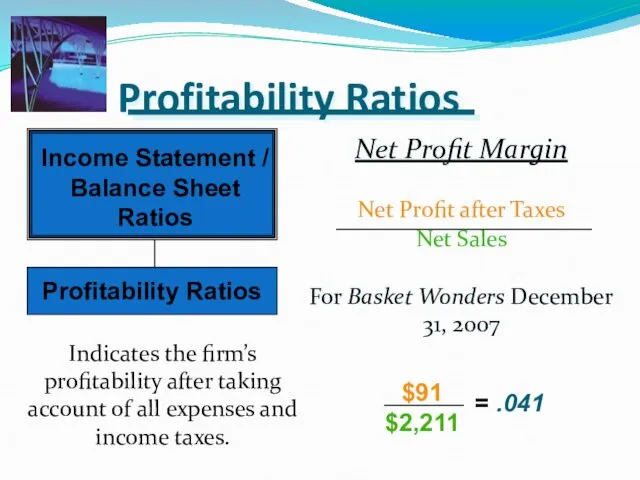
- 12. Profitability Ratios Gross Profit Margin Gross Profit Net Sales For Basket Wonders December 31, 2007 Indicates
- 13. Profitability Ratio Comparisons BW Industry 27.7% 31.1% 28.7 30.8 31.3 27.6 Year 2007 2006 2005 Gross
- 14. Gross Profit Margin -- Trend Analysis Comparison
- 15. Profitability Ratios Net Profit Margin Net Profit after Taxes Net Sales For Basket Wonders December 31,
- 16. Profitability Ratio Comparisons BW Industry 4.1% 8.2% 4.9 8.1 9.0 7.6 Year 2007 2006 2005 Net
- 17. Net Profit Margin -- Trend Analysis Comparison
- 18. Profitability Ratios: Returns
- 19. Profitability Ratios Return on Assets Net Income after Taxes Total Assets For Basket Wonders December 31,
- 20. Profitability Ratio Comparisons BW Industry 4.2% 9.8% 5.0 9.1 9.1 10.8 Year 2007 2006 2005 Return
- 21. Return on Investment – Trend Analysis Comparison
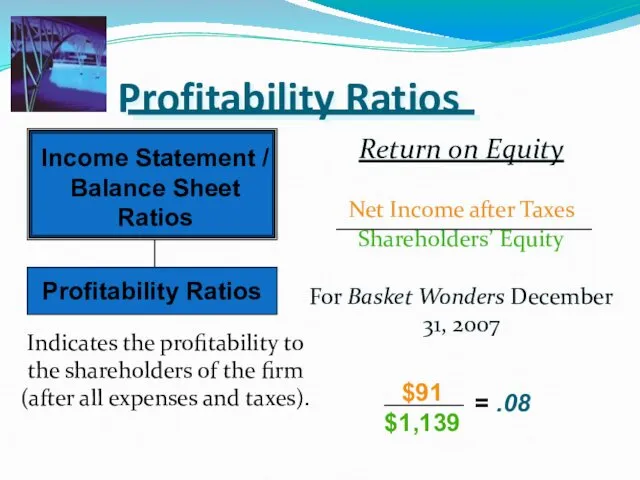
- 22. Profitability Ratios Return on Equity Net Income after Taxes Shareholders’ Equity For Basket Wonders December 31,
- 23. Profitability Ratio Comparisons BW Industry 8.0% 17.9% 9.4 17.2 16.6 20.4 Year 2007 2006 2005 Return
- 24. Return on Equity -- Trend Analysis Comparison
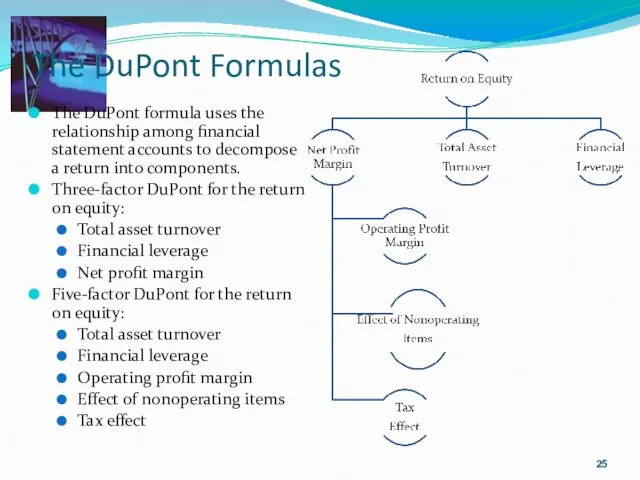
- 25. The DuPont Formulas The DuPont formula uses the relationship among financial statement accounts to decompose a
- 26. Five-Component DuPont Model
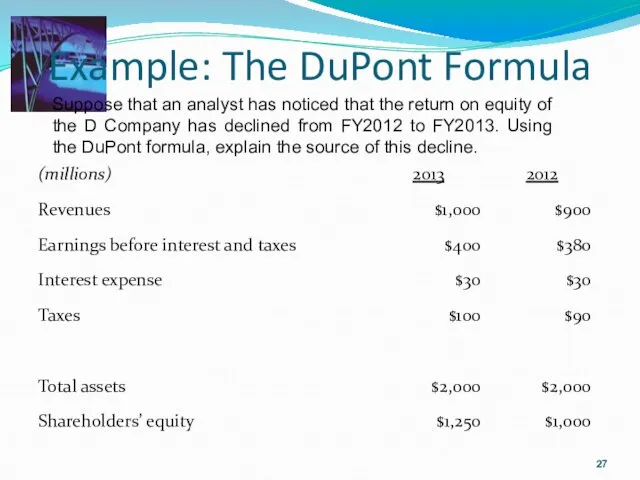
- 27. Example: The DuPont Formula Suppose that an analyst has noticed that the return on equity of
- 28. Example: the DuPont Formula
- 29. Other Ratios
- 30. Other Ratios
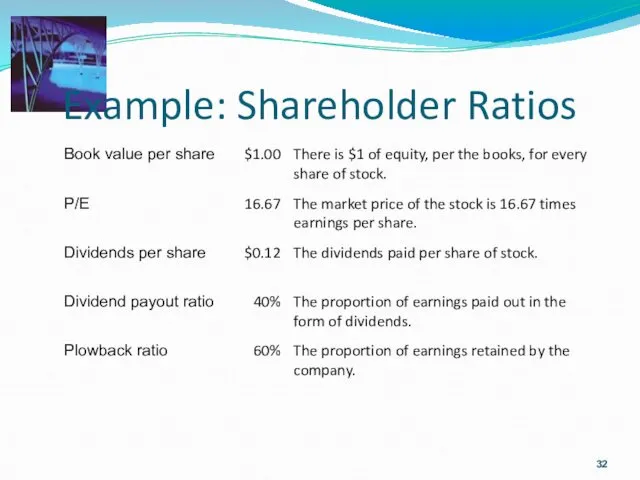
- 31. Example: Shareholder ratios Calculate the book value per share, P/E, dividends per share, dividend payout, and
- 32. Example: Shareholder Ratios
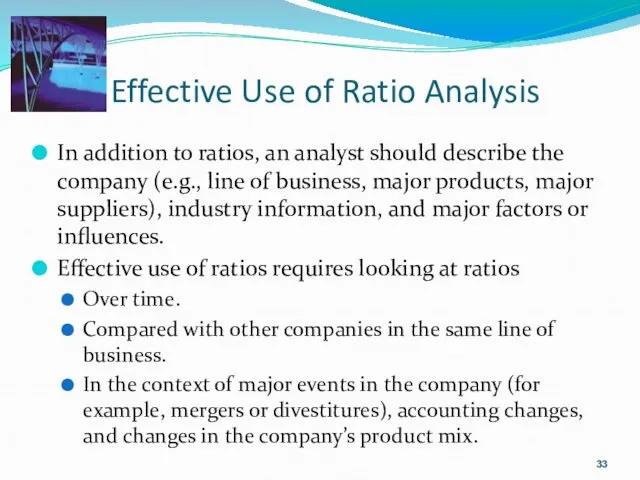
- 33. Effective Use of Ratio Analysis In addition to ratios, an analyst should describe the company (e.g.,
- 35. Скачать презентацию
Profitability
Margins and return ratios provide information on the profitability of a
Profitability
Margins and return ratios provide information on the profitability of a
Profitability ratios
Profitability ratios
Profitability ratios: Margins
Profitability ratios: Margins
Earnings, (or net income,) are simply revenues minus costs. They are
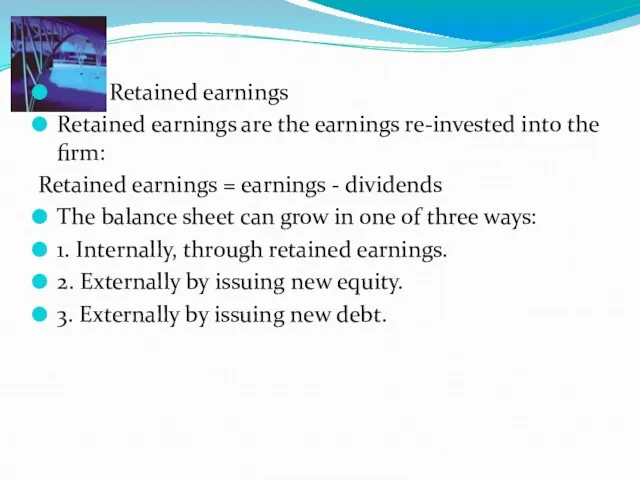
Retained earnings
Retained earnings are the earnings re-invested into the firm:
Retained
Retained earnings
Retained earnings are the earnings re-invested into the firm:
Retained
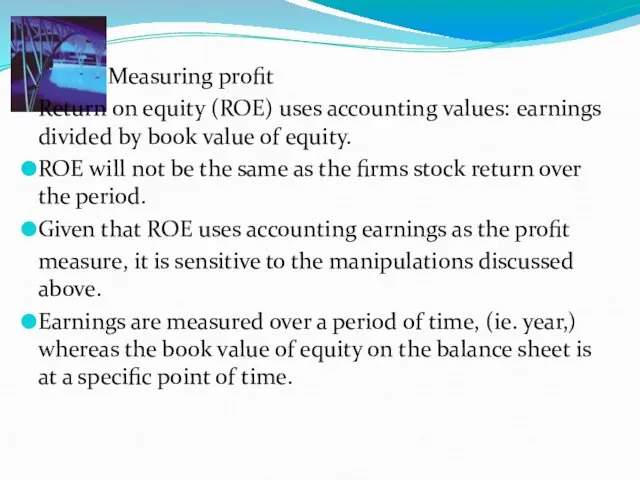
Measuring profit
Return on equity (ROE) uses accounting values: earnings divided
Measuring profit
Return on equity (ROE) uses accounting values: earnings divided
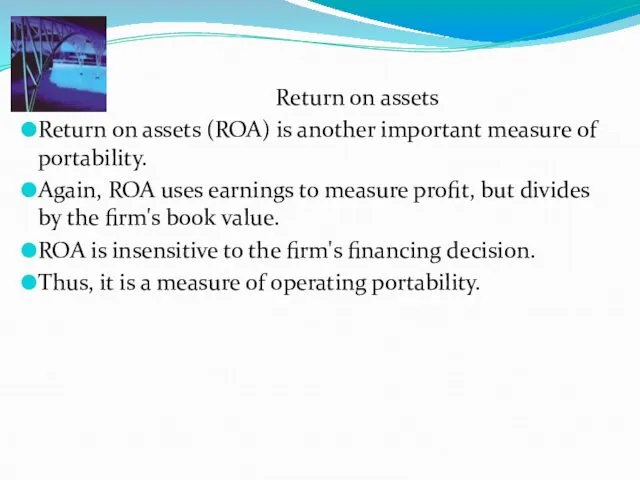
Return on assets
Return on assets (ROA) is another important measure
Return on assets
Return on assets (ROA) is another important measure
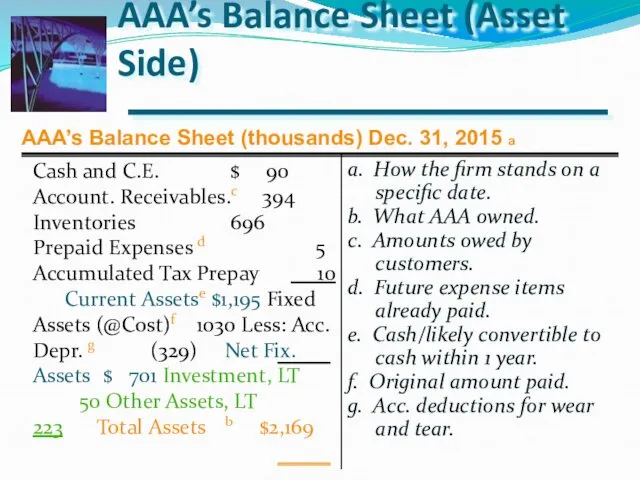
AAA’s Balance Sheet (Asset Side)
a. How the firm stands on a
AAA’s Balance Sheet (Asset Side)
a. How the firm stands on a
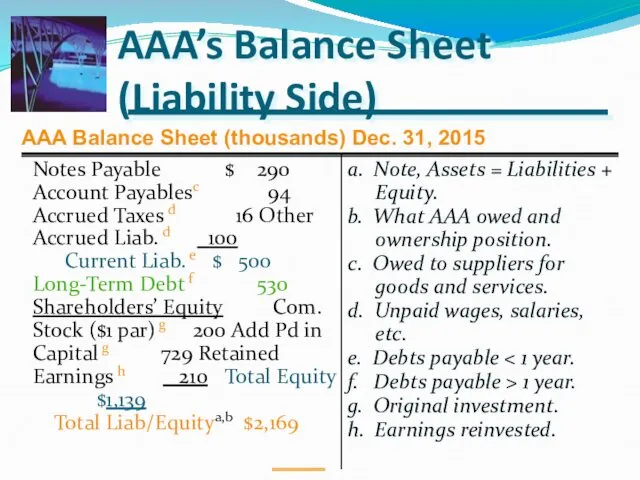
AAA’s Balance Sheet (Liability Side)
a. Note, Assets = Liabilities + Equity.
b.
AAA’s Balance Sheet (Liability Side)
a. Note, Assets = Liabilities + Equity.
b.
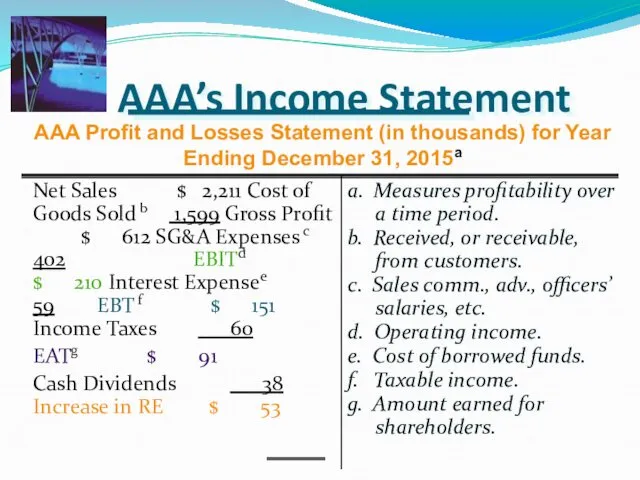
AAA’s Income Statement
a. Measures profitability over a time period.
b. Received, or
AAA’s Income Statement
a. Measures profitability over a time period.
b. Received, or
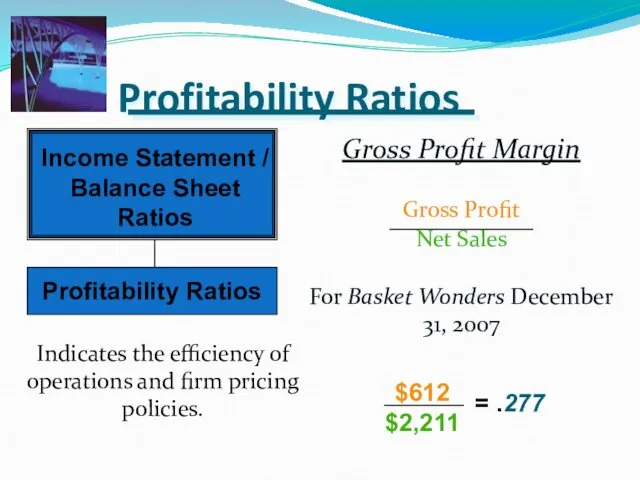
Profitability Ratios
Gross Profit Margin
Gross Profit
Net Sales
For Basket Wonders December 31, 2007
Indicates
Profitability Ratios
Gross Profit Margin
Gross Profit
Net Sales
For Basket Wonders December 31, 2007
Indicates
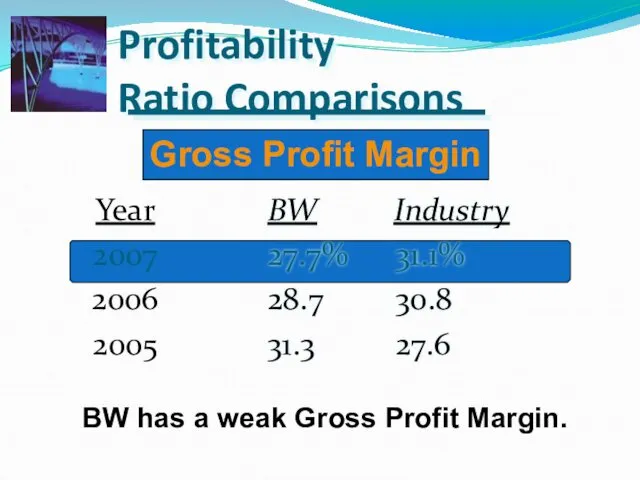
Profitability
Ratio Comparisons
BW Industry
27.7% 31.1%
28.7 30.8
31.3 27.6
Year
2007
2006
2005
Gross Profit Margin
BW has a weak Gross Profit Margin.
Profitability
Ratio Comparisons
BW Industry
27.7% 31.1%
28.7 30.8
31.3 27.6
Year
2007
2006
2005
Gross Profit Margin
BW has a weak Gross Profit Margin.
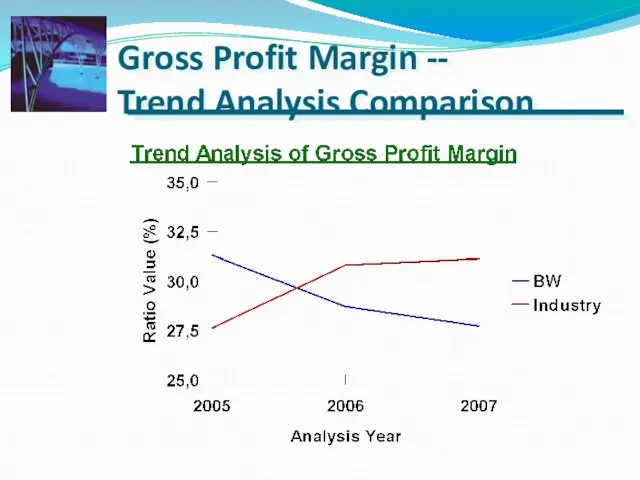
Gross Profit Margin --
Trend Analysis Comparison
Gross Profit Margin --
Trend Analysis Comparison
Profitability Ratios
Net Profit Margin
Net Profit after Taxes
Net Sales
For Basket Wonders December
Profitability Ratios
Net Profit Margin
Net Profit after Taxes
Net Sales
For Basket Wonders December
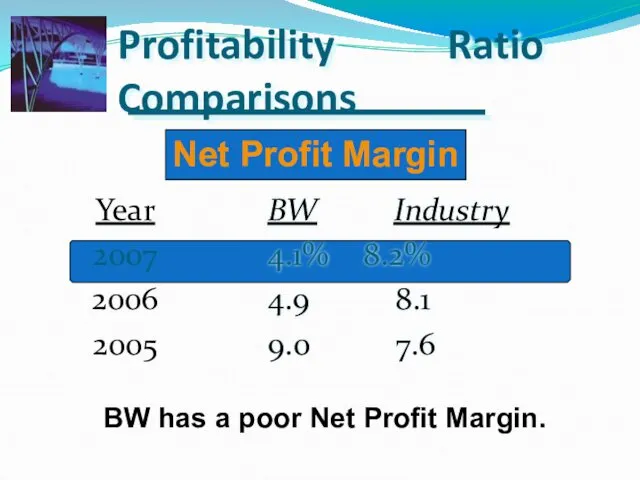
Profitability Ratio Comparisons
BW Industry
4.1% 8.2%
4.9 8.1
9.0 7.6
Year
2007
2006
2005
Net Profit Margin
BW has a poor Net Profit
Profitability Ratio Comparisons
BW Industry
4.1% 8.2%
4.9 8.1
9.0 7.6
Year
2007
2006
2005
Net Profit Margin
BW has a poor Net Profit
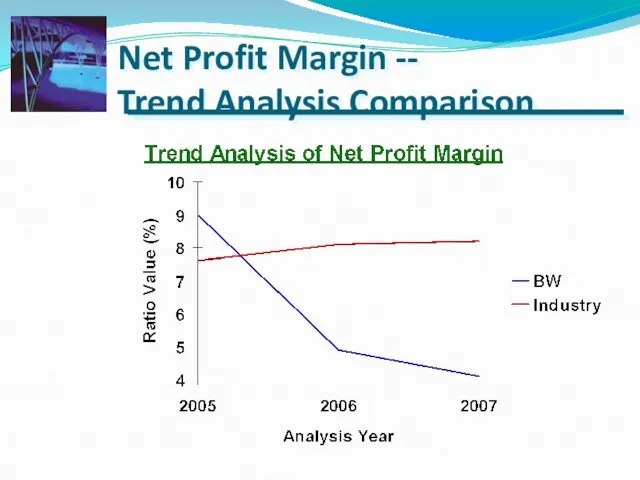
Net Profit Margin --
Trend Analysis Comparison
Net Profit Margin --
Trend Analysis Comparison
Profitability Ratios: Returns
Profitability Ratios: Returns
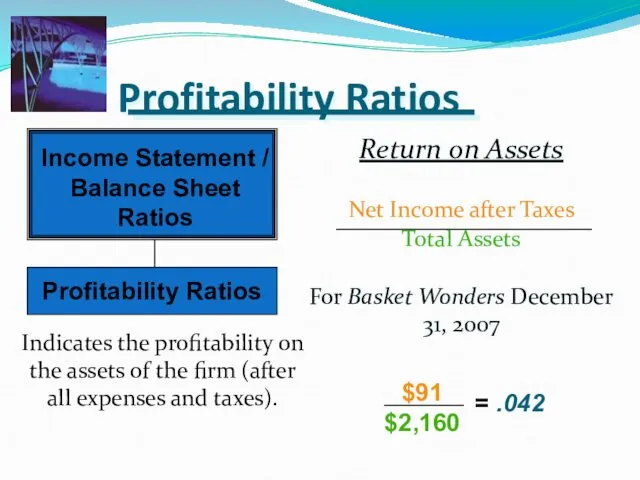
Profitability Ratios
Return on Assets
Net Income after Taxes
Total Assets
For Basket Wonders December
Profitability Ratios
Return on Assets
Net Income after Taxes
Total Assets
For Basket Wonders December
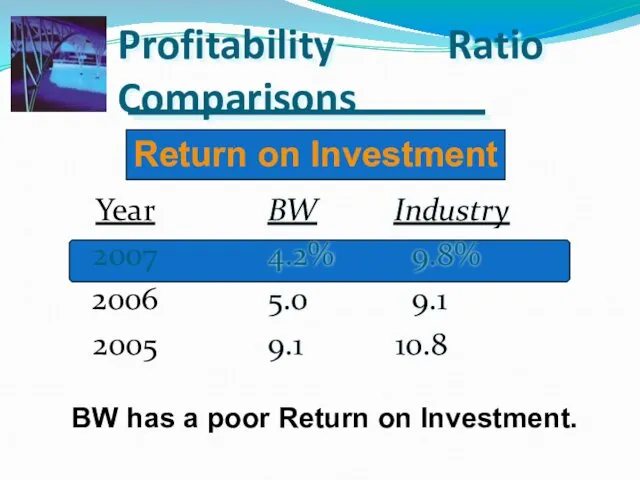
Profitability Ratio Comparisons
BW Industry
4.2% 9.8%
5.0 9.1
9.1 10.8
Year
2007
2006
2005
Return on Investment
BW has a poor
Profitability Ratio Comparisons
BW Industry
4.2% 9.8%
5.0 9.1
9.1 10.8
Year
2007
2006
2005
Return on Investment
BW has a poor
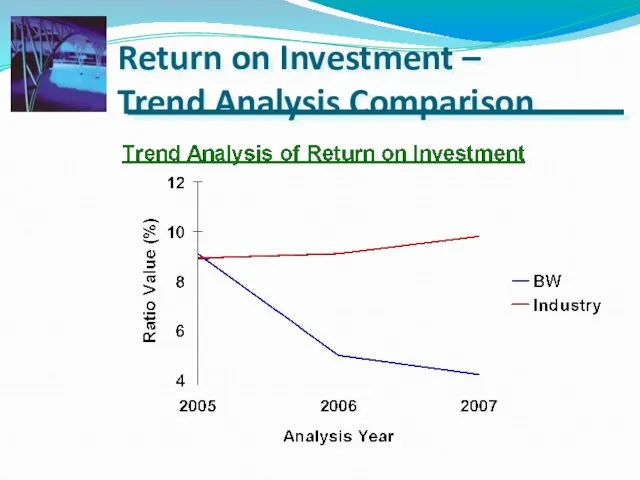
Return on Investment –
Trend Analysis Comparison
Return on Investment –
Trend Analysis Comparison
Profitability Ratios
Return on Equity
Net Income after Taxes
Shareholders’ Equity
For Basket Wonders December
Profitability Ratios
Return on Equity
Net Income after Taxes
Shareholders’ Equity
For Basket Wonders December

Profitability Ratio Comparisons
BW Industry
8.0% 17.9%
9.4 17.2
16.6 20.4
Year
2007
2006
2005
Return on Equity
BW has a
Profitability Ratio Comparisons
BW Industry
8.0% 17.9%
9.4 17.2
16.6 20.4
Year
2007
2006
2005
Return on Equity
BW has a
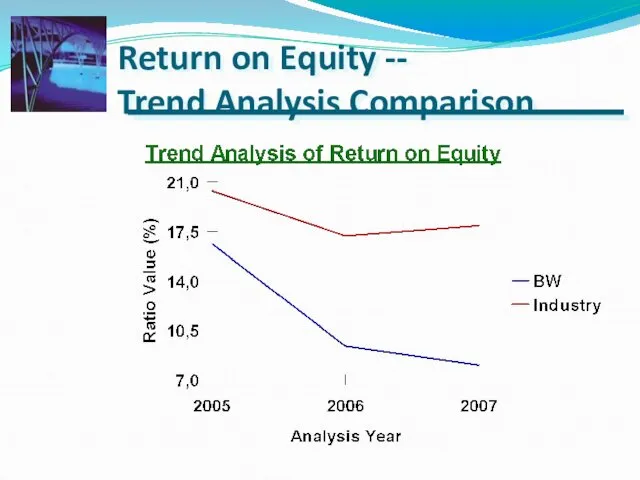
Return on Equity --
Trend Analysis Comparison
Return on Equity --
Trend Analysis Comparison
The DuPont Formulas
The DuPont formula uses the relationship among financial statement
The DuPont Formulas
The DuPont formula uses the relationship among financial statement

Five-Component DuPont Model
Five-Component DuPont Model
Example: The DuPont Formula
Suppose that an analyst has noticed that the
Example: The DuPont Formula
Suppose that an analyst has noticed that the
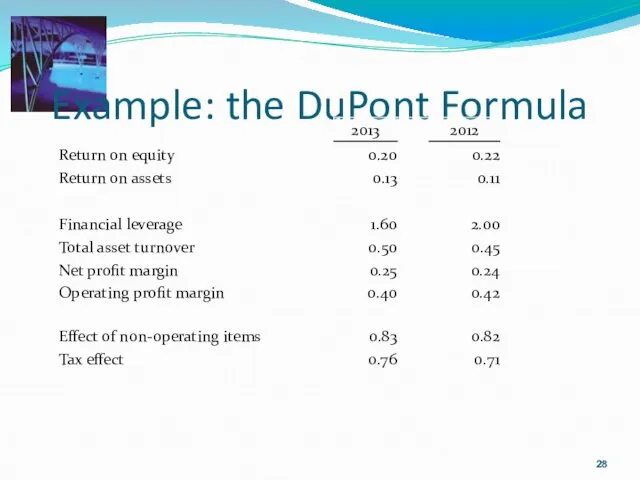
Example: the DuPont Formula
Example: the DuPont Formula
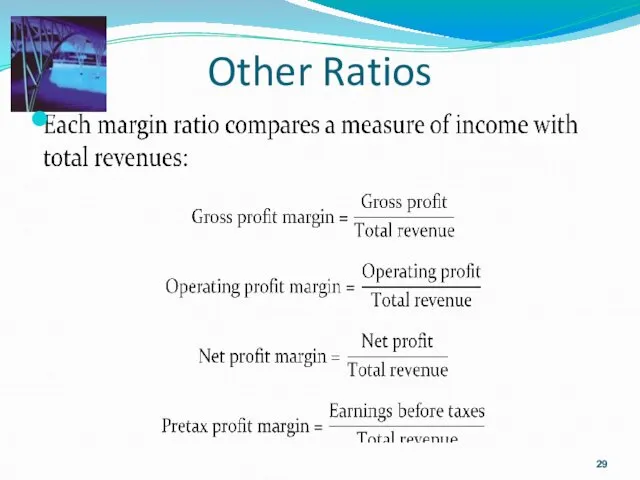
Other Ratios
Other Ratios
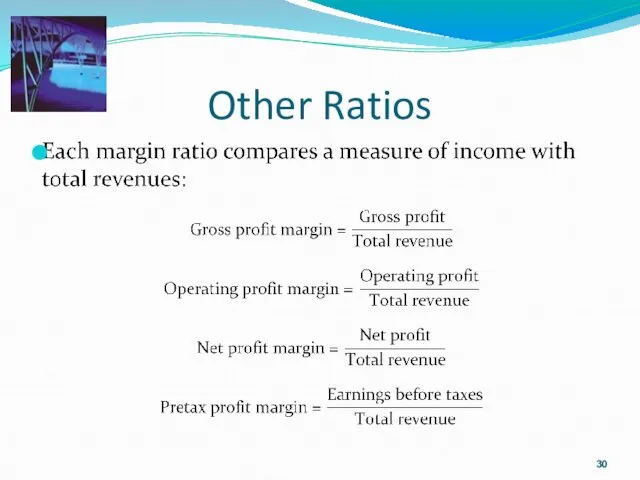
Other Ratios
Other Ratios
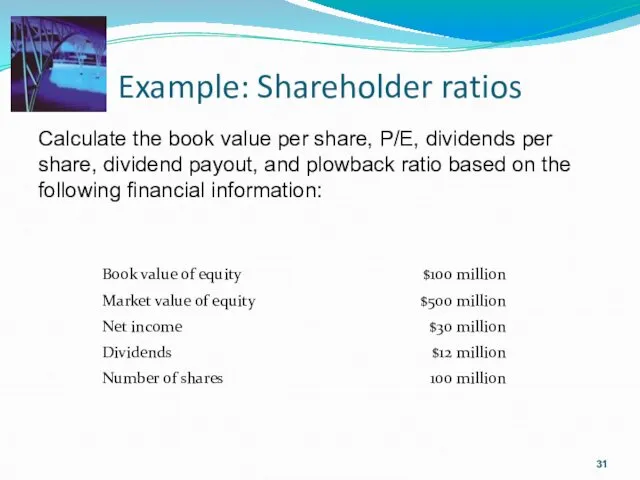
Example: Shareholder ratios
Calculate the book value per share, P/E, dividends per
Example: Shareholder ratios
Calculate the book value per share, P/E, dividends per
Example: Shareholder Ratios
Example: Shareholder Ratios
Effective Use of Ratio Analysis
In addition to ratios, an analyst should
Effective Use of Ratio Analysis
In addition to ratios, an analyst should
 Оценка инвестиционного проекта
 Повышение заработной платы классным руководителям и молодым специалистам общеобразовательных организаций с 01.09. 2018 года
 Спрос на деньги (классическая и кейнсианская концепции). Модель предложения денег. Равновесие на денежном рынке
 Продукт Доктор Ресо. Екатеринбург. Добровольное медицинское страхование физических лиц
 Валюта_2023_УЧЕБНАЯ
 Андеррайтинговые операции банков
 Правове регулювання ринку цінних паперів
 Внесення змін до стипендійного забезпечення студентів
 Формирование и анализ финансовой отчетности
 Учет кассовых операций. Презентации и их роль в образовательном процессе
 Коммерческое предложение по кредитованию и банковской гарантии
 Оказание поддержки субъектам малого и среднего предпринимательства Корпорацией МСП в период 2015-2018 годов
 Операции на международном валютном рынке
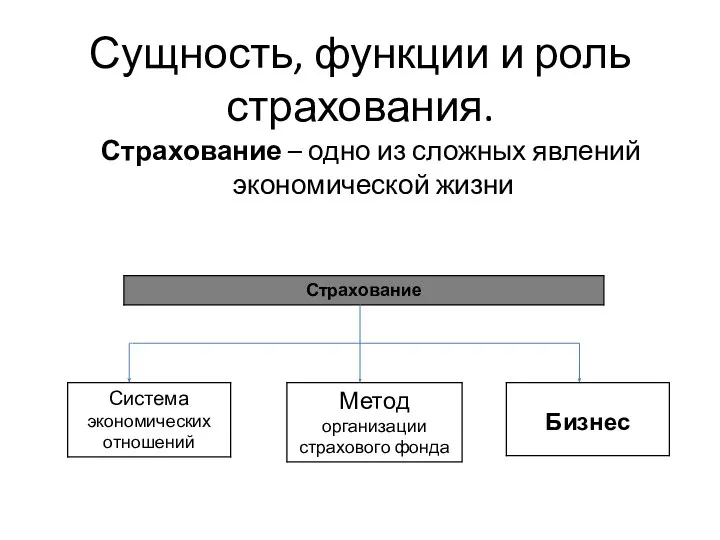 Сущность, функции и роль страхования
 Тарифная политика в страховании
 Роль грошей у ринковій економіці
 Банковские услуги и отношения людей с банками
 Дробление бизнеса
 Правовое регулирование рынка ценных бумаг
 Единый налог на вменённый доход для отдельных видов деятельности (ЕНВД)
 Зарубіжний досвід забезпечення безпеки банківської діяльності
 Российская компания “Сonsulting club”
 Коммерческие предложения. Продажа объектов недвижимости
 Історія виникнення та розвитку аудиту
 Этика оценщиков
 Инициативное предложение члена бюджетной комиссии Ефимовой Ольги Александровны в рамках проекта Народный бюджет
 Учет поступления и расходования денежных средств (на примере НИИЦ (г. Курск) ФГУП 18 ЦНИИ МО РФ)
 Учет операций по привлечению денежных средств по договорам займа и кредитным договорам. Глава 6