- Fundamentals of financial statement analysis. (Lecture 1)

Содержание
- 2. LEARNING OBJECTIVES Understand and conduct horizontal analysis Create, understand, and interpret common-size financial statements. Calculate and
- 3. I. Overview of Financial Statements
- 4. TYPES OF FINANCIAL STATEMENTS Balance Sheet Income Statement Statement of Cash Flows Statement of Changes in
- 5. BALANCE SHEET Assets Liabilities Equity = + Statement of financial position Statement of financial Condition The
- 6. INCOME STATEMENT (P/L STATEMENT) It is also known as Profit/Loss Statement, Operating Statement, or Statement of
- 7. INCOME STATEMENT (P/L STATEMENT) Total Sales / Revenues Cost of Goods Sold (COGS) Gross Profit Operating
- 8. CASH FLOWS STATEMENT Cash flows from Operations Cash flows from Investments Cash flows from Financing Net
- 9. STATEMENT OF OWNER’S EQUITY Statement of Changes in the Owner’s Equity is a financial statement that
- 10. Stockholders’ (Owners’) Equity accounts Owners’ investment in the corporation through the ownership of stock Owners’ claims
- 11. Stockholders’ (Owners’) Equity accounts Increase in stockholders’ equity from delivering goods or services to customers (revenues
- 12. (1) Increases in stockholders’ equity: Sale of stock and net income (revenue greater than expenses). (2)
- 13. II. ANALYSIS OF FINANCIAL STATEMENTS
- 14. APPROACHES TOWARDS FINANCIAL ANALYSIS To conduct financial analysis it is possible to Compare actual with budgeted
- 15. PERFORMANCE ANALYSIS: BUDGETED VS. ACTUAL
- 16. PERFORMANCE ANALYSIS: BUDGETED VS. ACTUAL
- 17. HORIZONTAL (TREND) ANALYSIS Type 1: Percentage changes from year-to-year Two steps: Compute dollar (or any currency)
- 18. Illustration: Amazon.com, Inc. Step 1 Compute the dollar amount of change from 2011 to 2012 Step
- 19. Illustration: Amazon.com, Inc. Comparative Consolidated Statements of Operations—Horizontal Analysis (partial exhibit)
- 20. Illustration: Amazon.com, Inc. Consolidated Balance Sheets—Horizontal Analysis (partial exhibit)
- 21. Illustration Prepare a horizontal analysis of the comparative income statements of Ama Music Co.
- 22. HORIZONTAL (TREND) ANALYSIS Type 2: Trend Percentages Base year selected and set equal to 100% Amount
- 23. HORIZONTAL (TREND) ANALYSIS Type2: Trend Percentages Amazon.com, Inc., showed income from operations as follows: Trend percentages
- 24. HORIZONTAL (TREND) ANALYSIS Type 3: Used to find an average growth (declining) rate and to find
- 25. HORIZONTAL (TREND) ANALYSIS Cogswell Cola’s Abbreviated Income Statements ($ in thousands)
- 26. VERTICAL ANALYSIS Shows relationship of a financial-statement item to its base Income statement, base is total
- 27. Illustration: Amazon.com, Inc. Comparative Consolidated Statements of Operations—Vertical Analysis (partial exhibit)
- 28. Illustration: Amazon.com, Inc. Consolidated Balance Sheets—Vertical Analysis (partial exhibit)
- 29. COMMON-SIZE FINANCIAL STATEMENTS Type of vertical analysis Report only percentages (no dollar amounts) Assists in the
- 30. Calculate the common-size percentages for the following income statement:
- 31. FINANCIAL RATIO ANALYSIS Financial ratios are relationships between different accounts from financial statements (due to this
- 32. FINANCIAL RATIO ANALYSIS Firm’s performance can be analyzed by using five key sets of financial ratios:
- 33. PROFITABILITY RATIOS
- 34. NET INCOME AS A % OF SALES (NET PROFIT MARGIN)
- 35. RETURN ON ASSETS (ROA)
- 37. RETURN ON EQUITY (ROE)
- 39. LIQUIDITY RATIOS / SHORT-TERM SOLVENCY RATIOS
- 40. CURRENT RATIO
- 41. QUICK RATIO OR ACID RATIO TEST
- 42. SOLVENCY RATIOS / FINANCIAL LEVERAGE RATIOS
- 43. FINANCIAL LEVERAGE RATIOS In the area of financial leverage, Company A is in a much better
- 45. ACTIVITY / ASSET MANAGEMENT RATIOS These ratios measure how efficiently a firm is using its assets
- 46. TOTAL ASSETS TURNOVER RATIO / MANAGEMENT EFFICIENCY RATIO
- 47. FIXED ASSET TURNOVER RATIO
- 48. INVENTORY TURNOVER
- 49. INVENTORY TURNOVER A lower inventory turnover ratio may be an indication of over-stocking which may pose
- 50. INVENTORY TURNOVER
- 51. INVENTORY TURNOVER A low turnover is usually a bad sign because products tend to deteriorate as
- 52. RECEIVABLE TURNOVER
- 53. RECEIVABLE TURNOVER Accounts receivable turnover measures the efficiency of a business in collecting its credit sales.
- 54. Example: Total sales of Company A during the year ended December 31, 2013 were $984,000. Customers
- 55. INVESTMENT VALUATION RATIOS / MARKET VALUE RATIOS Investment valuation ratios are used by investors to estimate
- 56. EARNINGS PER SHARE
- 57. PRICE PER EARNINGS (P/E) RATIO
- 58. PRICE / EARNING TO GROWTH RATIO (PEG RATIO)
- 59. PRICE / EARNING TO GROWTH RATIO (PEG RATIO) Example: Company A is currently trading with a
- 60. MARKET TO BOOK VALUE (PRICE TO BOOK RATIO)
- 61. To be useful, ratios should be analyzed over a period of years to consider all relevant
- 63. Скачать презентацию
 Фонд пенсионного и социального страхования Российской Федерации
 Особенности составления и представления Пояснительной записки в составе годовой бюджетной (бухгалтерской) отчетности за 2019 год
 Публічні доходи та публічні видатки
 Финансово-инновационный продукт ”FIRST”
 Ценовая политика предприятия
 Народный бюджет на территории муниципального образования Омутнинское городское поселение
 Декларування майна, набутого за договором фінансового лізингу
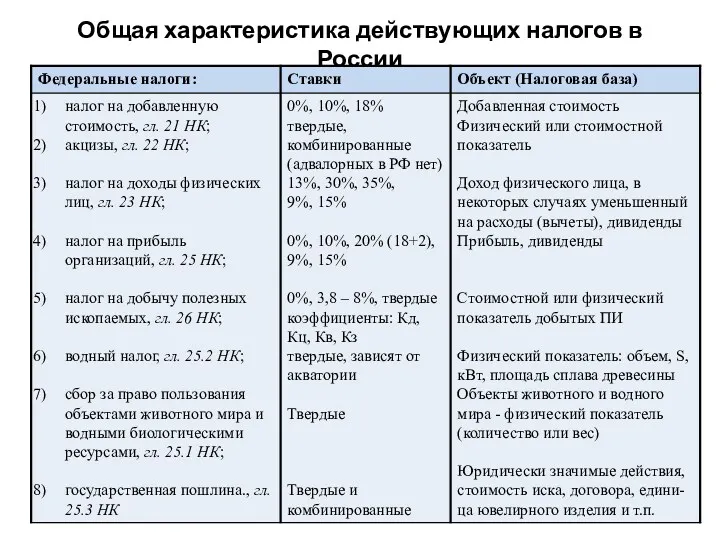 Общая характеристика действующих налогов в России
 Бюджетное ограничение потребителя
 Организационно- финансовые основы антикризисного управления Нормативная база оценки на признаки банкротства
 Платежный баланс
 Еңбек қарым-катынасы, нысандары және ҚР еңбекақыны төлеу жүйесі. Дәріхана ұйымындағы еңбек жене еңбекақы есебі
 Постоянный спутник деньги
 Ұзақ мерзімді активтердің операциялық аудиті
 Банковские продукты и услуги для компаний - контрагентов РУСАЛ
 20230320_modul_1.5._kakoy_kredit_brat
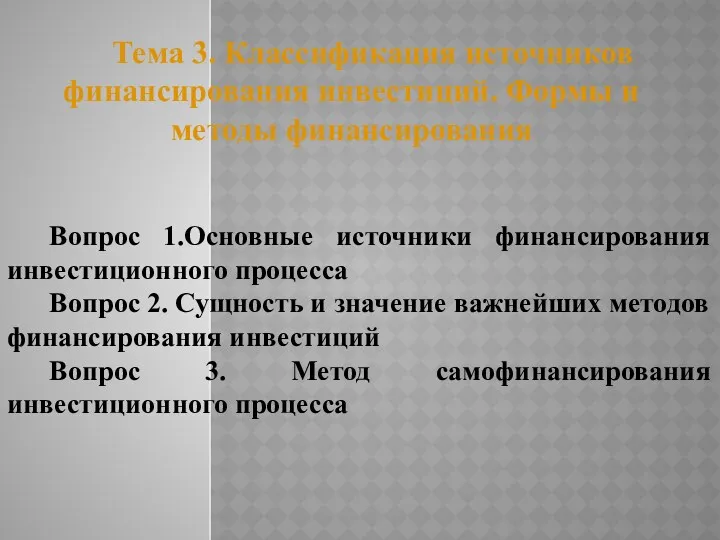 Классификация источников финансирования инвестиций. Формы и методы финансирования. Тема 3
 Заработная плата, гарантии, компенсации
 Инвестициялық климаттың
 Профессия бухгалтер
 Поведение участников финансового рынка
 Инвестициялық нарық
 Учет доходов и расходов при совмещении ОСНО и ЕНВД
 Деньги. Виды денег:
 Учёт основных средств производства
 Формирование карточек укрупненных закупок. Саратовская область
 Стандарты аудита. (Тема 4)
 Домашняя бухгалтерия