- Understanding options. Chapter 20. Principles of corporate finance

Содержание
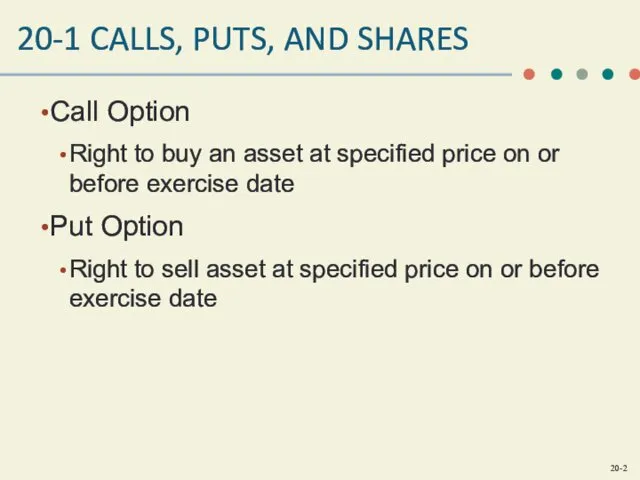
- 2. 20-1 CALLS, PUTS, AND SHARES Call Option Right to buy an asset at specified price on
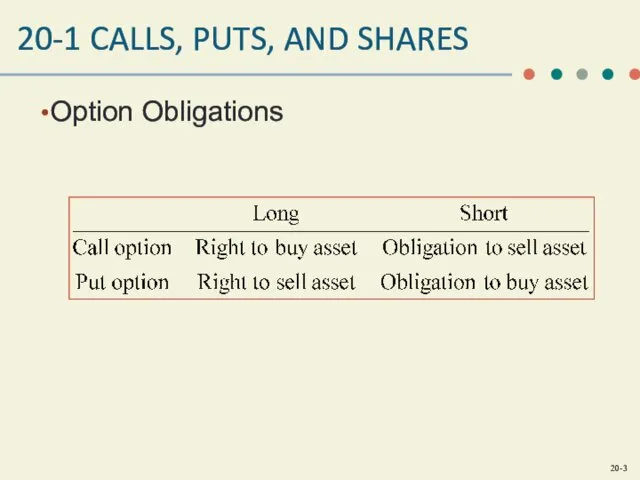
- 3. 20-1 CALLS, PUTS, AND SHARES Option Obligations
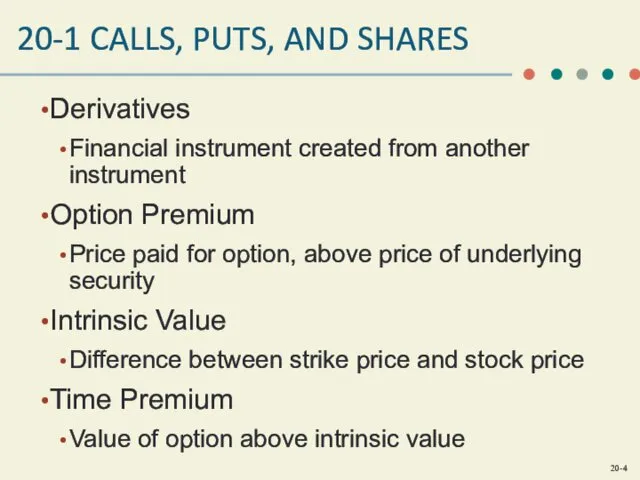
- 4. 20-1 CALLS, PUTS, AND SHARES Derivatives Financial instrument created from another instrument Option Premium Price paid
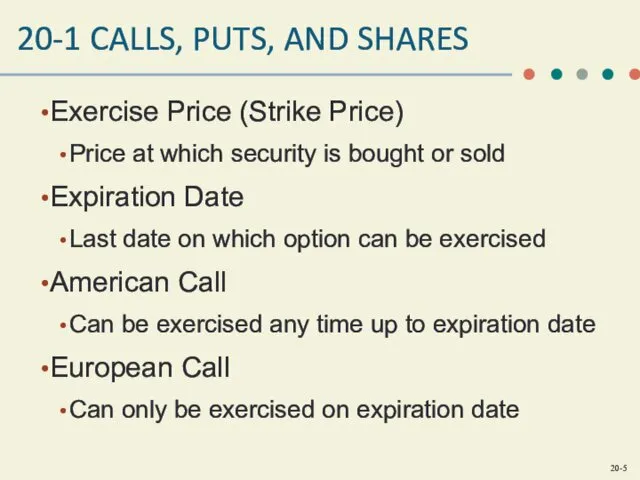
- 5. 20-1 CALLS, PUTS, AND SHARES Exercise Price (Strike Price) Price at which security is bought or
- 6. TABLE 20.1 OPTIONS ON APPLE STOCK, OCTOBER 2011
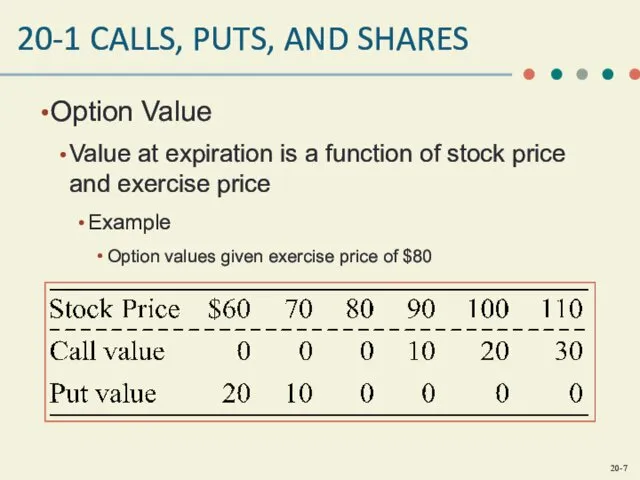
- 7. 20-1 CALLS, PUTS, AND SHARES Option Value Value at expiration is a function of stock price
- 8. FIGURE 20.1A APPLE POSITION DIAGRAM, CALL
- 9. FIGURE 20.1B APPLE POSITION DIAGRAM, PUT
- 10. FIGURE 20.2A PAYOFF TO SELLER OF APPLE CALL
- 11. FIGURE 20.2B PAYOFF TO SELLER OF APPLE PUT
- 12. FIGURE 20.3A PROFIT DIAGRAM FOR APPLE
- 13. FIGURE 20.3B PROFIT DIAGRAM FOR APPLE
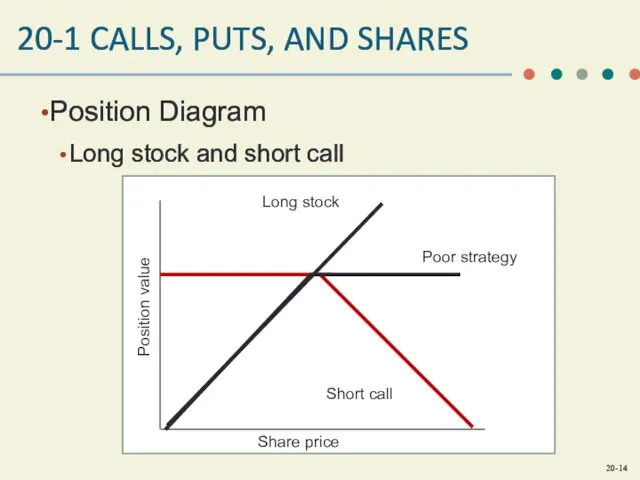
- 14. 20-1 CALLS, PUTS, AND SHARES Position Diagram Long stock and short call
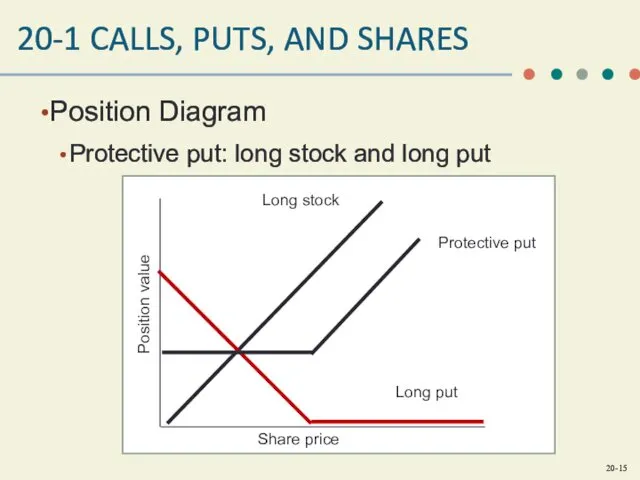
- 15. 20-1 CALLS, PUTS, AND SHARES Position Diagram Protective put: long stock and long put
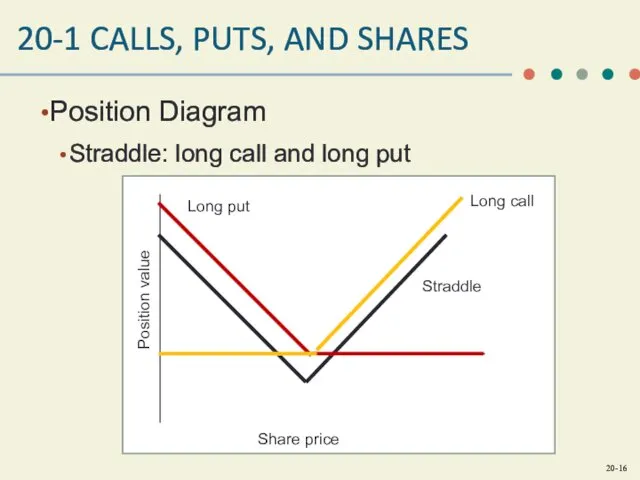
- 16. 20-1 CALLS, PUTS, AND SHARES Position Diagram Straddle: long call and long put
- 17. FIGURE 20.4 SIX-MONTH PAYOFF OPTIONS, APPLE
- 18. FIGURE 20.5 OPTIONS
- 19. FIGURE 20.6 PROTECTION STRATEGIES
- 20. FIGURE 20.7 CALL TO PUT
- 21. FIGURE 20.8 TICKET PAYOFF
- 22. FIGURE 20.9 CALL PURCHASE AND SALE
- 23. 20-3 WHAT DETERMINES OPTION VALUES? Components of Option Price Underlying stock price = Ps Striking or
- 24. TIME DECAY CHART Option price decreases, all other things equal, as time to expiration decreases
- 25. 20-3 WHAT DETERMINES OPTION VALUES?
- 26. FIGURE 20.10 VALUE OF CALL BEFORE EXPIRATION DATE
- 27. FIGURE 20.11 CALL OPTIONS, FIRMS X AND Y In each case, current share price equals exercise
- 28. FIGURE 20.12 APPLE CALL OPTION VALUE VERSUS STOCK PRICE
- 29. TABLE 20.2 DETERMINANTS OF CALL PRICE
- 31. Скачать презентацию
20-1 CALLS, PUTS, AND SHARES
Call Option
Right to buy an asset at
20-1 CALLS, PUTS, AND SHARES
Call Option
Right to buy an asset at
20-1 CALLS, PUTS, AND SHARES
Option Obligations
20-1 CALLS, PUTS, AND SHARES
Option Obligations
20-1 CALLS, PUTS, AND SHARES
Derivatives
Financial instrument created from another instrument
Option Premium
Price
20-1 CALLS, PUTS, AND SHARES
Derivatives
Financial instrument created from another instrument
Option Premium
Price
20-1 CALLS, PUTS, AND SHARES
Exercise Price (Strike Price)
Price at which security
20-1 CALLS, PUTS, AND SHARES
Exercise Price (Strike Price)
Price at which security
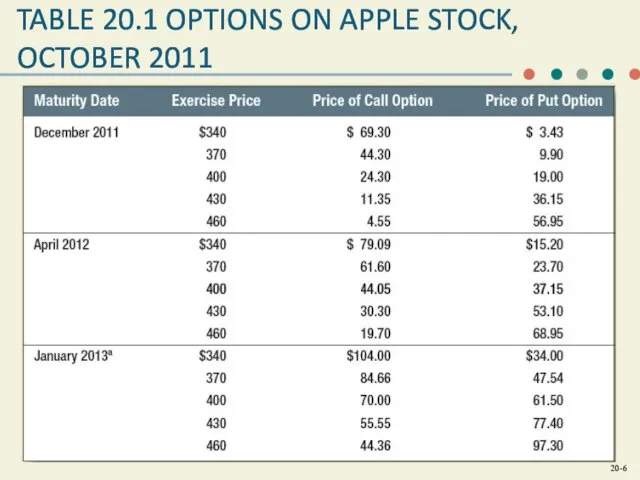
TABLE 20.1 OPTIONS ON APPLE STOCK, OCTOBER 2011
TABLE 20.1 OPTIONS ON APPLE STOCK, OCTOBER 2011
20-1 CALLS, PUTS, AND SHARES
Option Value
Value at expiration is a function
20-1 CALLS, PUTS, AND SHARES
Option Value
Value at expiration is a function
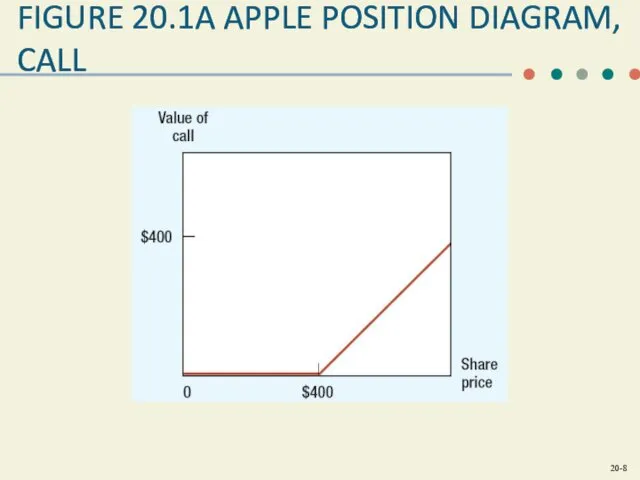
FIGURE 20.1A APPLE POSITION DIAGRAM, CALL
FIGURE 20.1A APPLE POSITION DIAGRAM, CALL
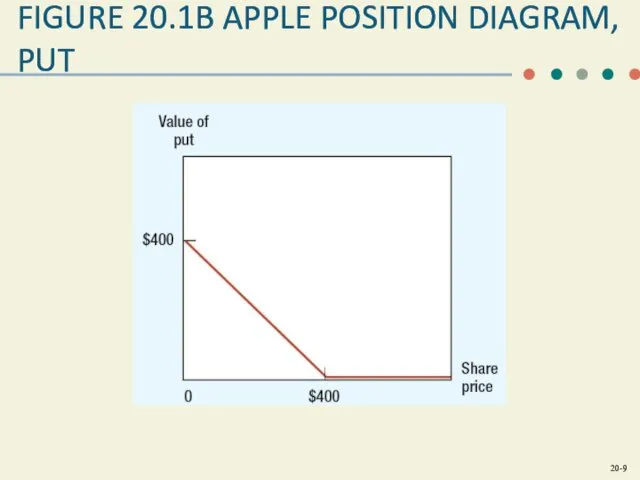
FIGURE 20.1B APPLE POSITION DIAGRAM, PUT
FIGURE 20.1B APPLE POSITION DIAGRAM, PUT
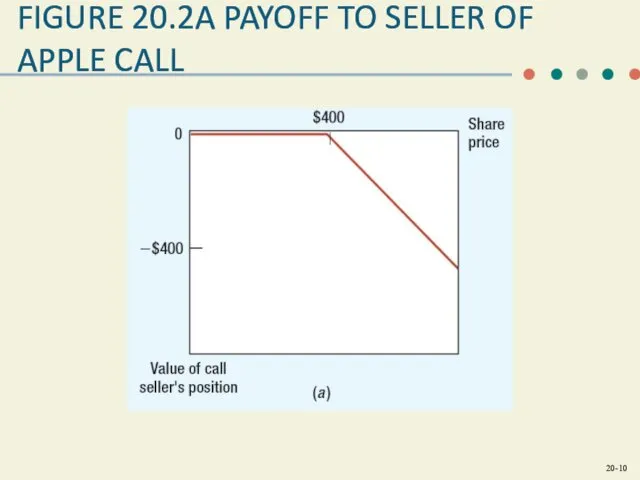
FIGURE 20.2A PAYOFF TO SELLER OF APPLE CALL
FIGURE 20.2A PAYOFF TO SELLER OF APPLE CALL
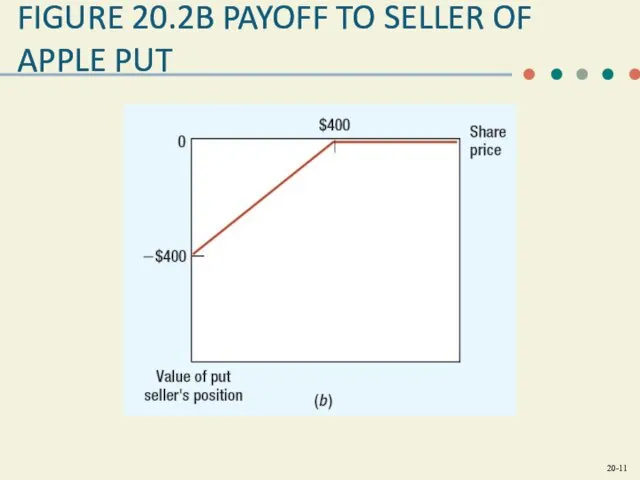
FIGURE 20.2B PAYOFF TO SELLER OF APPLE PUT
FIGURE 20.2B PAYOFF TO SELLER OF APPLE PUT
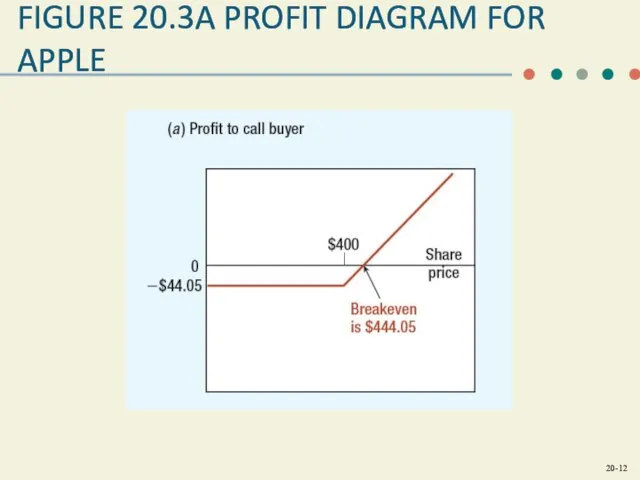
FIGURE 20.3A PROFIT DIAGRAM FOR APPLE
FIGURE 20.3A PROFIT DIAGRAM FOR APPLE
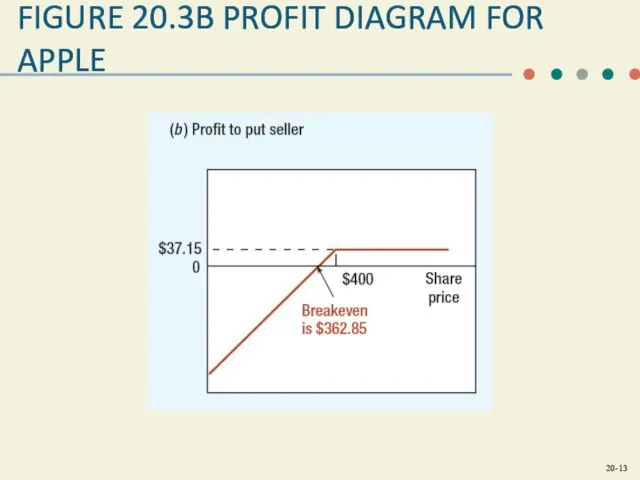
FIGURE 20.3B PROFIT DIAGRAM FOR APPLE
FIGURE 20.3B PROFIT DIAGRAM FOR APPLE
20-1 CALLS, PUTS, AND SHARES
Position Diagram
Long stock and short call
20-1 CALLS, PUTS, AND SHARES
Position Diagram
Long stock and short call
20-1 CALLS, PUTS, AND SHARES
Position Diagram
Protective put: long stock and long
20-1 CALLS, PUTS, AND SHARES
Position Diagram
Protective put: long stock and long
20-1 CALLS, PUTS, AND SHARES
Position Diagram
Straddle: long call and long put
20-1 CALLS, PUTS, AND SHARES
Position Diagram
Straddle: long call and long put
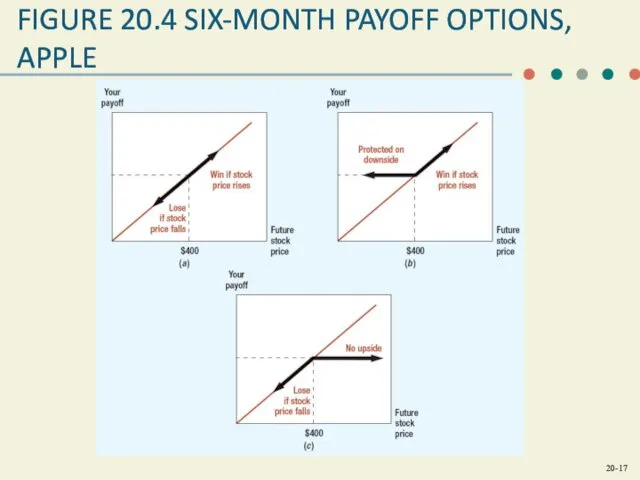
FIGURE 20.4 SIX-MONTH PAYOFF OPTIONS, APPLE
FIGURE 20.4 SIX-MONTH PAYOFF OPTIONS, APPLE
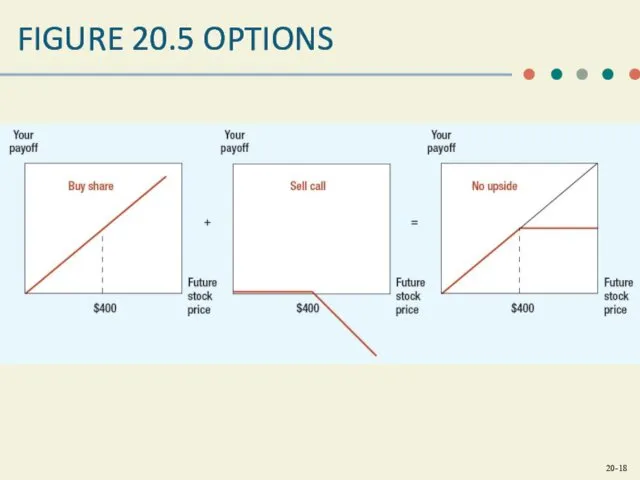
FIGURE 20.5 OPTIONS
FIGURE 20.5 OPTIONS
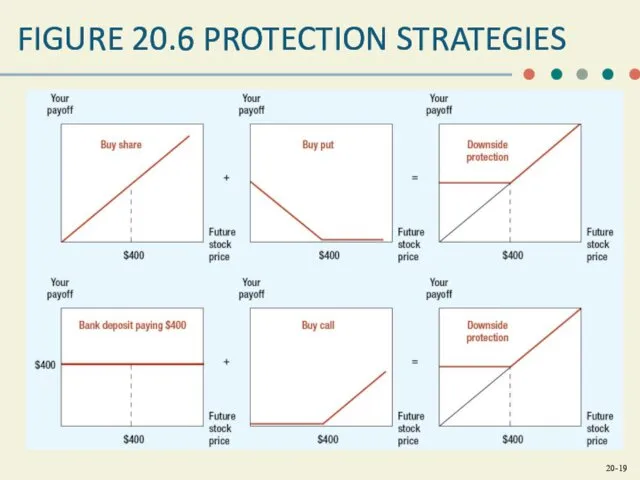
FIGURE 20.6 PROTECTION STRATEGIES
FIGURE 20.6 PROTECTION STRATEGIES
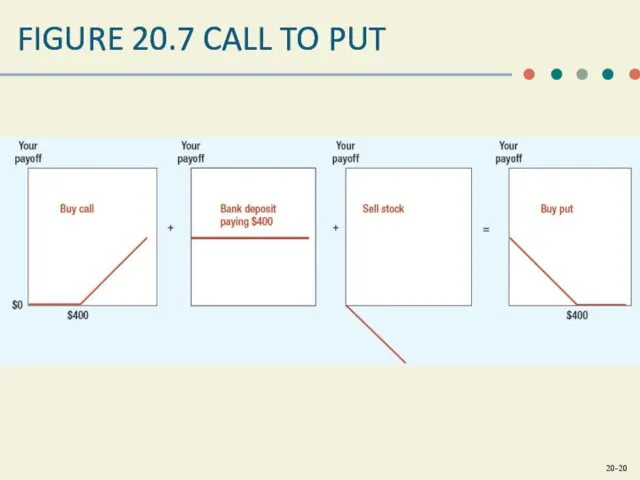
FIGURE 20.7 CALL TO PUT
FIGURE 20.7 CALL TO PUT
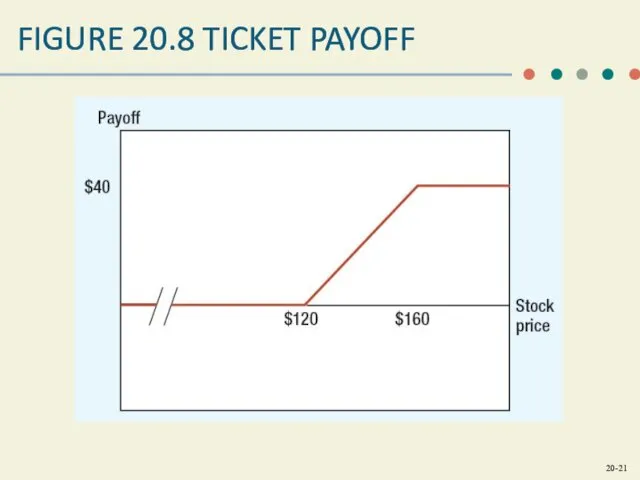
FIGURE 20.8 TICKET PAYOFF
FIGURE 20.8 TICKET PAYOFF
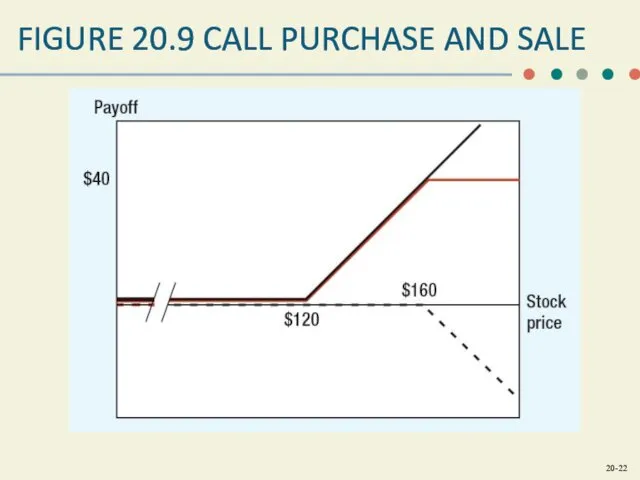
FIGURE 20.9 CALL PURCHASE AND SALE
FIGURE 20.9 CALL PURCHASE AND SALE
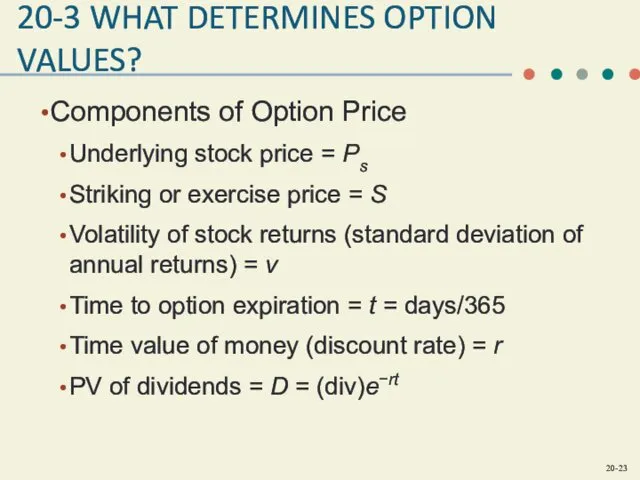
20-3 WHAT DETERMINES OPTION VALUES?
Components of Option Price
Underlying stock price =
20-3 WHAT DETERMINES OPTION VALUES?
Components of Option Price
Underlying stock price =
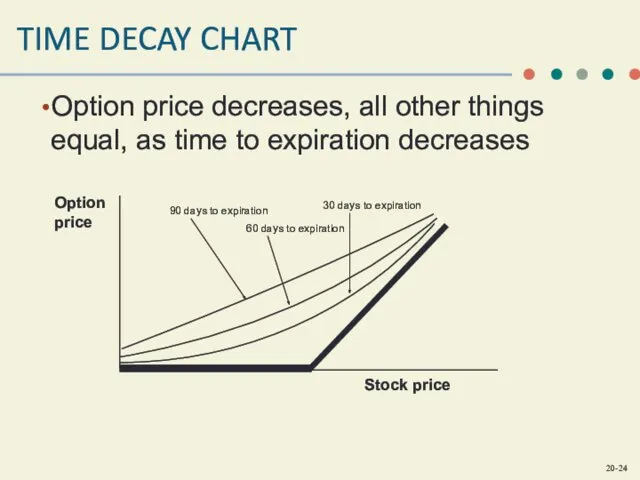
TIME DECAY CHART
Option price decreases, all other things equal, as time
TIME DECAY CHART
Option price decreases, all other things equal, as time
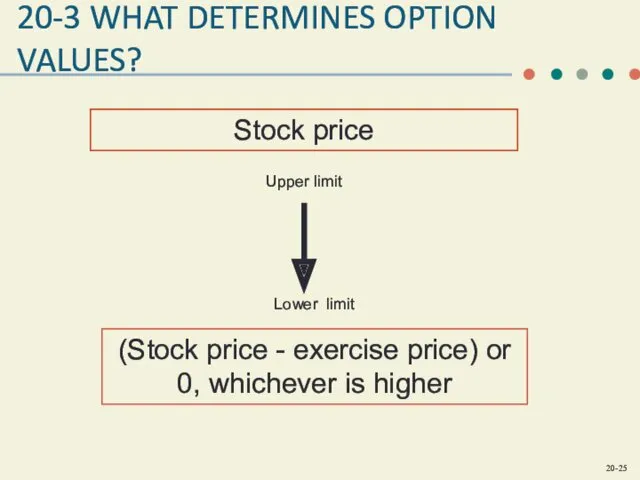
20-3 WHAT DETERMINES OPTION VALUES?
20-3 WHAT DETERMINES OPTION VALUES?
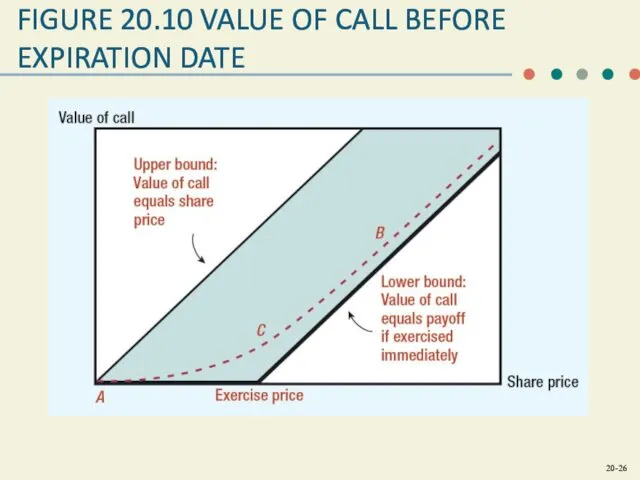
FIGURE 20.10 VALUE OF CALL BEFORE EXPIRATION DATE
FIGURE 20.10 VALUE OF CALL BEFORE EXPIRATION DATE
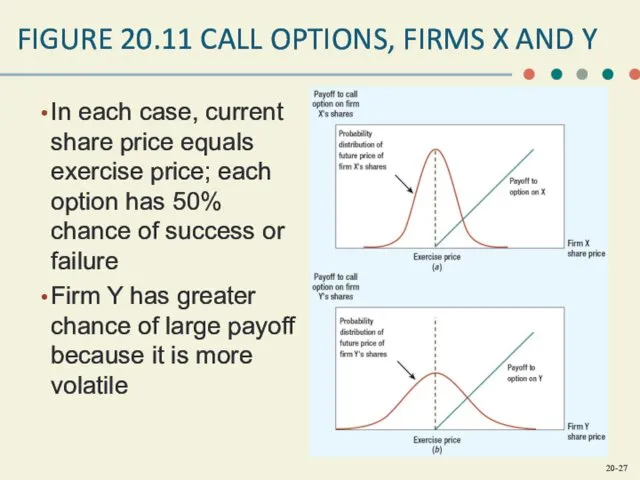
FIGURE 20.11 CALL OPTIONS, FIRMS X AND Y
In each case,
FIGURE 20.11 CALL OPTIONS, FIRMS X AND Y
In each case,
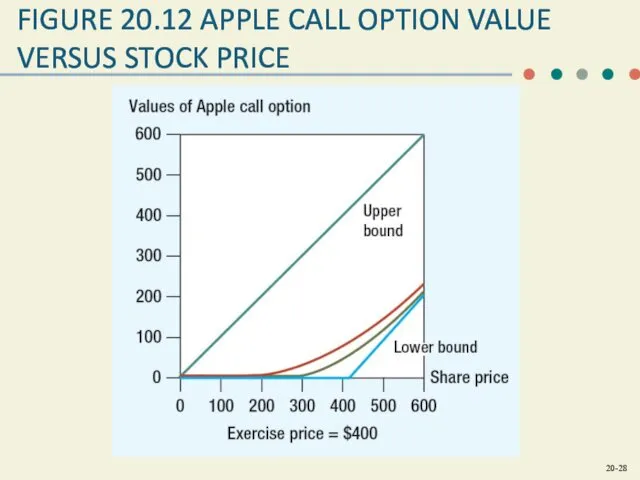
FIGURE 20.12 APPLE CALL OPTION VALUE VERSUS STOCK PRICE
FIGURE 20.12 APPLE CALL OPTION VALUE VERSUS STOCK PRICE
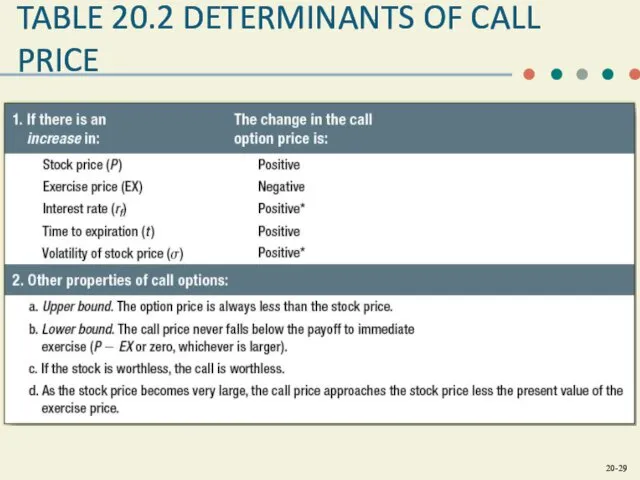
TABLE 20.2 DETERMINANTS OF CALL PRICE
TABLE 20.2 DETERMINANTS OF CALL PRICE
 Страхование урожая с государственной поддержкой
 Риск-менеджмент
 Казначейське обслуговування державного боргу. Організація контролю в системі казначейства
 Cекреты бухгалтерского и финансового учета в НКО
 Операции банка с драгоценными металлами. Управление золото-валютными резервами
 Анализ портфеля акций
 Описание земельного участка кинотеатр Победа. Кадастровая стоимость
 Решение финансового кейса, разработанное командой Акулы бизнеса
 Карта рассрочки Халва
 Возможные источники финансирования СО НКО
 Финансово-хозяйственная деятельность МКП ПАТП-4, г. Новосибирск
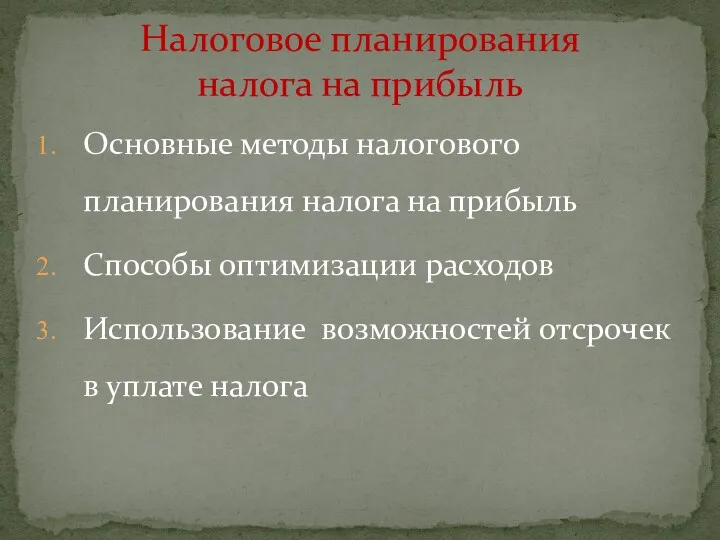 Налоговое планирование налога на прибыль
 История возникновения денег
 Банковский вклад. Банковский счет
 Налоги - обязательные платежи физических и юридических лиц государству
 Видатковий касовий ордер
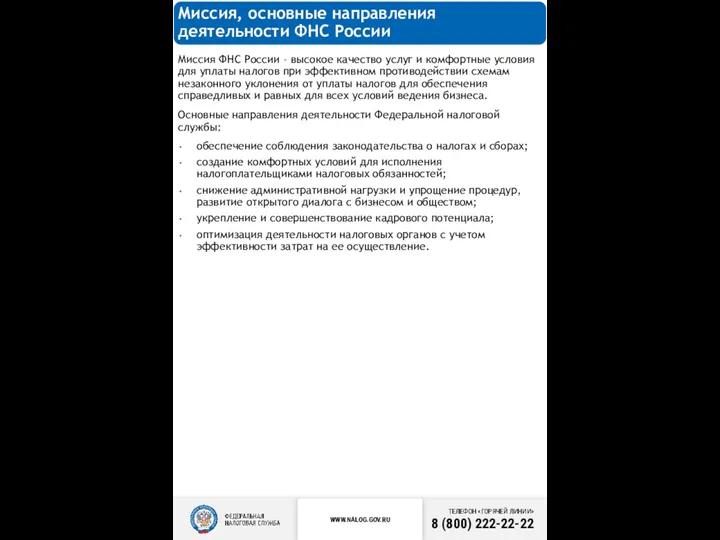 Миссия, основные направления деятельности ФНС России
 Финансовые инновации. Краудинвестинг и налоговые гавани
 Рынок ценных бумаг
 Финансовый продукт Vista
 Эквайринг – как элемент маркетинга 2023 год
 Бухгалтерский баланс в анализе финансового результата предприятия и его улучшение в ОАО ПНППК
 Города России на банкнотах разного достоинства
 Бюджетное право
 Аудит финансовых результатов
 Современное состояние рынка МФО
 Сущность и функции финансов, их роль в системе денежных отношений
 Валовый доход и прибыль