- Periodic Table and Trends

Содержание
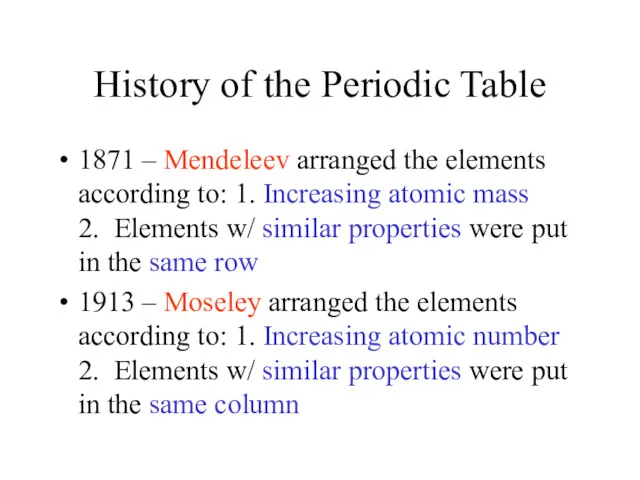
- 2. History of the Periodic Table 1871 – Mendeleev arranged the elements according to: 1. Increasing atomic
- 3. Group Names
- 4. S & P block – Representative Elements Metalloids (Semimetals, Semiconductors) – B,Si, Ge, As, Sb, Te
- 5. Periodic Groups Elements in the same column have similar chemical and physical properties These similarities are
- 6. Periodic Trends Periodic Trends – patterns (don’t always hold true) can be seen with our current
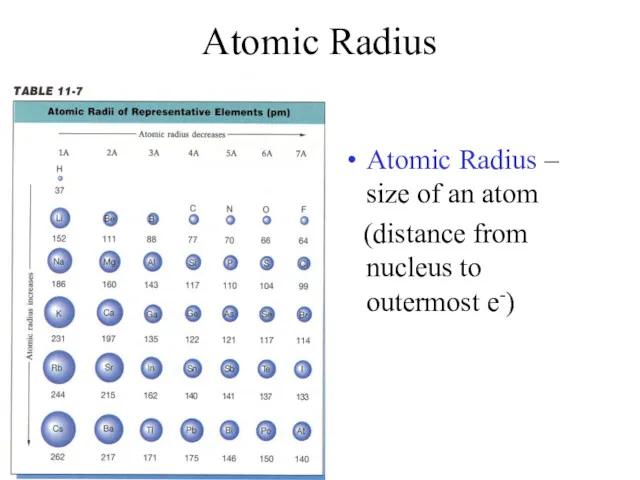
- 7. Atomic Radius Atomic Radius – size of an atom (distance from nucleus to outermost e-)
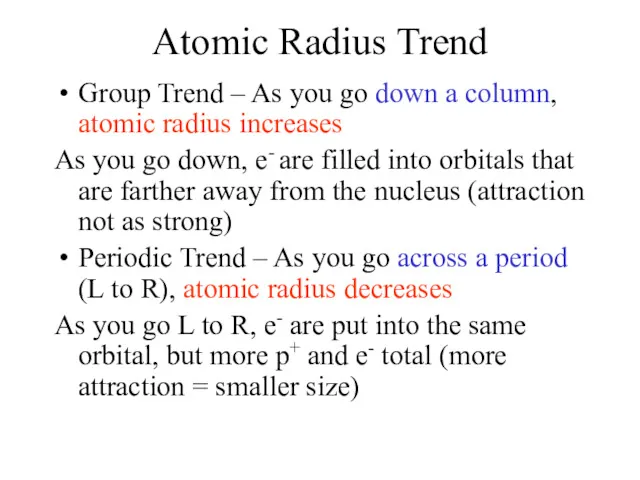
- 8. Atomic Radius Trend Group Trend – As you go down a column, atomic radius increases As
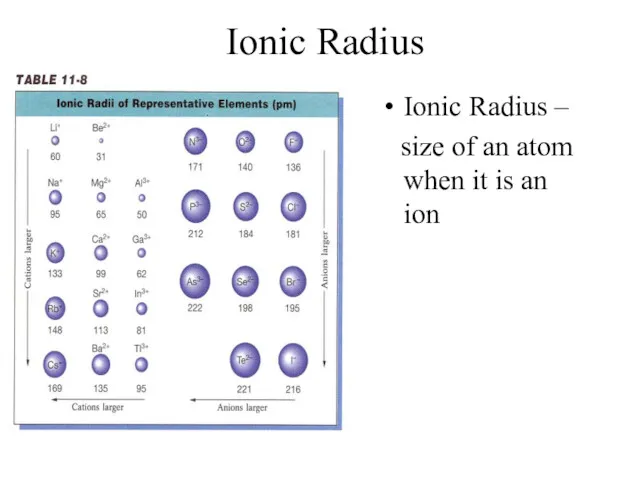
- 9. Ionic Radius Ionic Radius – size of an atom when it is an ion
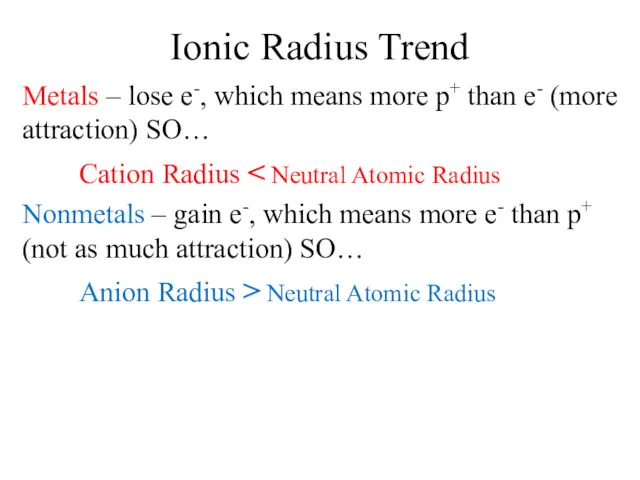
- 10. Ionic Radius Trend Metals – lose e-, which means more p+ than e- (more attraction) SO…
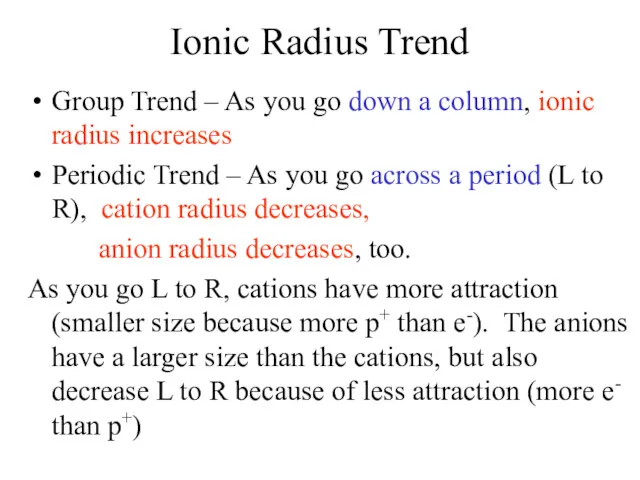
- 11. Ionic Radius Trend Group Trend – As you go down a column, ionic radius increases Periodic
- 12. Ionic Radius
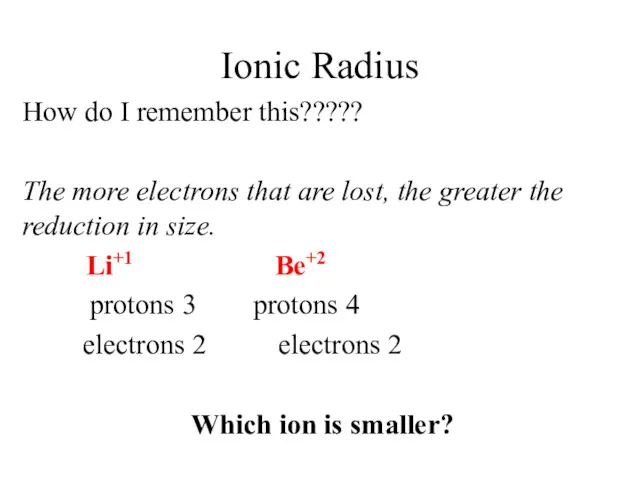
- 13. Ionic Radius How do I remember this????? The more electrons that are lost, the greater the
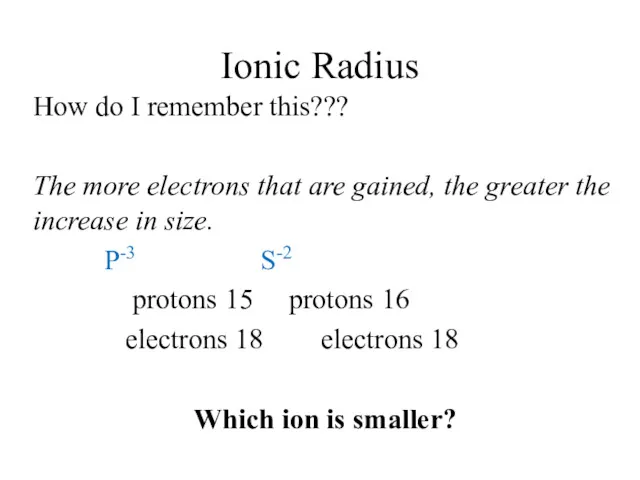
- 14. Ionic Radius How do I remember this??? The more electrons that are gained, the greater the
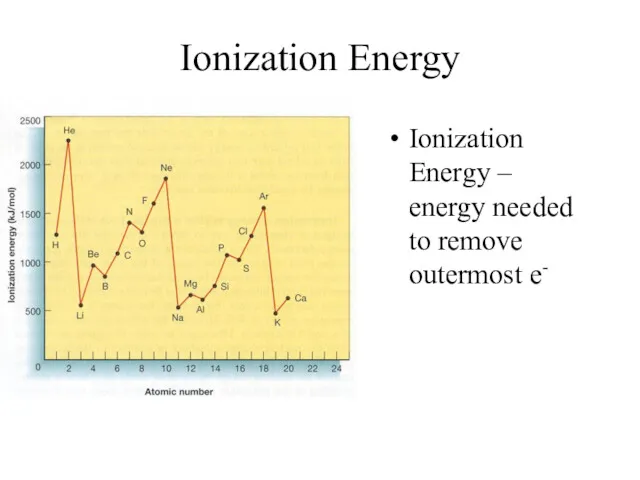
- 15. Ionization Energy Ionization Energy – energy needed to remove outermost e-
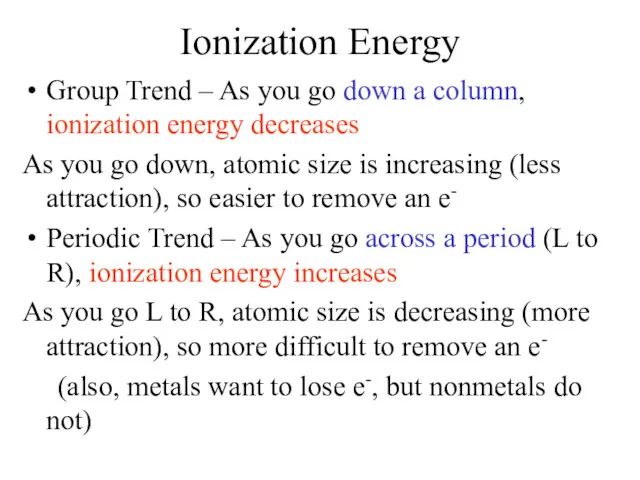
- 16. Ionization Energy Group Trend – As you go down a column, ionization energy decreases As you
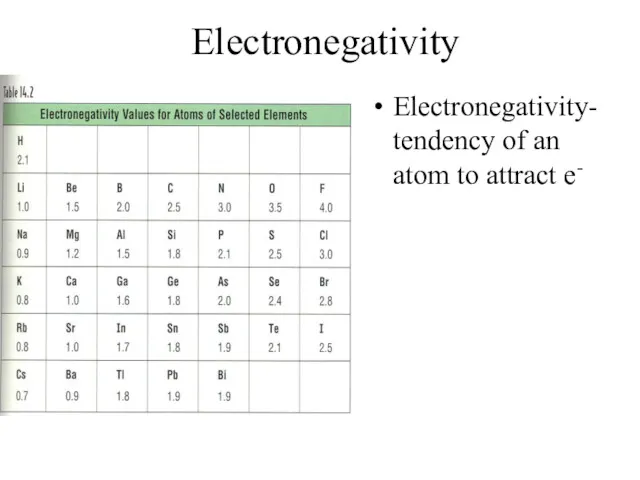
- 17. Electronegativity Electronegativity- tendency of an atom to attract e-
- 18. Electronegativity Trend Group Trend – As you go down a column, electronegativity decreases As you go
- 19. Reactivity Reactivity – tendency of an atom to react Metals – lose e- when they react,
- 21. Скачать презентацию
History of the Periodic Table
1871 – Mendeleev arranged the elements according
History of the Periodic Table
1871 – Mendeleev arranged the elements according
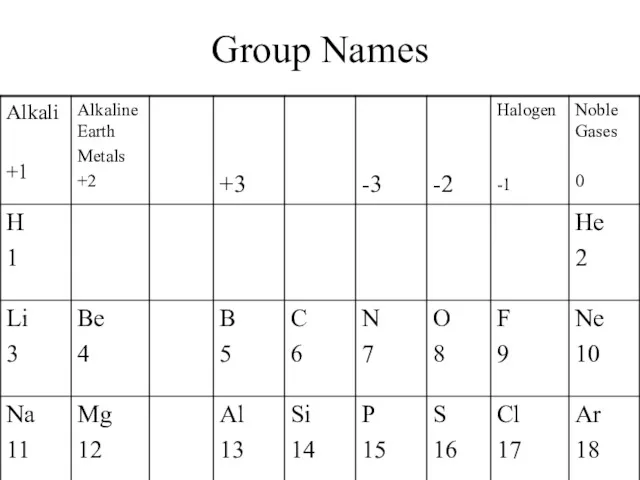
Group Names
Group Names
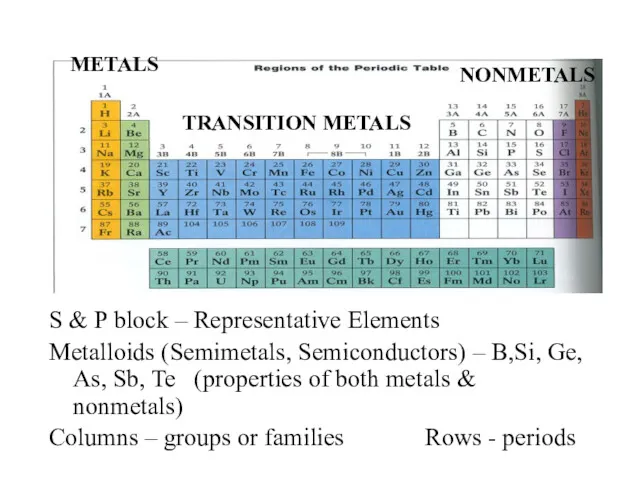
S & P block – Representative Elements
Metalloids (Semimetals, Semiconductors) – B,Si,
S & P block – Representative Elements
Metalloids (Semimetals, Semiconductors) – B,Si,
Periodic Groups
Elements in the same column have similar chemical and physical
Periodic Groups
Elements in the same column have similar chemical and physical
Periodic Trends
Periodic Trends – patterns (don’t always hold true) can be
Periodic Trends
Periodic Trends – patterns (don’t always hold true) can be
Atomic Radius
Atomic Radius – size of an atom
(distance from
Atomic Radius
Atomic Radius – size of an atom
(distance from
Atomic Radius Trend
Group Trend – As you go down a column,
Atomic Radius Trend
Group Trend – As you go down a column,
Ionic Radius
Ionic Radius –
size of an atom when it
Ionic Radius
Ionic Radius –
size of an atom when it
Ionic Radius Trend
Metals – lose e-, which means more p+ than
Ionic Radius Trend
Metals – lose e-, which means more p+ than
Ionic Radius Trend
Group Trend – As you go down a column,
Ionic Radius Trend
Group Trend – As you go down a column,
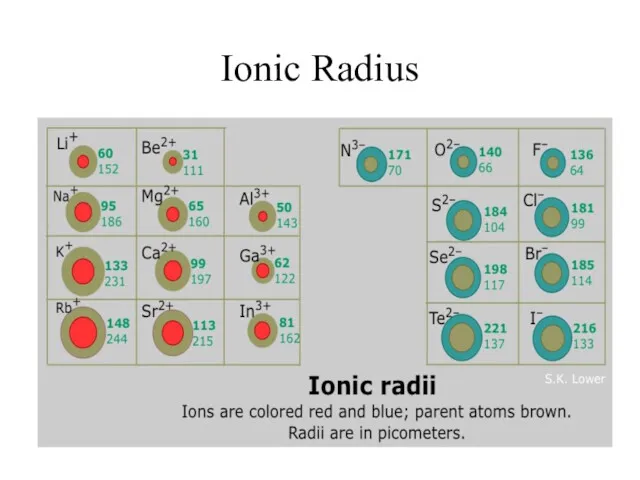
Ionic Radius
Ionic Radius
Ionic Radius
How do I remember this?????
The more electrons that are lost,
Ionic Radius
How do I remember this?????
The more electrons that are lost,
Ionic Radius
How do I remember this???
The more electrons that are gained,
Ionic Radius
How do I remember this???
The more electrons that are gained,
Ionization Energy
Ionization Energy – energy needed to remove outermost e-
Ionization Energy
Ionization Energy – energy needed to remove outermost e-
Ionization Energy
Group Trend – As you go down a column, ionization
Ionization Energy
Group Trend – As you go down a column, ionization
Electronegativity
Electronegativity- tendency of an atom to attract e-
Electronegativity
Electronegativity- tendency of an atom to attract e-
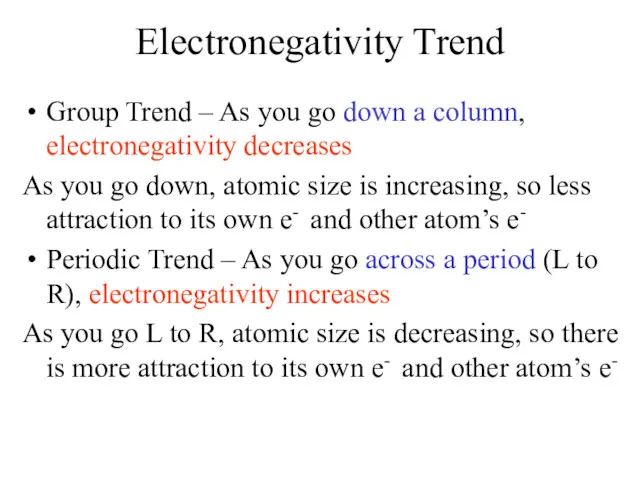
Electronegativity Trend
Group Trend – As you go down a column, electronegativity
Electronegativity Trend
Group Trend – As you go down a column, electronegativity
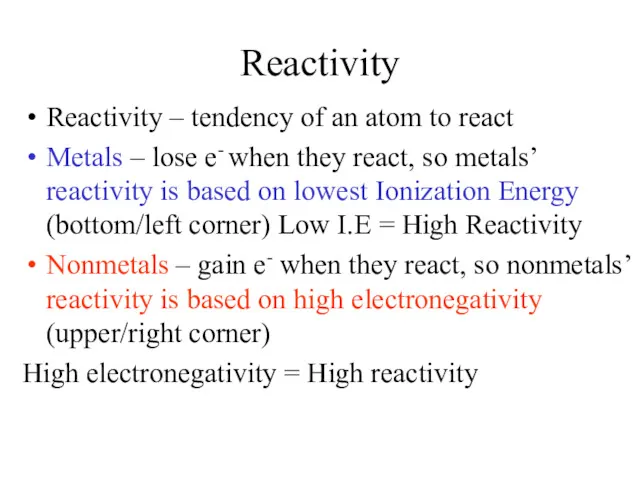
Reactivity
Reactivity – tendency of an atom to react
Metals – lose e-
Reactivity
Reactivity – tendency of an atom to react
Metals – lose e-
 Строение атома в соответствии с положением в периодической системе химических элементов Д.И. Менделеева
 Алкадиены (диены, диеновые углеводороды)
 Алканы в природе
 Алкадиены. Общая формула алкадиенов CnH2n -2
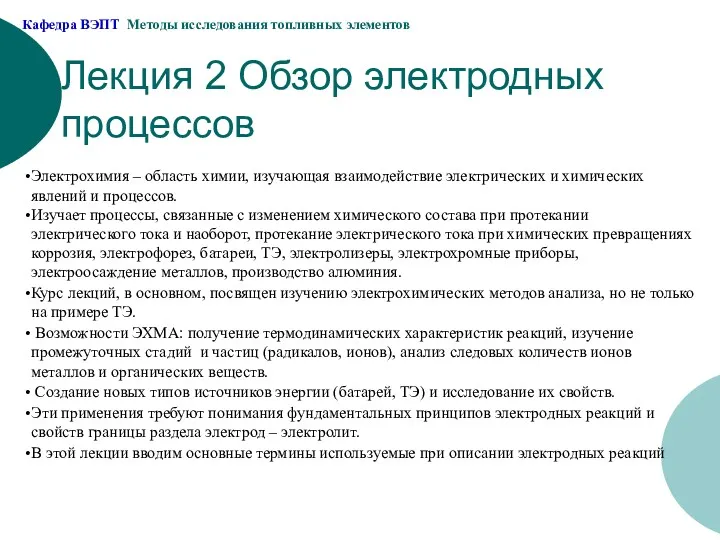 Обзор электродных процессов
 Водород, получение, свойства и применение
 Предмет органической химии. Органические вещества
 Нуклеиновые кислоты
 Получение пресной и чистой воды
 Анализ проб воды
 Виды изомерии в органической химии
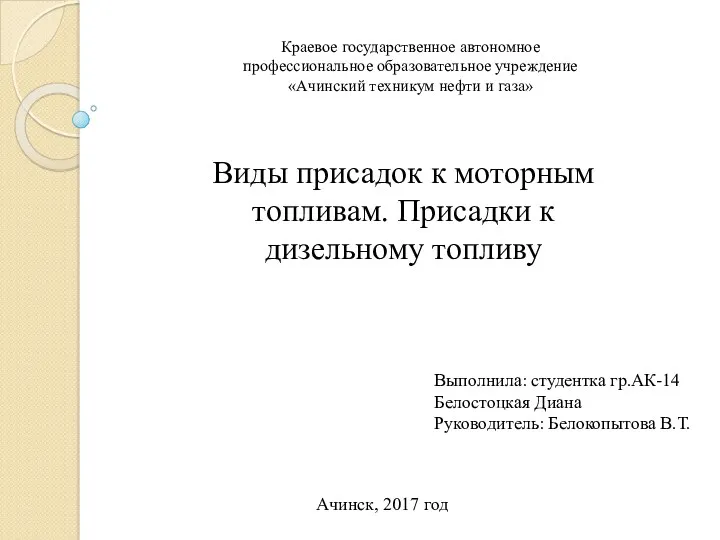 Виды присадок к моторным топливам. Присадки к дизельному топливу
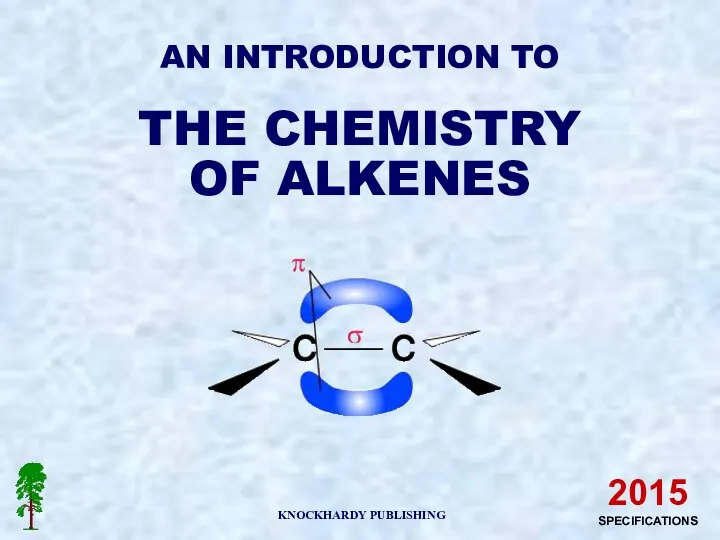 An introduction to the chemistry of alkenes
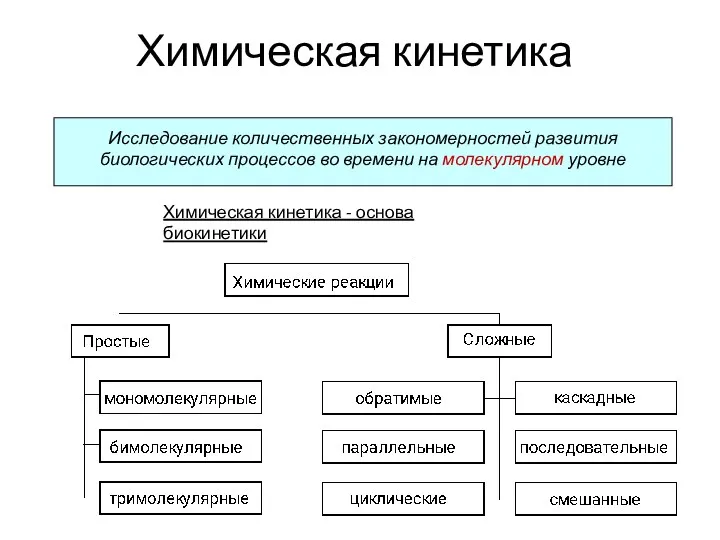 Химическая кинетика
 Периодическая система химических элементов. Знаки химических элементов
 Застосування алканів
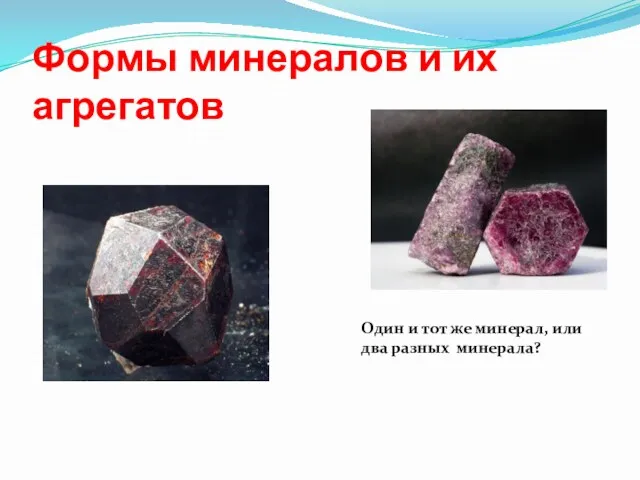 Формы минералов и их агрегатов
 Основы коррозии и защиты металлов. Химическая коррозия
 Процессы и аппараты химических производств
 Тема 10- Гетроциклические соединения
 Метод МО
 Металлы в нашей жизни
 Основные электрохимические процессы
 Химия в быту
 Электрохимические процессы. Лекция 7
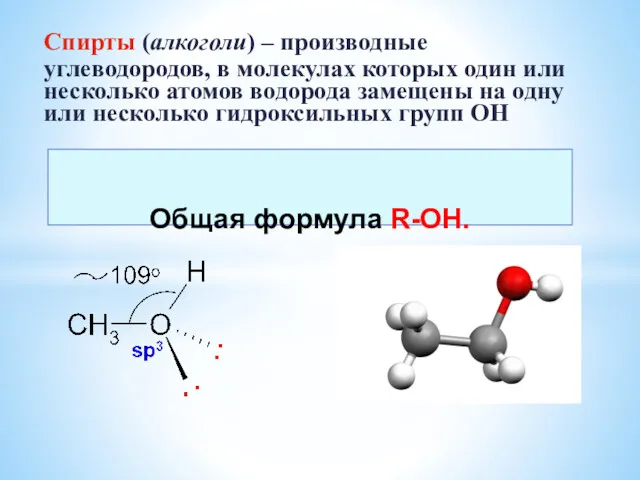 Спирты. Многоатомные спирты
 Азот: кислородные соединения. Особенности химии фосфора и элементов его подгруппы
 Алюминий және оның қосылыстары