Partnership System ZORAN as Artificial Intelligence system (first part - practical importance and offers to cooperation) презентация
- Partnership System ZORAN as Artificial Intelligence system (first part - practical importance and offers to cooperation)

Содержание
- 2. 07/28/2023 Partnership System ZORAN as Artificial Intelligence system (first part - practical importance and offers to
- 3. 07/28/2023 Partnership System ZORAN as Artificial Intelligence system (first part - practical importance and offers to
- 4. 07/28/2023 Partnership System ZORAN as Artificial Intelligence system (first part - practical importance and offers to
- 5. 07/28/2023 Partnership System ZORAN as Artificial Intelligence system (first part - practical importance and offers to
- 6. 07/28/2023 Partnership System ZORAN as Artificial Intelligence system (first part - practical importance and offers to
- 7. 07/28/2023 Partnership System ZORAN as Artificial Intelligence system (first part - practical importance and offers to
- 8. 07/28/2023 Partnership System ZORAN as Artificial Intelligence system (first part - practical importance and offers to
- 9. 07/28/2023 Partnership System ZORAN as Artificial Intelligence system (first part - practical importance and offers to
- 10. 10. Partnership System ZORAN Is the best universal tool for exclusive fiscal, budgetary, business and investment
- 11. 11. Main difference! The main difference of Partnership System ZORAN in comparison with any other computer
- 12. 12. Response to skeptics They consider always during many years, that there are a great number
- 13. 13. In what item, however, skeptics may be right – rough analogies can be find out
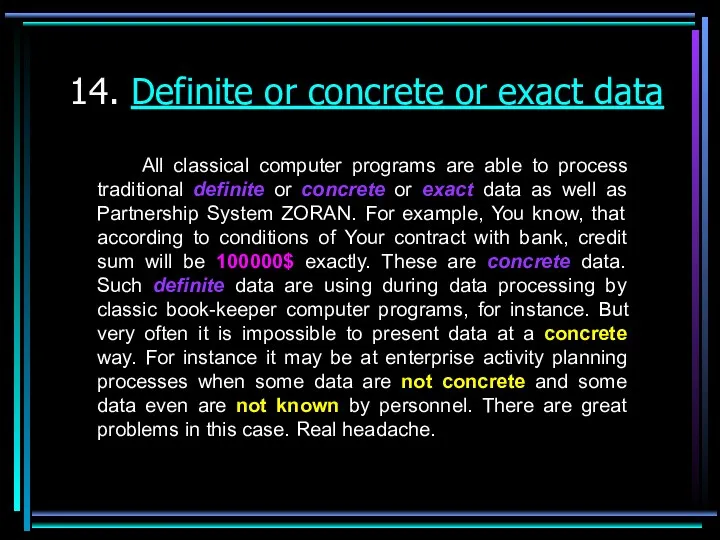
- 14. 14. Definite or concrete or exact data All classical computer programs are able to process traditional
- 15. 15. Limit of possibilities for exact calculations (introduction) On next pictures the maximum possible result is
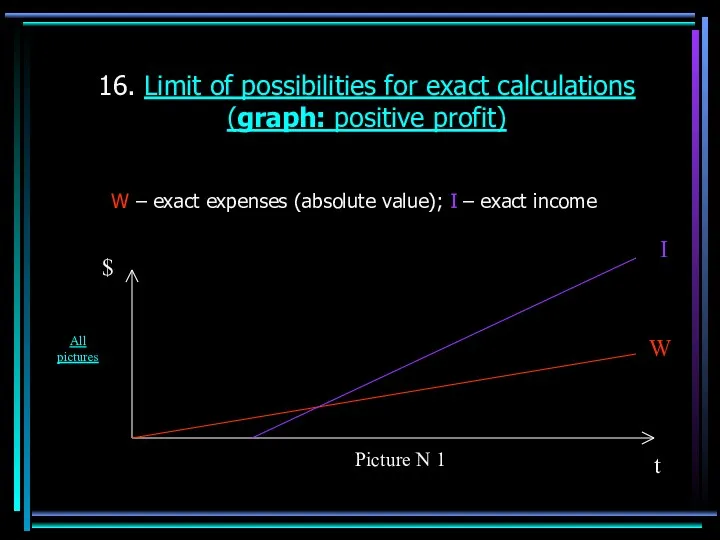
- 16. 16. Limit of possibilities for exact calculations (graph: positive profit) W – exact expenses (absolute value);
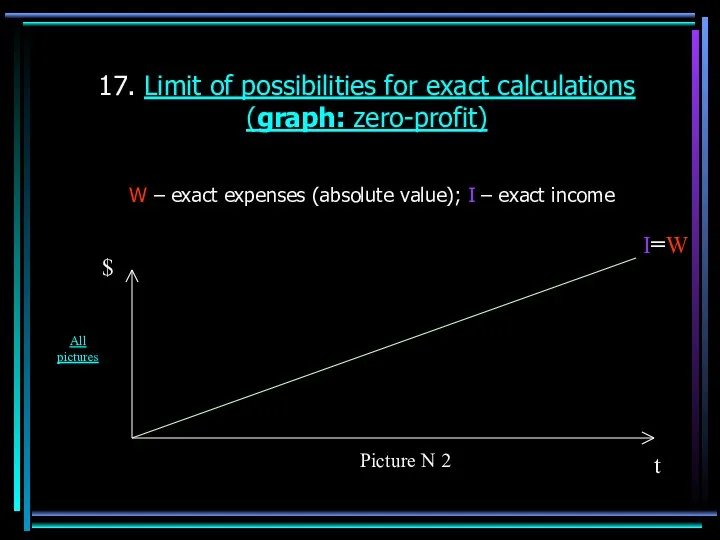
- 17. 17. Limit of possibilities for exact calculations (graph: zero-profit) W – exact expenses (absolute value); I
- 18. 18. Limit of possibilities for exact calculations (graph: negative profit) W – exact expenses (absolute value);
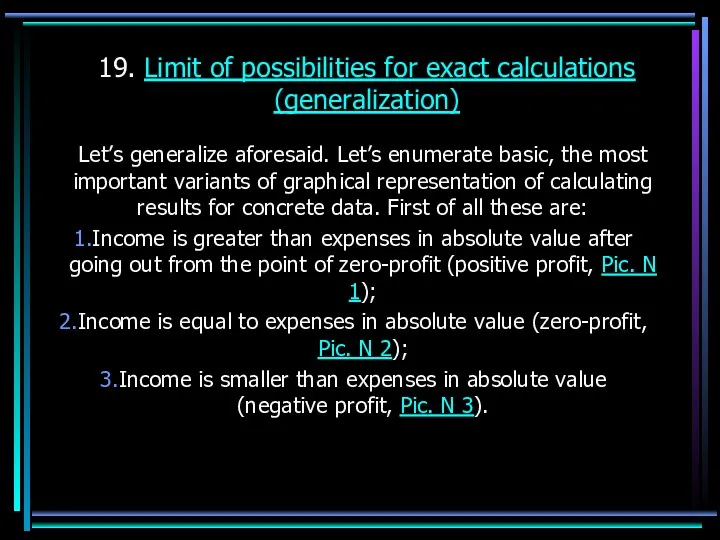
- 19. 19. Limit of possibilities for exact calculations (generalization) Let’s generalize aforesaid. Let’s enumerate basic, the most
- 20. 20. But this is not catastrophic situation! To get over possibility limitation for exact calculations Your
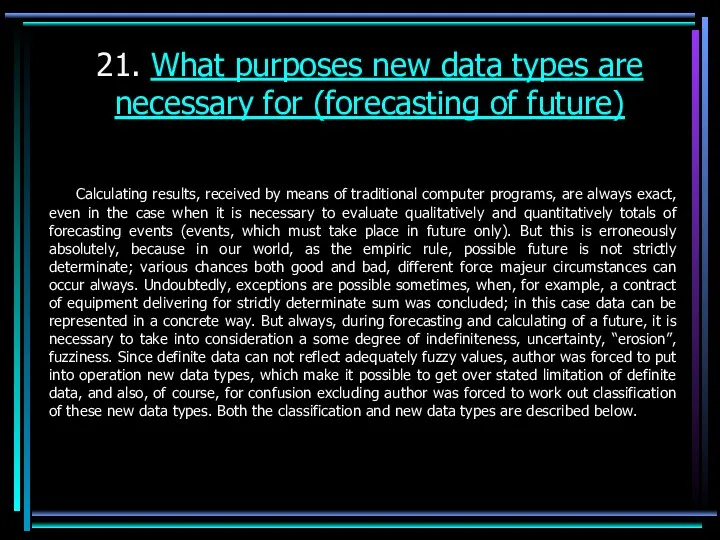
- 21. 21. What purposes new data types are necessary for (forecasting of future) Calculating results, received by
- 22. 22. Fuzzy or not concrete data At first, these are fuzzy or not concrete data. For
- 23. 23. Co-using of definite and fuzzy data Thus, usefulness of fuzzy data using for prognosis purposes
- 24. 24. What purposes new data types are necessary for (analyzing and evaluation of a past) As
- 25. 25. How to get over possibility limitation for exact calculations Next slides show clearly (with explanations)
- 26. 26. Business project is absolutely profitable (introduction: income and expenses are fuzzy) Next picture demonstrates the
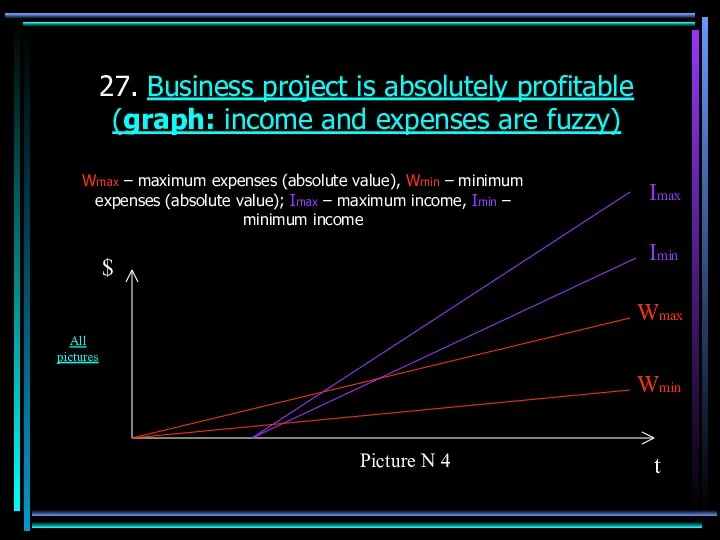
- 27. 27. Business project is absolutely profitable (graph: income and expenses are fuzzy) Wmax – maximum expenses
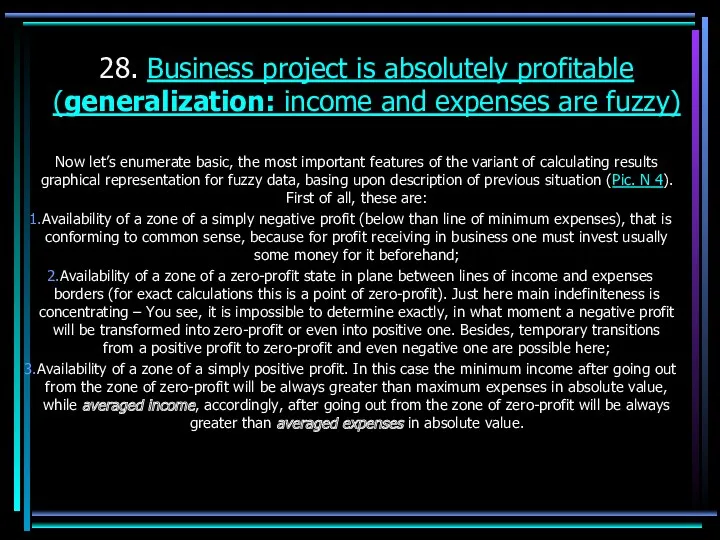
- 28. 28. Business project is absolutely profitable (generalization: income and expenses are fuzzy) Now let’s enumerate basic,
- 29. 29. Business project is absolutely profitable (introduction, generalization: income and expenses are fuzzy, variants of graphs)
- 30. 30. Business project is absolutely profitable (graph: income and expenses are fuzzy, variant N 1) Wmax
- 31. 31. Business project is absolutely profitable (graph: income and expenses are fuzzy, variant N 2) Wmax
- 32. 32. Business project is absolutely profitable (graph: income and expenses are fuzzy, variant N 3) Wmax
- 33. 33. Business project is absolutely profitable (graph: income and expenses are fuzzy, variant N 4) Wmax
- 34. 34. Business project is absolutely profitable (graph: income and expenses are fuzzy, variant N 5) Wmax
- 35. 35. Business project is absolutely profitable (graph: income and expenses are fuzzy, variant N 6) Wmax
- 36. 36. Business project is absolutely profitable (graph: income and expenses are fuzzy, variant N 7) Wmax
- 37. 37. Business project is absolutely profitable (graph: income and expenses are fuzzy, variant N 8) Wmax
- 38. 38. Business project is absolutely profitable (graph: income and expenses are fuzzy, variant N 9) Wmax
- 39. 39. Business project is absolutely profitable (graph: income and expenses are fuzzy, variant N 10) Wmax
- 40. 40. Business project is absolutely profitable (graph: income and expenses are fuzzy, variant N 11) Wmax
- 41. 41. Business project is absolutely profitable (graph: income and expenses are fuzzy, variant N 12) Wmax
- 42. 42. Business project is absolutely profitable (graph: income and expenses are fuzzy, variant N 13) Wmax
- 43. 43. Business project is absolutely profitable (graph: income and expenses are fuzzy, variant N 14) Wmax
- 44. 44. Business project is absolutely profitable (graph: income and expenses are fuzzy, variant N 15) Wmax
- 45. 45. Business project is absolutely profitable (graph: income and expenses are fuzzy, variant N 16) Wmax
- 46. 46. Business project is absolutely profitable (graph: income and expenses are fuzzy, variant N 17) Wmax
- 47. 47. Business project is absolutely profitable (graph: income and expenses are fuzzy, variant N 18) Wmax
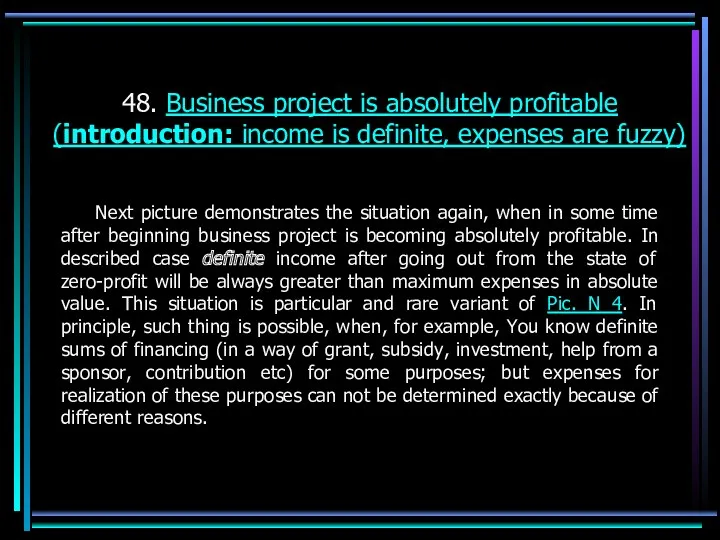
- 48. 48. Business project is absolutely profitable (introduction: income is definite, expenses are fuzzy) Next picture demonstrates
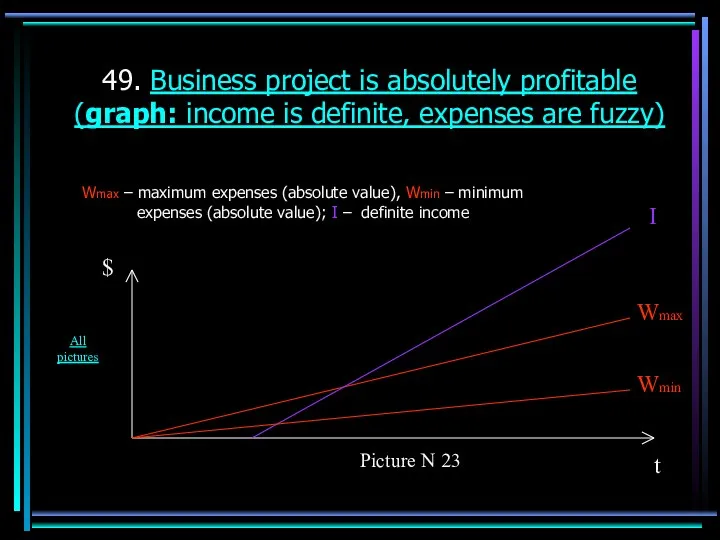
- 49. 49. Business project is absolutely profitable (graph: income is definite, expenses are fuzzy) Wmax – maximum
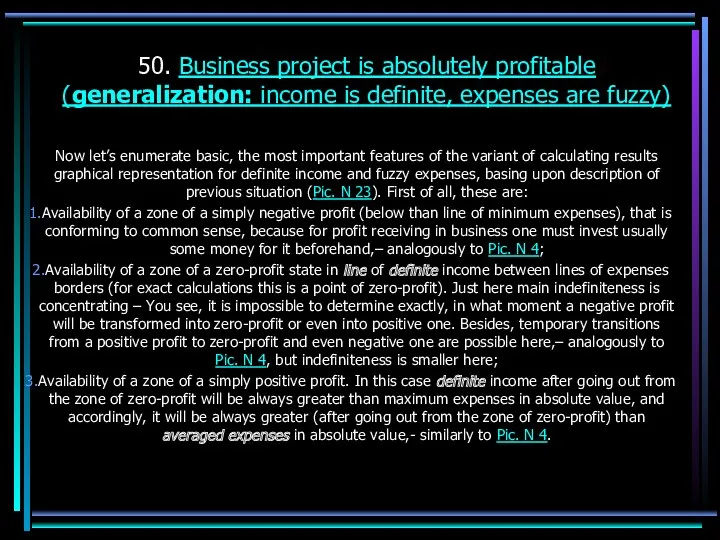
- 50. 50. Business project is absolutely profitable (generalization: income is definite, expenses are fuzzy) Now let’s enumerate
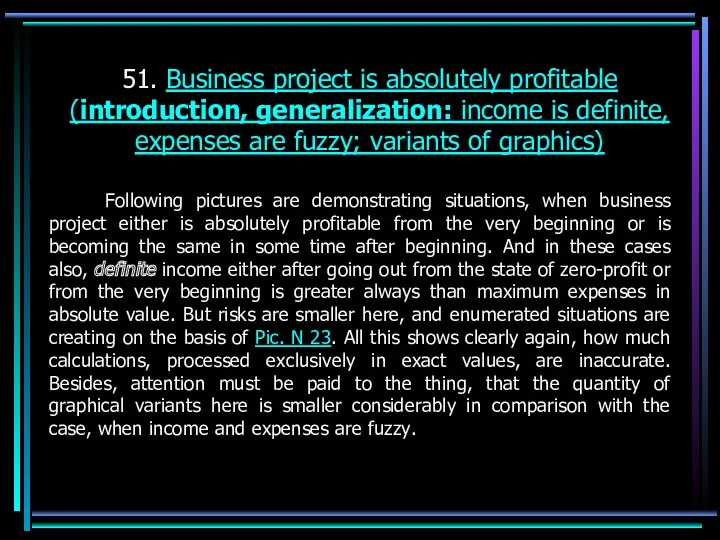
- 51. 51. Business project is absolutely profitable (introduction, generalization: income is definite, expenses are fuzzy; variants of
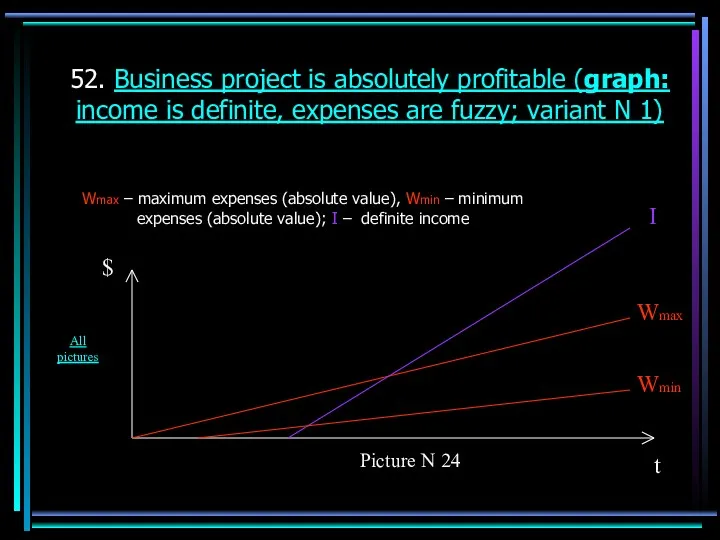
- 52. 52. Business project is absolutely profitable (graph: income is definite, expenses are fuzzy; variant N 1)
- 53. 53. Business project is absolutely profitable (graph: income is definite, expenses are fuzzy; variant N 2)
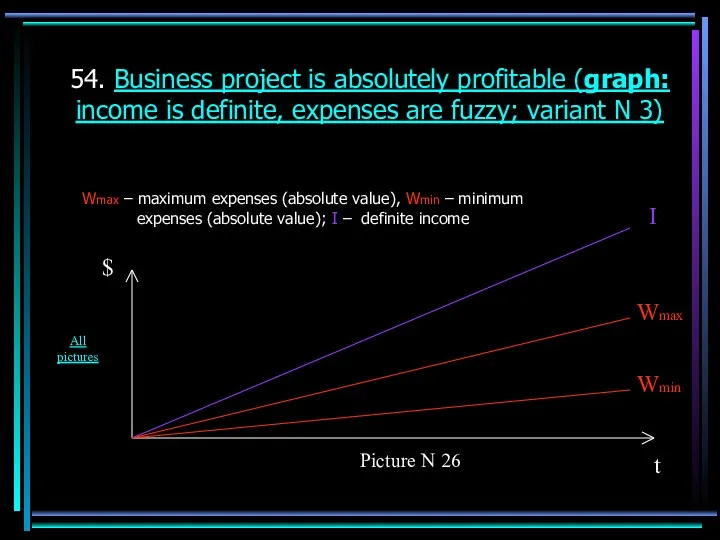
- 54. 54. Business project is absolutely profitable (graph: income is definite, expenses are fuzzy; variant N 3)
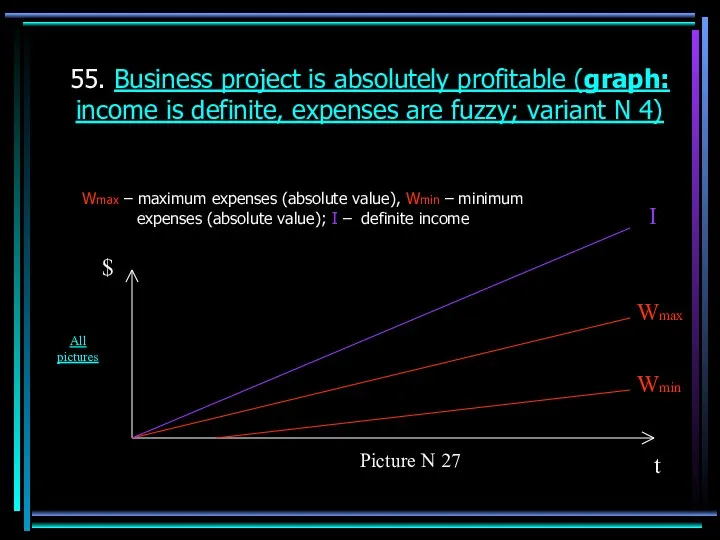
- 55. 55. Business project is absolutely profitable (graph: income is definite, expenses are fuzzy; variant N 4)
- 56. 56. Business project is absolutely profitable (introduction: income is fuzzy, expenses are definite) Next picture demonstrates
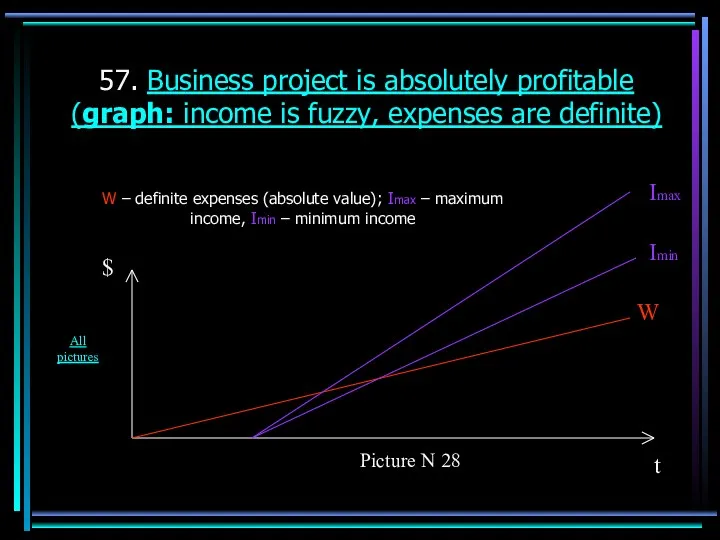
- 57. 57. Business project is absolutely profitable (graph: income is fuzzy, expenses are definite) W – definite
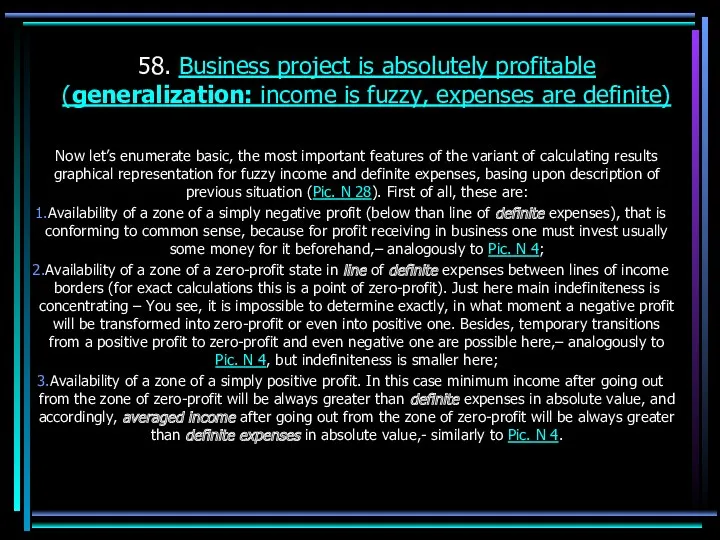
- 58. 58. Business project is absolutely profitable (generalization: income is fuzzy, expenses are definite) Now let’s enumerate
- 59. 59. Business project is absolutely profitable (introduction, generalization: income is fuzzy, expenses are definite, variants of
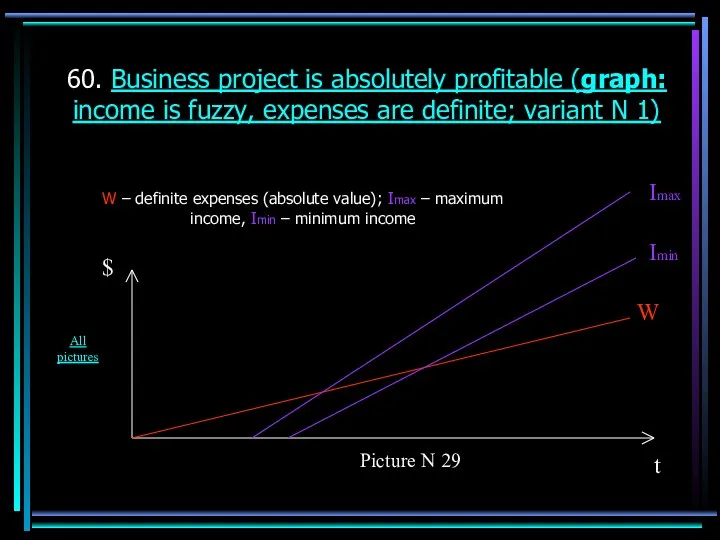
- 60. 60. Business project is absolutely profitable (graph: income is fuzzy, expenses are definite; variant N 1)
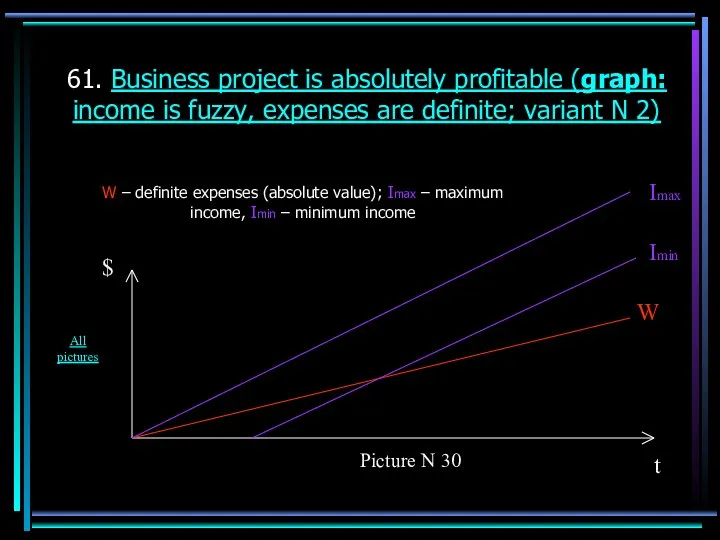
- 61. 61. Business project is absolutely profitable (graph: income is fuzzy, expenses are definite; variant N 2)
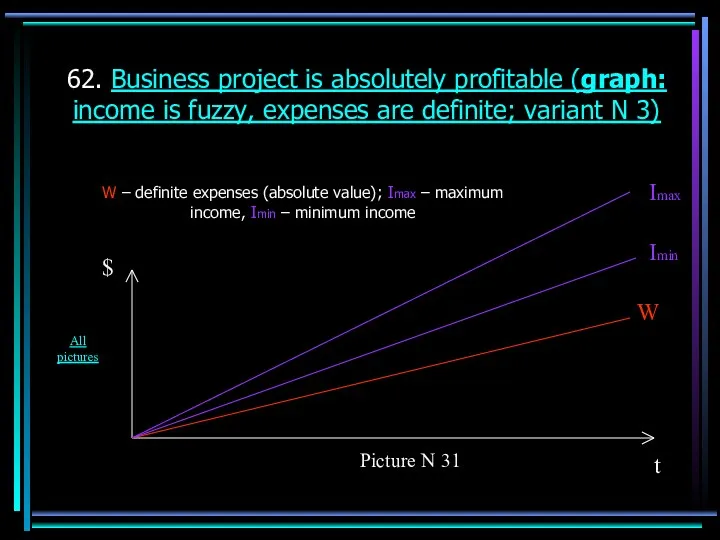
- 62. 62. Business project is absolutely profitable (graph: income is fuzzy, expenses are definite; variant N 3)
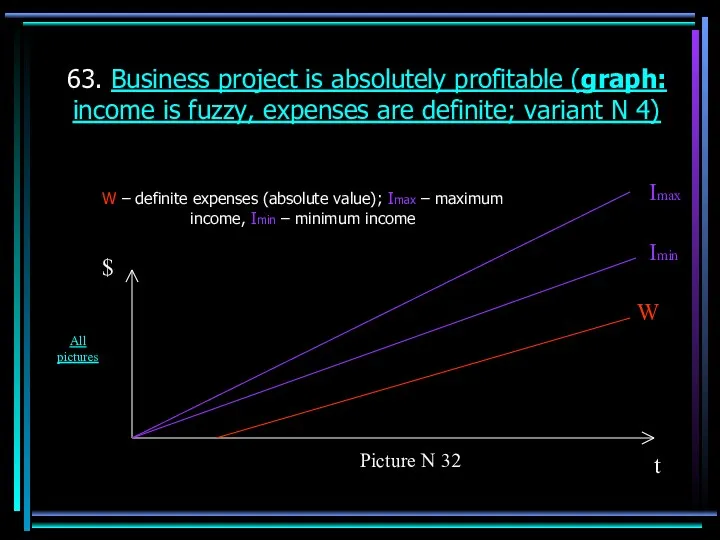
- 63. 63. Business project is absolutely profitable (graph: income is fuzzy, expenses are definite; variant N 4)
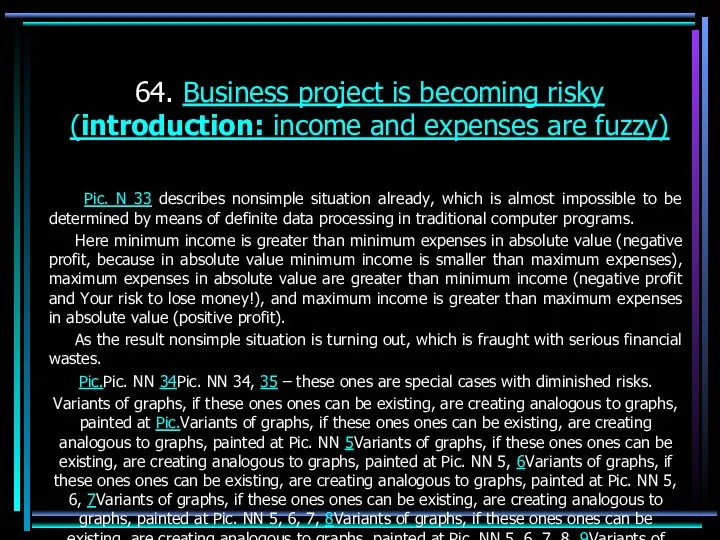
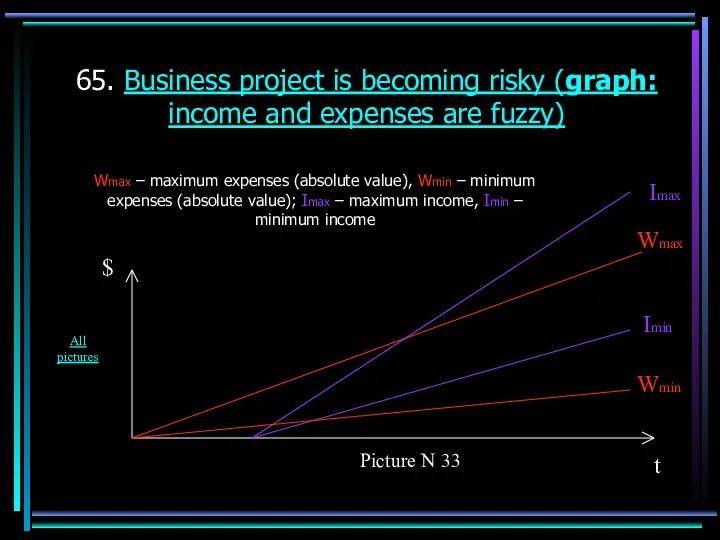
- 64. 64. Business project is becoming risky (introduction: income and expenses are fuzzy) Pic. N 33 describes
- 65. 65. Business project is becoming risky (graph: income and expenses are fuzzy) Wmax – maximum expenses
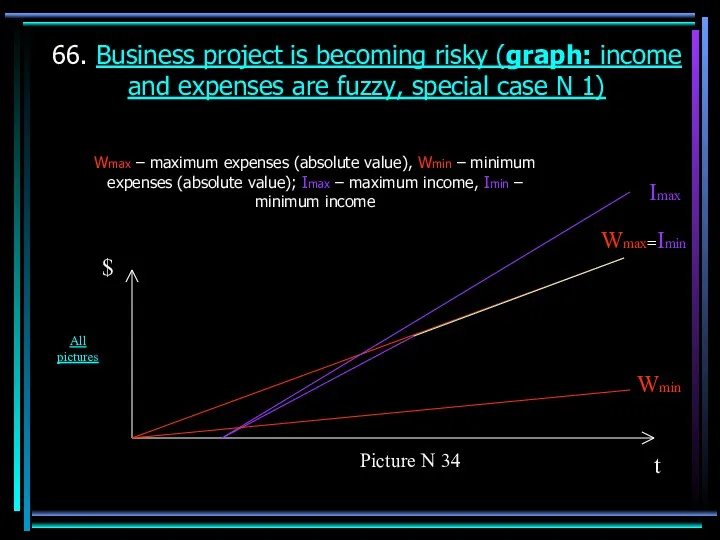
- 66. 66. Business project is becoming risky (graph: income and expenses are fuzzy, special case N 1)
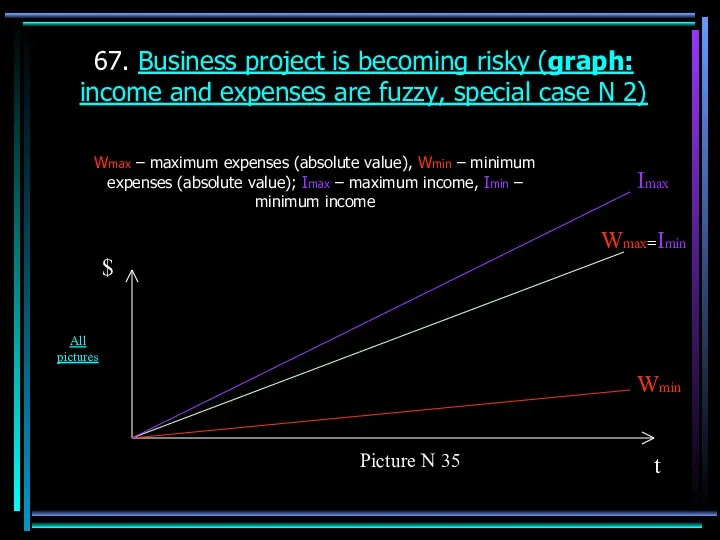
- 67. 67. Business project is becoming risky (graph: income and expenses are fuzzy, special case N 2)
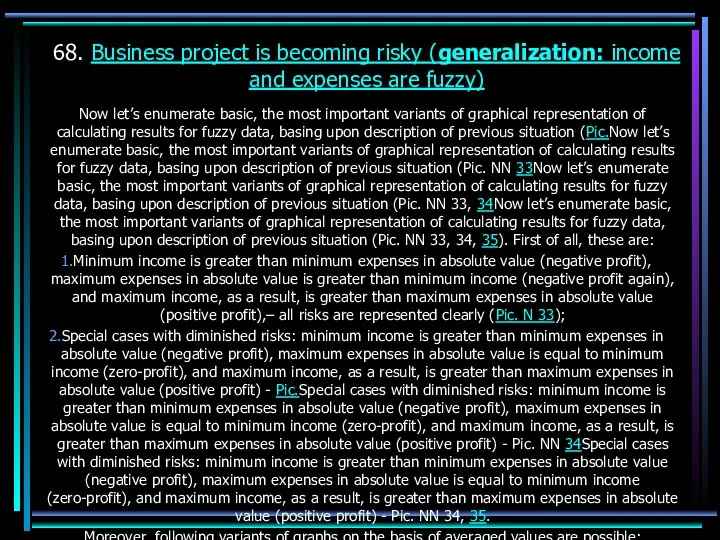
- 68. 68. Business project is becoming risky (generalization: income and expenses are fuzzy) Now let’s enumerate basic,
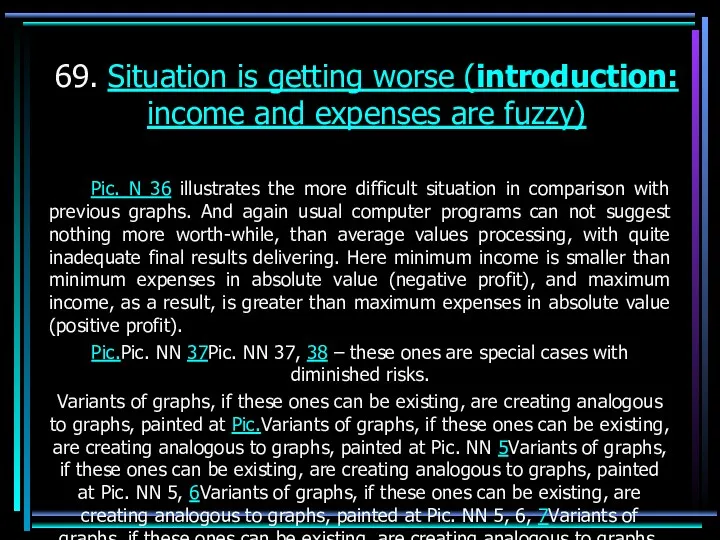
- 69. 69. Situation is getting worse (introduction: income and expenses are fuzzy) Pic. N 36 illustrates the
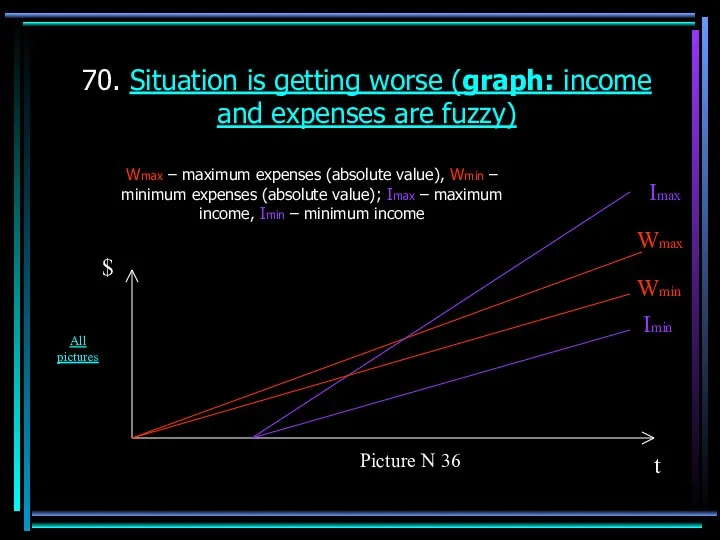
- 70. 70. Situation is getting worse (graph: income and expenses are fuzzy) Wmax – maximum expenses (absolute
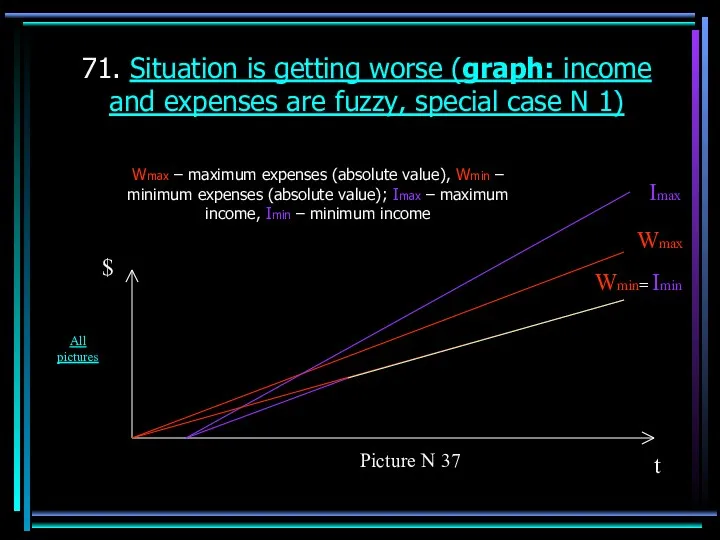
- 71. 71. Situation is getting worse (graph: income and expenses are fuzzy, special case N 1) Wmax
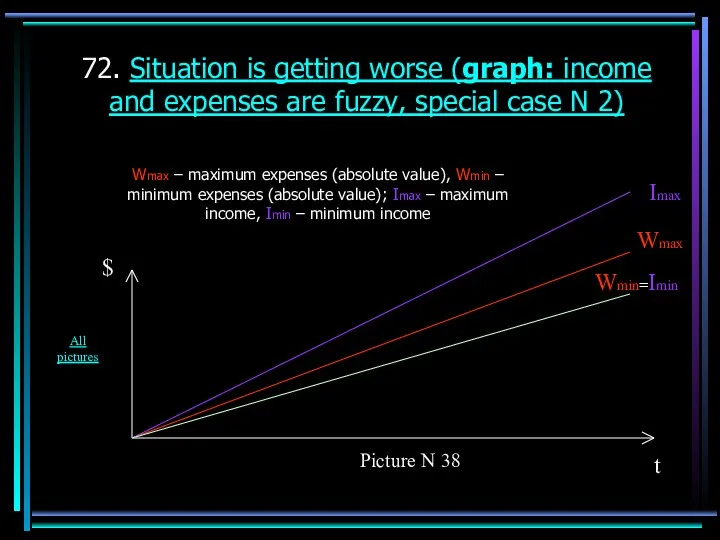
- 72. 72. Situation is getting worse (graph: income and expenses are fuzzy, special case N 2) Wmax
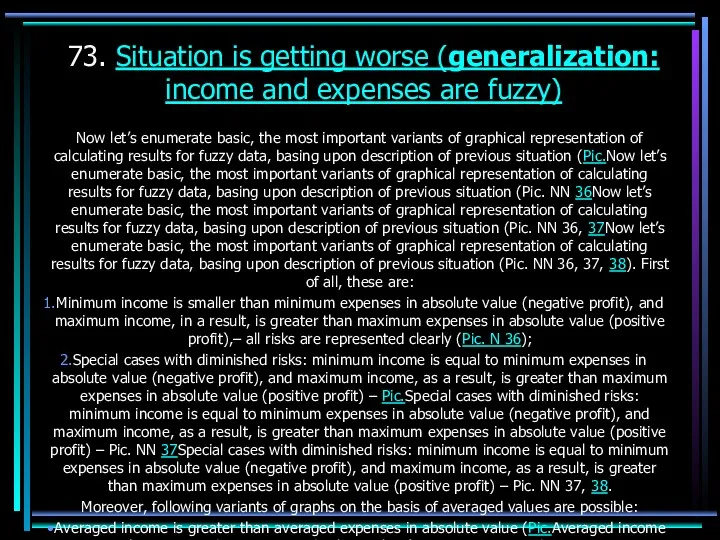
- 73. 73. Situation is getting worse (generalization: income and expenses are fuzzy) Now let’s enumerate basic, the
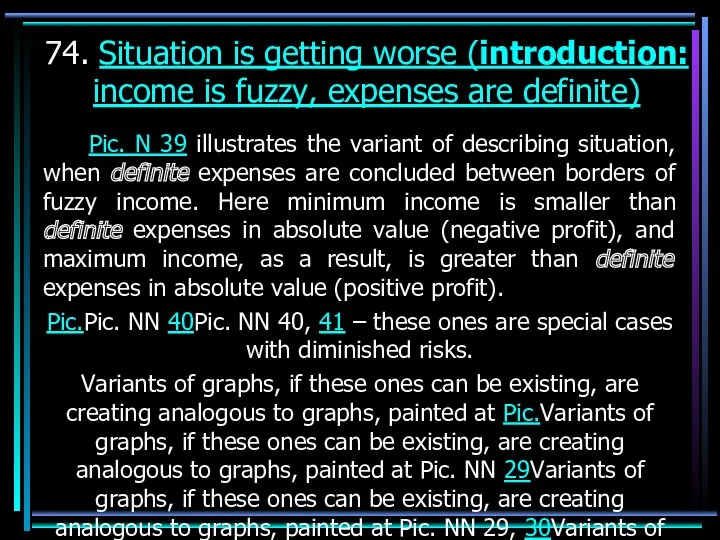
- 74. 74. Situation is getting worse (introduction: income is fuzzy, expenses are definite) Pic. N 39 illustrates
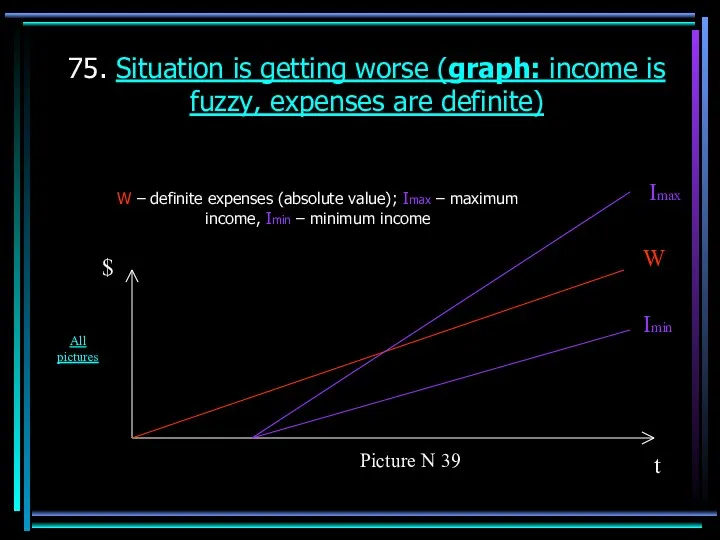
- 75. 75. Situation is getting worse (graph: income is fuzzy, expenses are definite) W – definite expenses
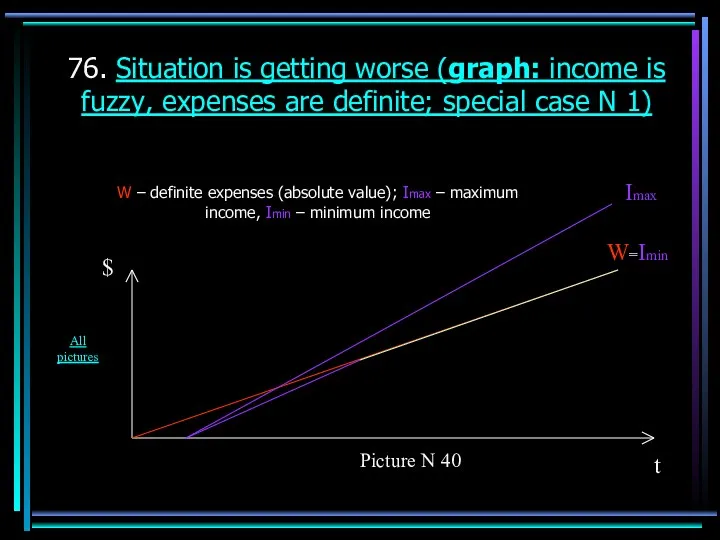
- 76. 76. Situation is getting worse (graph: income is fuzzy, expenses are definite; special case N 1)
- 77. 77. Situation is getting worse (graph: income is fuzzy, expenses are definite; special case N 2)
- 78. 78. Situation is getting worse (generalization: income is fuzzy, expenses are definite) Now let’s enumerate basic,
- 79. 79. Risk is increasing (introduction: income and expenses are fuzzy) Pic. N 42 describes the more
- 80. 80. Risk is increasing (graph: income and expenses are fuzzy) Wmax – maximum expenses (absolute value),
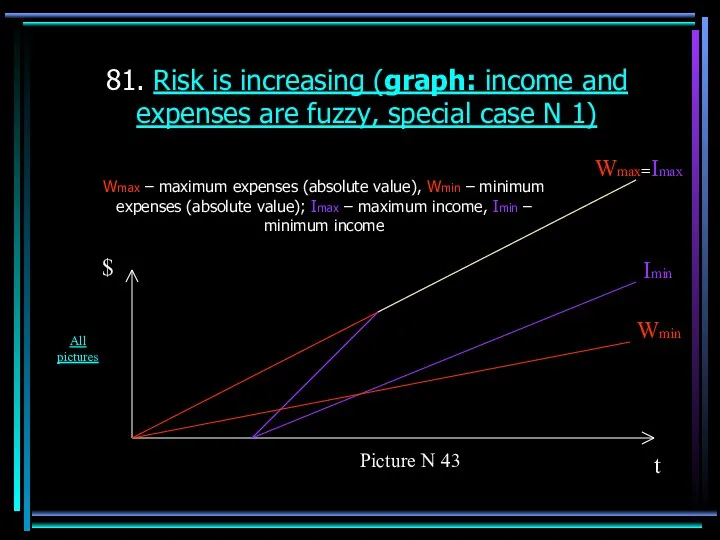
- 81. 81. Risk is increasing (graph: income and expenses are fuzzy, special case N 1) Wmax –
- 82. 82. Risk is increasing (graph: income and expenses are fuzzy, special case N 2) Wmax –
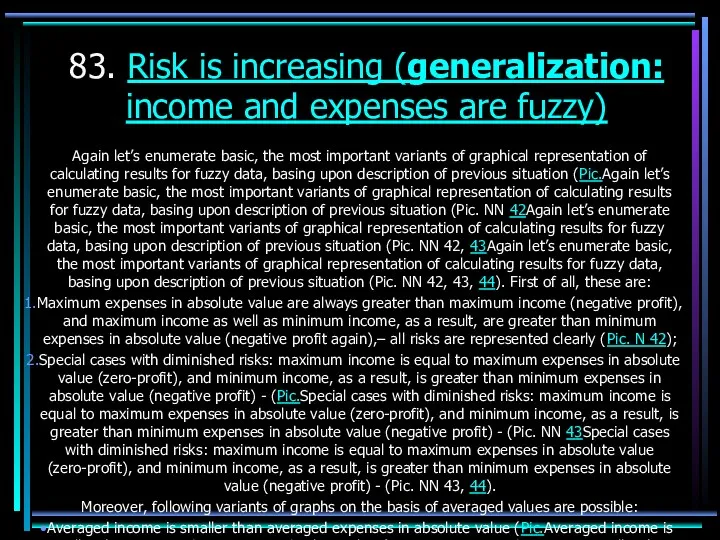
- 83. 83. Risk is increasing (generalization: income and expenses are fuzzy) Again let’s enumerate basic, the most
- 84. 84. Risk is increasing (introduction: income is definite, expenses are fuzzy) Pic. N 45 describes variant
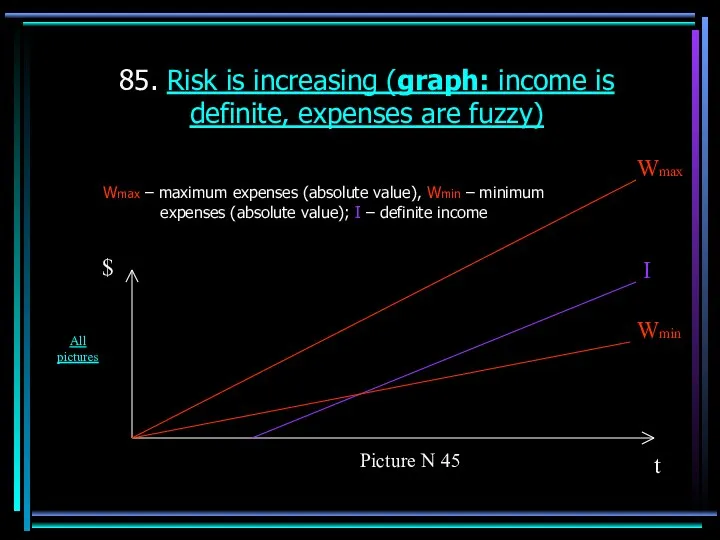
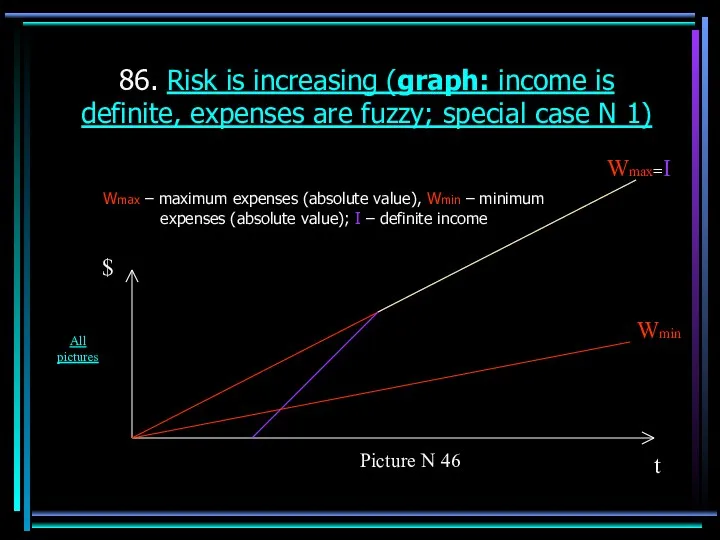
- 85. 85. Risk is increasing (graph: income is definite, expenses are fuzzy) Wmax – maximum expenses (absolute
- 86. 86. Risk is increasing (graph: income is definite, expenses are fuzzy; special case N 1) Wmax
- 87. 87. Risk is increasing (graph: income is definite, expenses are fuzzy; special case N 2) Wmax
- 88. 88. Risk is increasing (generalization: income is definite, expenses are fuzzy) Again let’s enumerate basic, the
- 89. 89. Worse and worse (introduction: income and expenses are fuzzy) Pic. N 48 describes the most
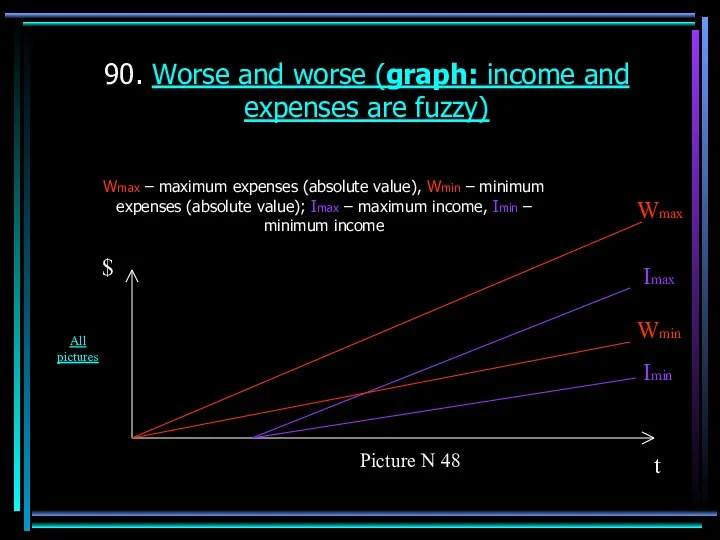
- 90. 90. Worse and worse (graph: income and expenses are fuzzy) Wmax – maximum expenses (absolute value),
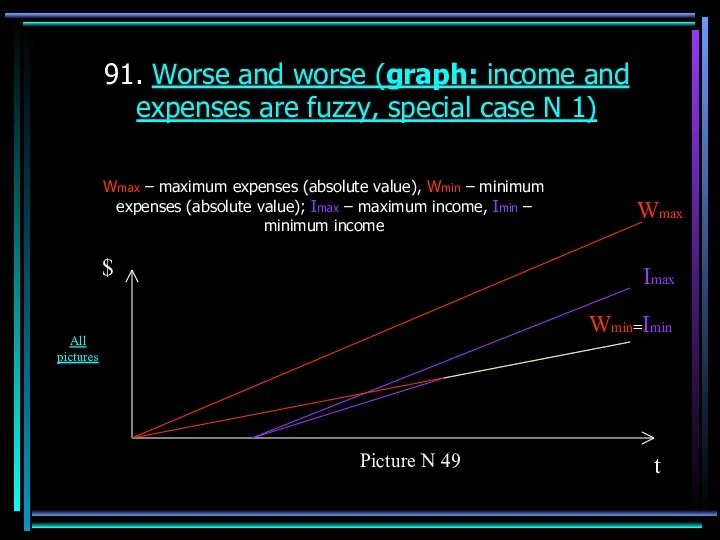
- 91. 91. Worse and worse (graph: income and expenses are fuzzy, special case N 1) Wmax –
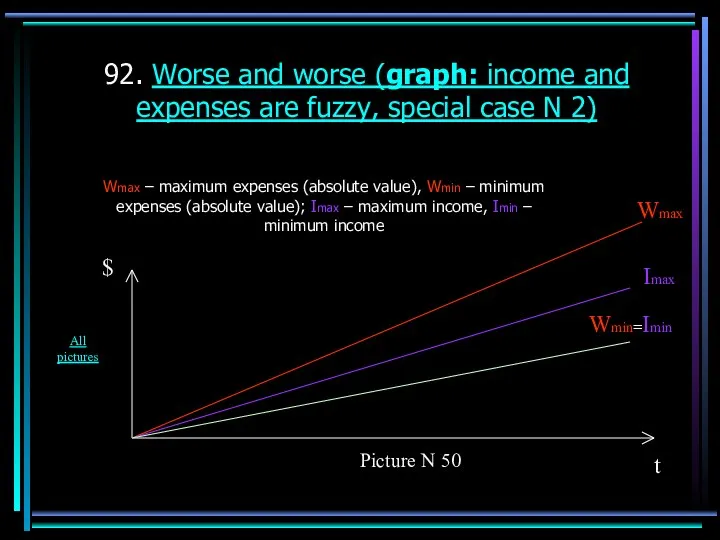
- 92. 92. Worse and worse (graph: income and expenses are fuzzy, special case N 2) Wmax –
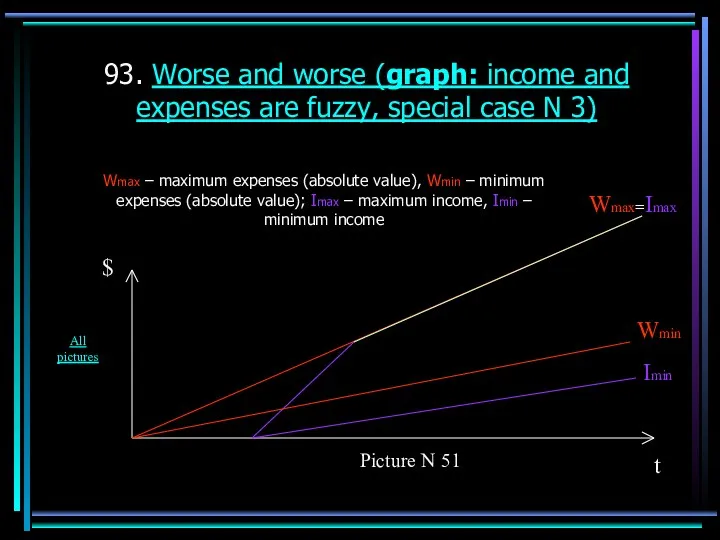
- 93. 93. Worse and worse (graph: income and expenses are fuzzy, special case N 3) Wmax –
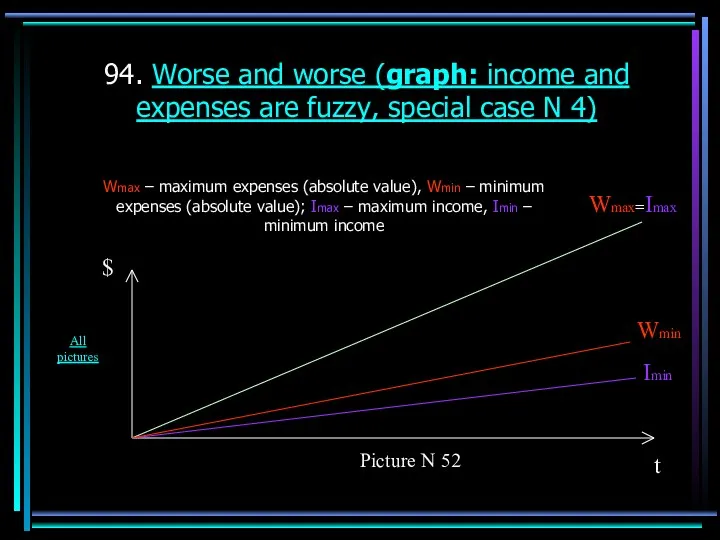
- 94. 94. Worse and worse (graph: income and expenses are fuzzy, special case N 4) Wmax –
- 95. 95. Worse and worse (graph: income and expenses are fuzzy, special case N 5) Wmax –
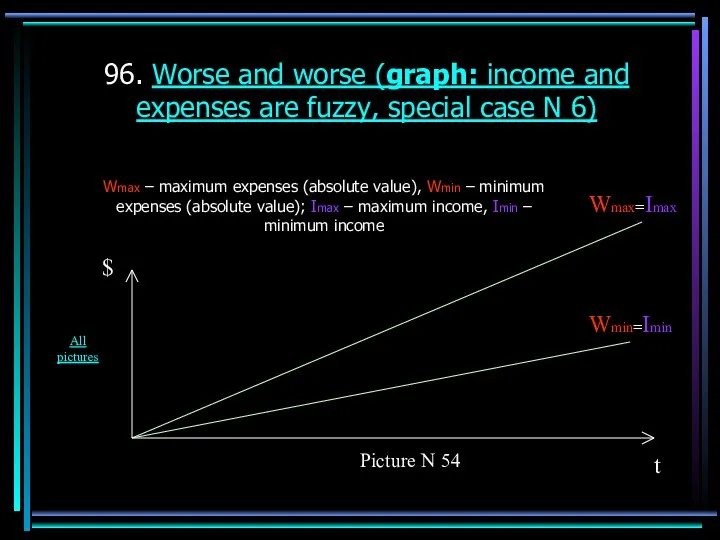
- 96. 96. Worse and worse (graph: income and expenses are fuzzy, special case N 6) Wmax –
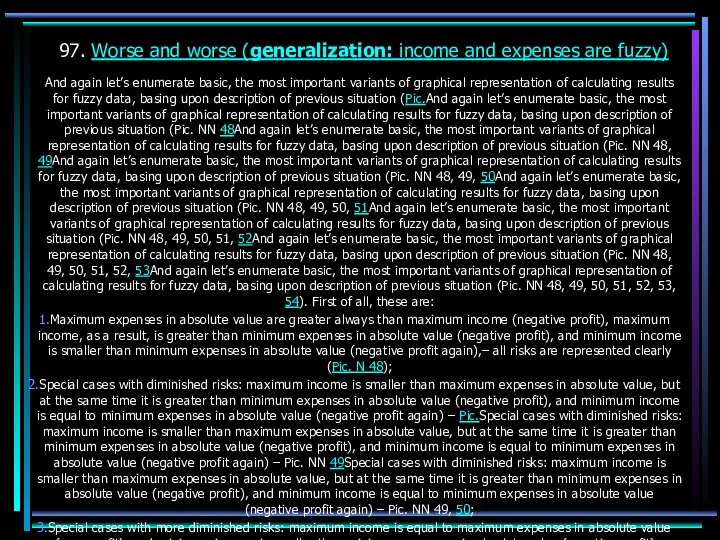
- 97. 97. Worse and worse (generalization: income and expenses are fuzzy) And again let’s enumerate basic, the
- 98. 98. That’s quite bad (introduction: income and expenses are fuzzy) Well, and at last, Pic. N
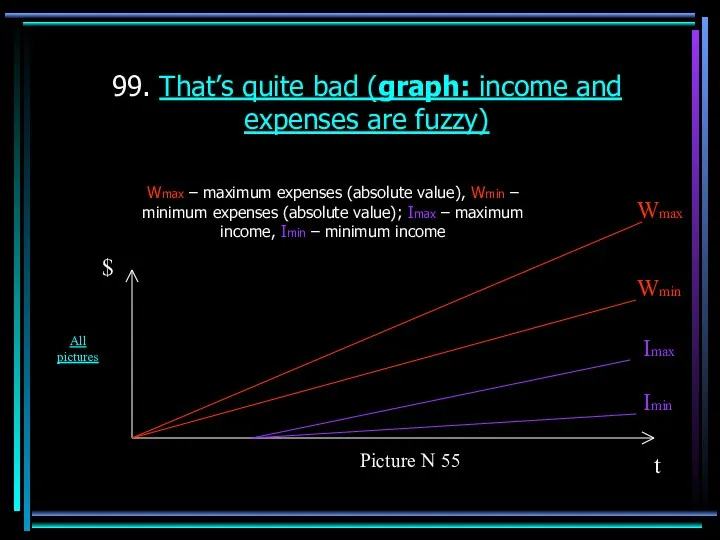
- 99. 99. That’s quite bad (graph: income and expenses are fuzzy) Wmax – maximum expenses (absolute value),
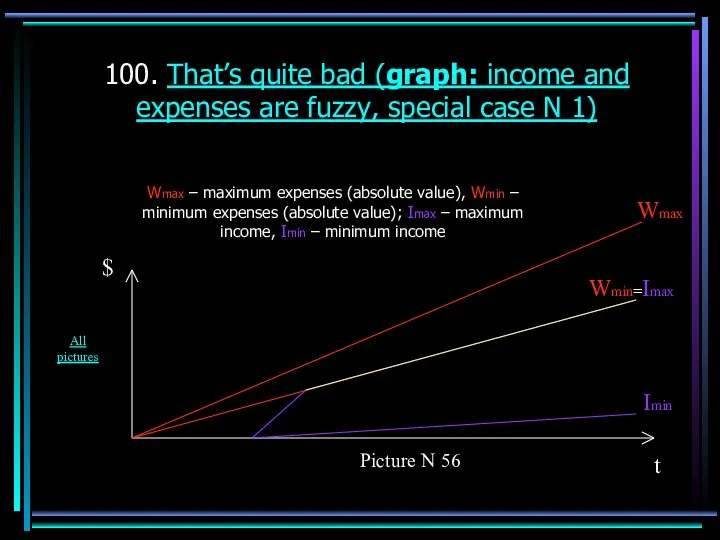
- 100. 100. That’s quite bad (graph: income and expenses are fuzzy, special case N 1) Wmax –
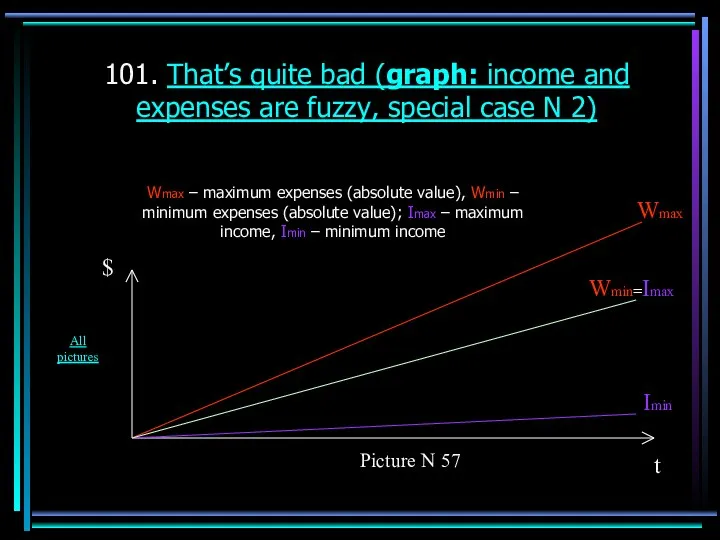
- 101. 101. That’s quite bad (graph: income and expenses are fuzzy, special case N 2) Wmax –
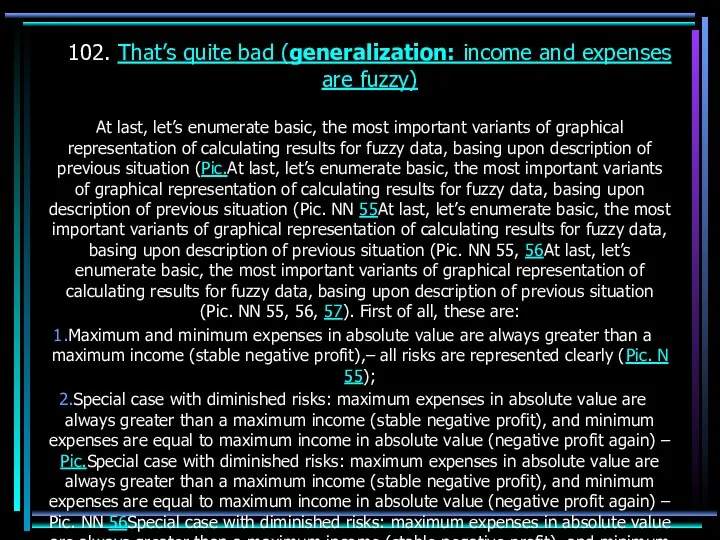
- 102. 102. That’s quite bad (generalization: income and expenses are fuzzy) At last, let’s enumerate basic, the
- 103. 103. That’s quite bad (introduction: income is definite, expenses are fuzzy) Well, and at last, Pic.
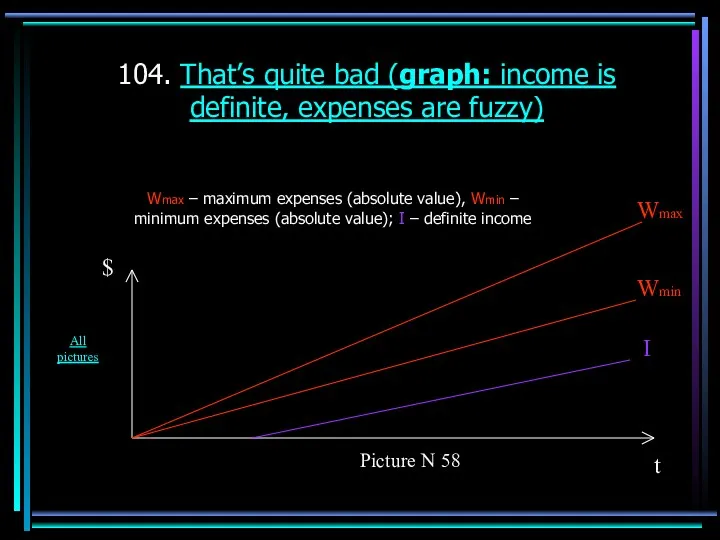
- 104. 104. That’s quite bad (graph: income is definite, expenses are fuzzy) Wmax – maximum expenses (absolute
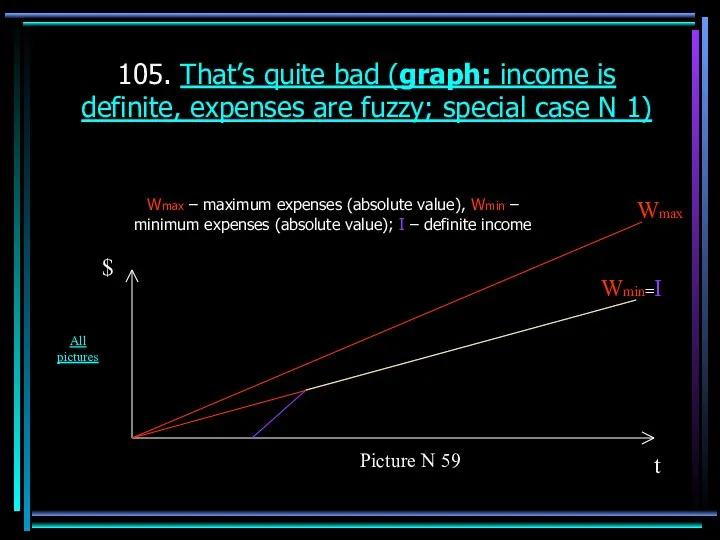
- 105. 105. That’s quite bad (graph: income is definite, expenses are fuzzy; special case N 1) Wmax
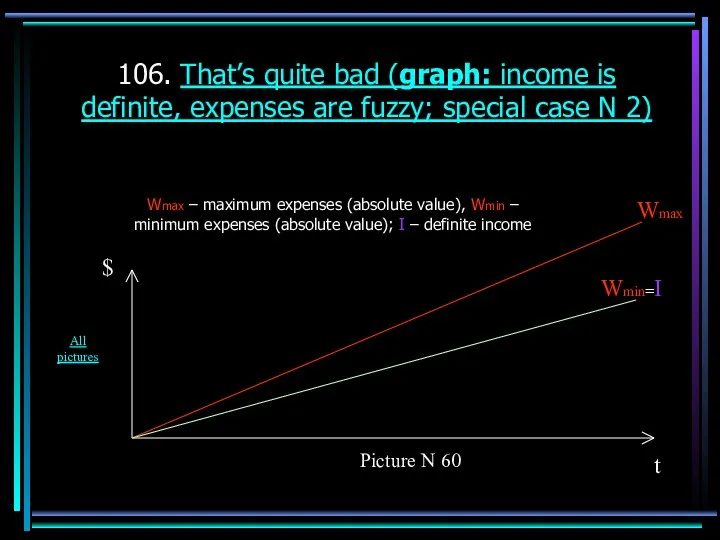
- 106. 106. That’s quite bad (graph: income is definite, expenses are fuzzy; special case N 2) Wmax
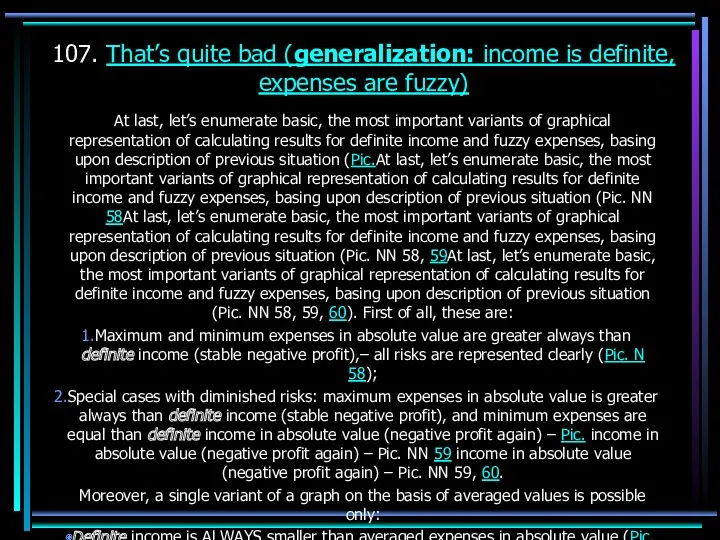
- 107. 107. That’s quite bad (generalization: income is definite, expenses are fuzzy) At last, let’s enumerate basic,
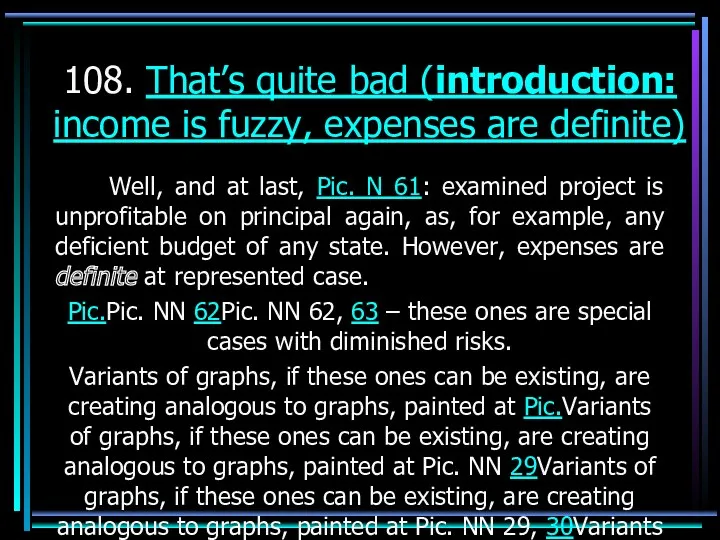
- 108. 108. That’s quite bad (introduction: income is fuzzy, expenses are definite) Well, and at last, Pic.
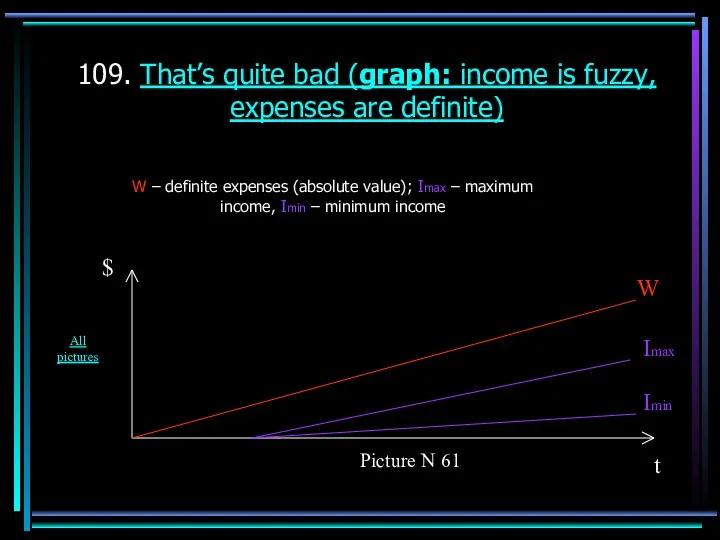
- 109. 109. That’s quite bad (graph: income is fuzzy, expenses are definite) W – definite expenses (absolute
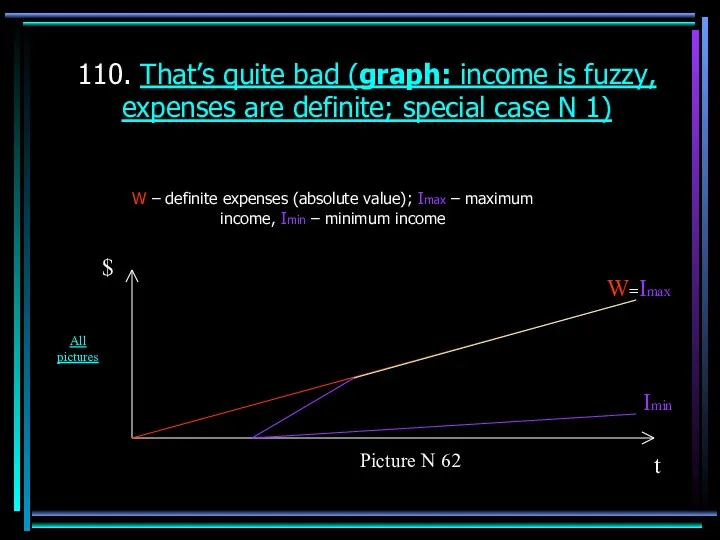
- 110. 110. That’s quite bad (graph: income is fuzzy, expenses are definite; special case N 1) W
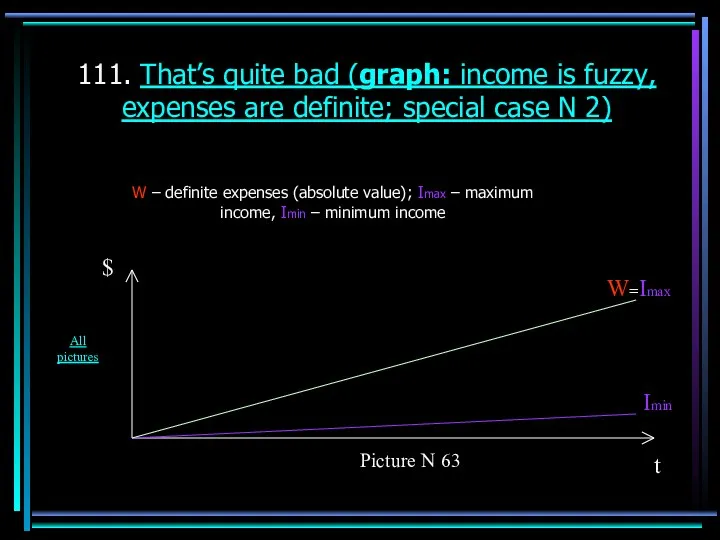
- 111. 111. That’s quite bad (graph: income is fuzzy, expenses are definite; special case N 2) W
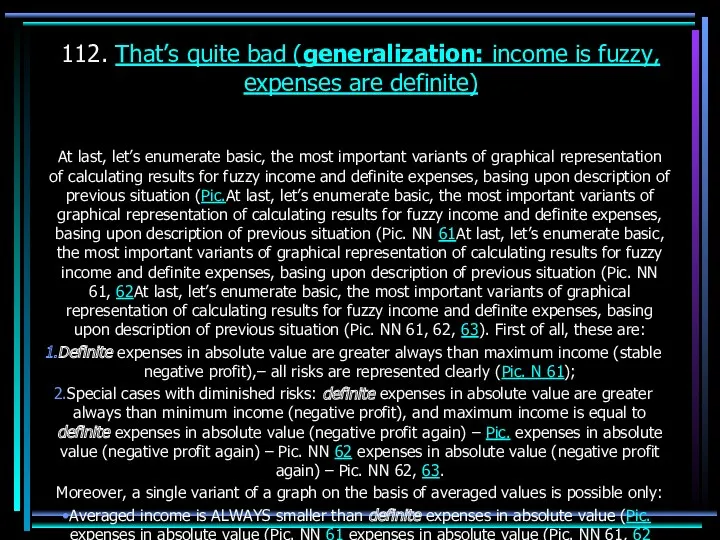
- 112. 112. That’s quite bad (generalization: income is fuzzy, expenses are definite) At last, let’s enumerate basic,
- 113. 113. Basic difference Let’s generalize all aforesaid. As You can see from graphs, the most important
- 114. 114. Combination of graphs And now let’s sum up on the basis of all above-stated. Thus,
- 115. 115. Incomplete data At second, we can consider without any saying that incomplete data are belonging
- 116. 116. Indefinite data At third, data may be indefinite. Sometimes a user can write for his
- 117. 117. Dependent data At fourth, data may be dependent, when one part of information depends on
- 118. 118. Illustration of dependence Here is more complex dependence for illustration: Bank credit => goods buying
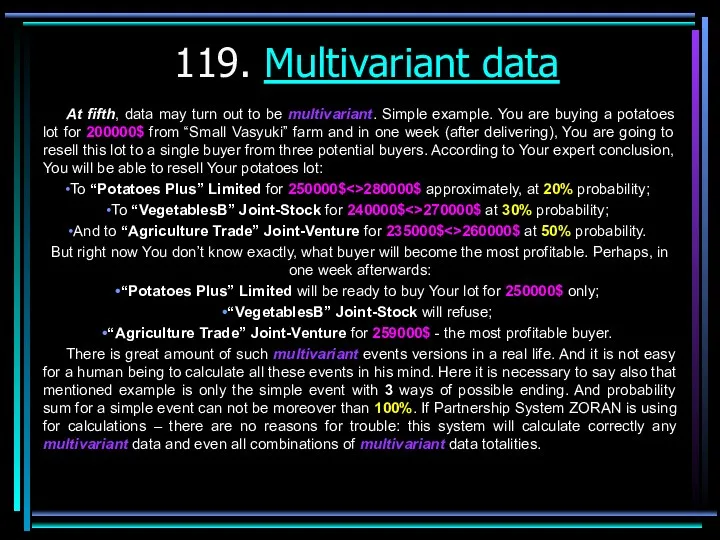
- 119. 119. Multivariant data At fifth, data may turn out to be multivariant. Simple example. You are
- 120. 120. Paradoxical data At sixth, data may be paradoxical. So, if in previous example probability of
- 121. 121. Distributed data At seventh, data may be distributed - to be stored in different documents
- 122. 122. Nonevident data And at eighth, at last, data may be nonevident also (when some information
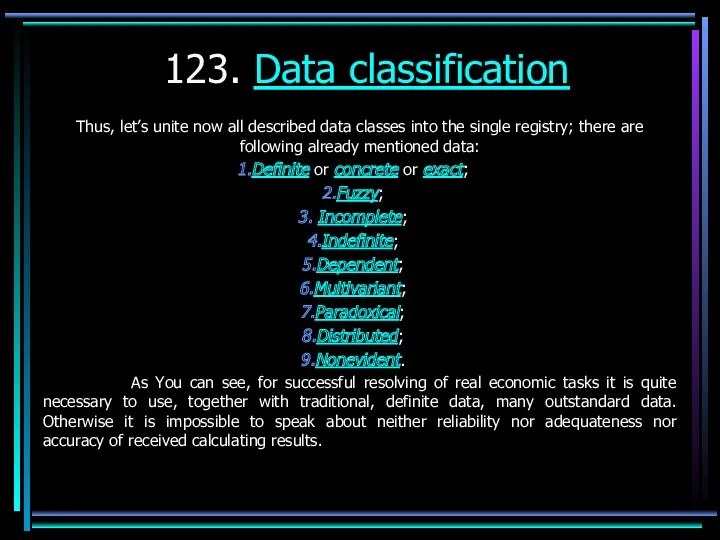
- 123. 123. Data classification Thus, let’s unite now all described data classes into the single registry; there
- 124. 124. Complex data processing After finish of data input, it is enough for any user to
- 125. 125. And what is user to do? Thus, any user ought to do only, in general,
- 126. 126. There is scale-ability also! At last, it is necessary to mention the fact, that Partnership
- 127. 127. Exclusive services Besides all, if You need for some single time calculations, it will be
- 128. 128. So, I offer You to become my strategic partner at spheres of using and distribution
- 129. 129. My advantages My «visiting card» - Partnership System ZORAN - exclusive product of elite class
- 130. 130. Know-how and results Fundamental scientific theory; New conception of artificial intelligence; Know-How for outstandard data
- 131. 131. Marketing focus Marketing focus for Partnership System ZORAN is directed to education, any investment activity,
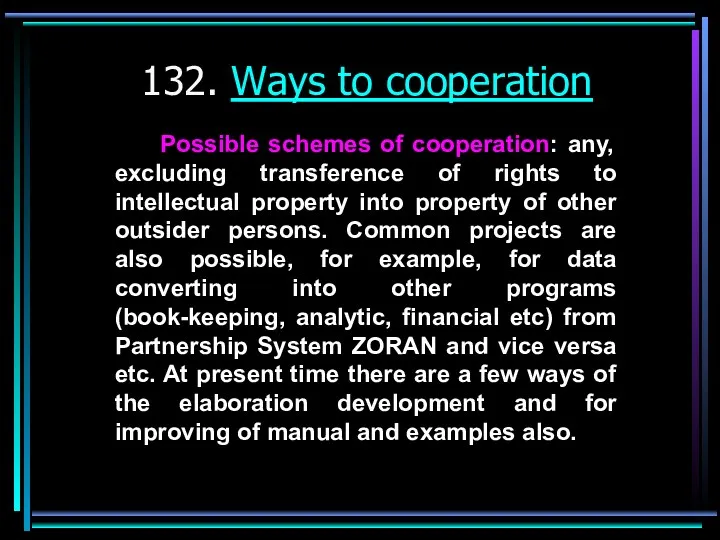
- 132. 132. Ways to cooperation Possible schemes of cooperation: any, excluding transference of rights to intellectual property
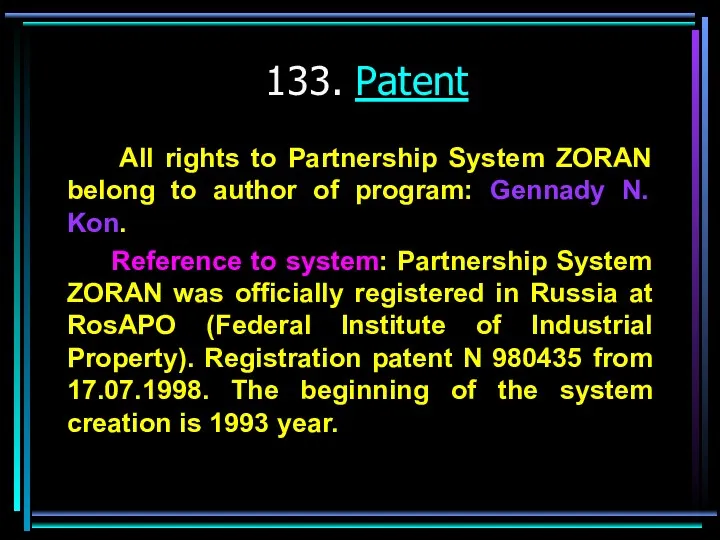
- 133. 133. Patent All rights to Partnership System ZORAN belong to author of program: Gennady N. Kon.
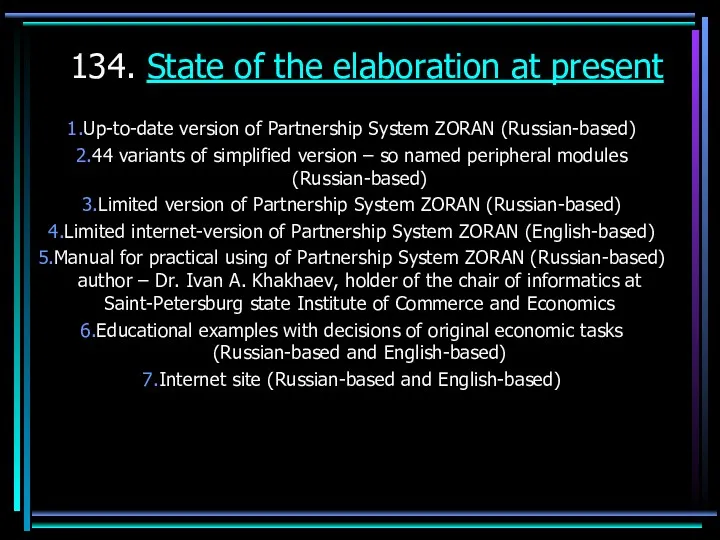
- 134. 134. State of the elaboration at present Up-to-date version of Partnership System ZORAN (Russian-based) 44 variants
- 135. 135. Short message to You I SHALL BE GLAD TO SEE YOU BEING MY SPONSOR, INVESTOR,
- 137. Скачать презентацию
07/28/2023
Partnership System ZORAN as Artificial Intelligence system (first part - practical
07/28/2023
Partnership System ZORAN as Artificial Intelligence system (first part - practical
07/28/2023
Partnership System ZORAN as Artificial Intelligence system (first part - practical
07/28/2023
Partnership System ZORAN as Artificial Intelligence system (first part - practical
07/28/2023
Partnership System ZORAN as Artificial Intelligence system (first part - practical
07/28/2023
Partnership System ZORAN as Artificial Intelligence system (first part - practical
07/28/2023
Partnership System ZORAN as Artificial Intelligence system (first part - practical
07/28/2023
Partnership System ZORAN as Artificial Intelligence system (first part - practical
07/28/2023
Partnership System ZORAN as Artificial Intelligence system (first part - practical
07/28/2023
Partnership System ZORAN as Artificial Intelligence system (first part - practical
07/28/2023
Partnership System ZORAN as Artificial Intelligence system (first part - practical
07/28/2023
Partnership System ZORAN as Artificial Intelligence system (first part - practical
07/28/2023
Partnership System ZORAN as Artificial Intelligence system (first part - practical
07/28/2023
Partnership System ZORAN as Artificial Intelligence system (first part - practical
07/28/2023
Partnership System ZORAN as Artificial Intelligence system (first part - practical
07/28/2023
Partnership System ZORAN as Artificial Intelligence system (first part - practical
10. Partnership System ZORAN
Is the best universal tool for exclusive
10. Partnership System ZORAN
Is the best universal tool for exclusive
11. Main difference!
The main difference of Partnership System ZORAN in
11. Main difference!
The main difference of Partnership System ZORAN in
12. Response to skeptics
They consider always during many years, that
12. Response to skeptics
They consider always during many years, that
13. In what item, however, skeptics may be right – rough
13. In what item, however, skeptics may be right – rough
14. Definite or concrete or exact data
All classical computer programs
14. Definite or concrete or exact data
All classical computer programs
15. Limit of possibilities for exact calculations (introduction)
On next pictures
15. Limit of possibilities for exact calculations (introduction)
On next pictures
16. Limit of possibilities for exact calculations (graph: positive profit)
W –
16. Limit of possibilities for exact calculations (graph: positive profit)
W –
17. Limit of possibilities for exact calculations (graph: zero-profit)
W – exact
17. Limit of possibilities for exact calculations (graph: zero-profit)
W – exact
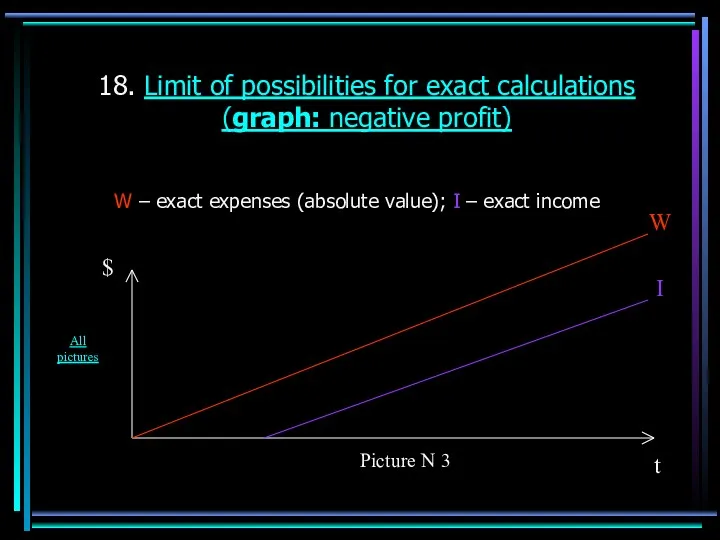
18. Limit of possibilities for exact calculations (graph: negative profit)
W –
18. Limit of possibilities for exact calculations (graph: negative profit)
W –
19. Limit of possibilities for exact calculations (generalization)
Let’s generalize aforesaid. Let’s
19. Limit of possibilities for exact calculations (generalization)
Let’s generalize aforesaid. Let’s
20. But this is not catastrophic situation!
To get over possibility
20. But this is not catastrophic situation!
To get over possibility
21. What purposes new data types are necessary for (forecasting of
21. What purposes new data types are necessary for (forecasting of
22. Fuzzy or not concrete data
At first, these are fuzzy
22. Fuzzy or not concrete data
At first, these are fuzzy
23. Co-using of definite and fuzzy data
Thus, usefulness of
23. Co-using of definite and fuzzy data
Thus, usefulness of
24. What purposes new data types are necessary for (analyzing and
24. What purposes new data types are necessary for (analyzing and
25. How to get over possibility limitation for exact calculations
Next
25. How to get over possibility limitation for exact calculations
Next
26. Business project is absolutely profitable (introduction: income and expenses are
26. Business project is absolutely profitable (introduction: income and expenses are
27. Business project is absolutely profitable (graph: income and expenses are
27. Business project is absolutely profitable (graph: income and expenses are
28. Business project is absolutely profitable (generalization: income and expenses are
28. Business project is absolutely profitable (generalization: income and expenses are
29. Business project is absolutely profitable (introduction, generalization: income and expenses
29. Business project is absolutely profitable (introduction, generalization: income and expenses

30. Business project is absolutely profitable (graph: income and expenses are
30. Business project is absolutely profitable (graph: income and expenses are

31. Business project is absolutely profitable (graph: income and expenses are
31. Business project is absolutely profitable (graph: income and expenses are

32. Business project is absolutely profitable (graph: income and expenses are
32. Business project is absolutely profitable (graph: income and expenses are

33. Business project is absolutely profitable (graph: income and expenses are
33. Business project is absolutely profitable (graph: income and expenses are

34. Business project is absolutely profitable (graph: income and expenses are
34. Business project is absolutely profitable (graph: income and expenses are
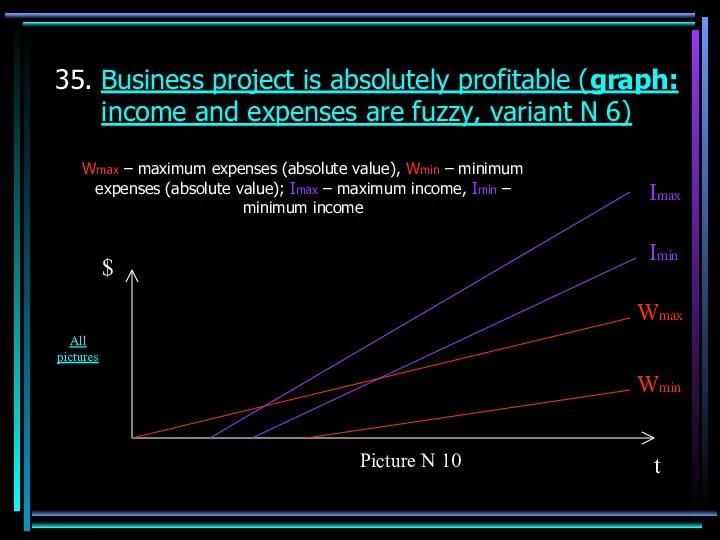
35. Business project is absolutely profitable (graph: income and expenses are
35. Business project is absolutely profitable (graph: income and expenses are

36. Business project is absolutely profitable (graph: income and expenses are
36. Business project is absolutely profitable (graph: income and expenses are

37. Business project is absolutely profitable (graph: income and expenses are
37. Business project is absolutely profitable (graph: income and expenses are

38. Business project is absolutely profitable (graph: income and expenses are
38. Business project is absolutely profitable (graph: income and expenses are

39. Business project is absolutely profitable (graph: income and expenses are
39. Business project is absolutely profitable (graph: income and expenses are
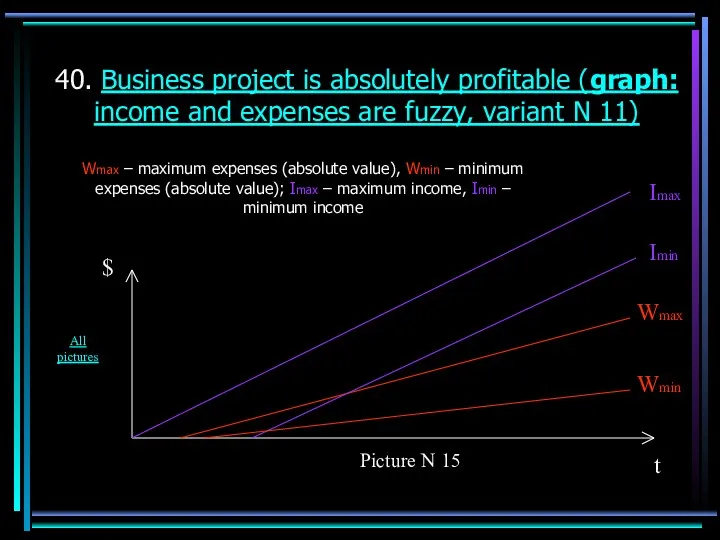
40. Business project is absolutely profitable (graph: income and expenses are
40. Business project is absolutely profitable (graph: income and expenses are

41. Business project is absolutely profitable (graph: income and expenses are
41. Business project is absolutely profitable (graph: income and expenses are
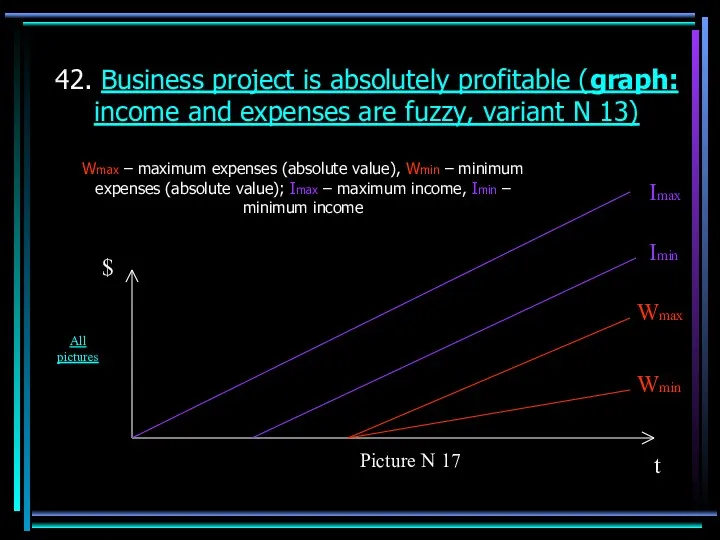
42. Business project is absolutely profitable (graph: income and expenses are
42. Business project is absolutely profitable (graph: income and expenses are

43. Business project is absolutely profitable (graph: income and expenses are
43. Business project is absolutely profitable (graph: income and expenses are

44. Business project is absolutely profitable (graph: income and expenses are
44. Business project is absolutely profitable (graph: income and expenses are

45. Business project is absolutely profitable (graph: income and expenses are
45. Business project is absolutely profitable (graph: income and expenses are

46. Business project is absolutely profitable (graph: income and expenses are
46. Business project is absolutely profitable (graph: income and expenses are
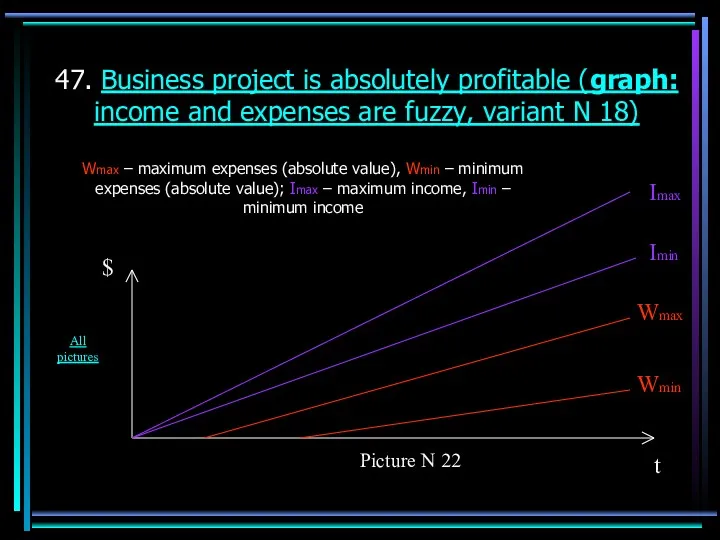
47. Business project is absolutely profitable (graph: income and expenses are
47. Business project is absolutely profitable (graph: income and expenses are
48. Business project is absolutely profitable (introduction: income is definite, expenses
48. Business project is absolutely profitable (introduction: income is definite, expenses
49. Business project is absolutely profitable (graph: income is definite, expenses
49. Business project is absolutely profitable (graph: income is definite, expenses
50. Business project is absolutely profitable (generalization: income is definite, expenses
50. Business project is absolutely profitable (generalization: income is definite, expenses
51. Business project is absolutely profitable (introduction, generalization: income is definite,
51. Business project is absolutely profitable (introduction, generalization: income is definite,
52. Business project is absolutely profitable (graph: income is definite, expenses
52. Business project is absolutely profitable (graph: income is definite, expenses

53. Business project is absolutely profitable (graph: income is definite, expenses
53. Business project is absolutely profitable (graph: income is definite, expenses
54. Business project is absolutely profitable (graph: income is definite, expenses
54. Business project is absolutely profitable (graph: income is definite, expenses
55. Business project is absolutely profitable (graph: income is definite, expenses
55. Business project is absolutely profitable (graph: income is definite, expenses
56. Business project is absolutely profitable (introduction: income is fuzzy, expenses
56. Business project is absolutely profitable (introduction: income is fuzzy, expenses
57. Business project is absolutely profitable (graph: income is fuzzy, expenses
57. Business project is absolutely profitable (graph: income is fuzzy, expenses
58. Business project is absolutely profitable (generalization: income is fuzzy, expenses
58. Business project is absolutely profitable (generalization: income is fuzzy, expenses
59. Business project is absolutely profitable (introduction, generalization: income is fuzzy,
59. Business project is absolutely profitable (introduction, generalization: income is fuzzy,
60. Business project is absolutely profitable (graph: income is fuzzy, expenses
60. Business project is absolutely profitable (graph: income is fuzzy, expenses
61. Business project is absolutely profitable (graph: income is fuzzy, expenses
61. Business project is absolutely profitable (graph: income is fuzzy, expenses
62. Business project is absolutely profitable (graph: income is fuzzy, expenses
62. Business project is absolutely profitable (graph: income is fuzzy, expenses
63. Business project is absolutely profitable (graph: income is fuzzy, expenses
63. Business project is absolutely profitable (graph: income is fuzzy, expenses
64. Business project is becoming risky (introduction: income and expenses are
64. Business project is becoming risky (introduction: income and expenses are
65. Business project is becoming risky (graph: income and expenses are
65. Business project is becoming risky (graph: income and expenses are
66. Business project is becoming risky (graph: income and expenses are
66. Business project is becoming risky (graph: income and expenses are
67. Business project is becoming risky (graph: income and expenses are
67. Business project is becoming risky (graph: income and expenses are
68. Business project is becoming risky (generalization: income and expenses are
68. Business project is becoming risky (generalization: income and expenses are
69. Situation is getting worse (introduction: income and expenses are fuzzy)
69. Situation is getting worse (introduction: income and expenses are fuzzy)
70. Situation is getting worse (graph: income and expenses are fuzzy)
Wmax
70. Situation is getting worse (graph: income and expenses are fuzzy)
Wmax
71. Situation is getting worse (graph: income and expenses are fuzzy,
71. Situation is getting worse (graph: income and expenses are fuzzy,
72. Situation is getting worse (graph: income and expenses are fuzzy,
72. Situation is getting worse (graph: income and expenses are fuzzy,
73. Situation is getting worse (generalization: income and expenses are fuzzy)
Now
73. Situation is getting worse (generalization: income and expenses are fuzzy)
Now
74. Situation is getting worse (introduction: income is fuzzy, expenses are
74. Situation is getting worse (introduction: income is fuzzy, expenses are
75. Situation is getting worse (graph: income is fuzzy, expenses are
75. Situation is getting worse (graph: income is fuzzy, expenses are
76. Situation is getting worse (graph: income is fuzzy, expenses are
76. Situation is getting worse (graph: income is fuzzy, expenses are
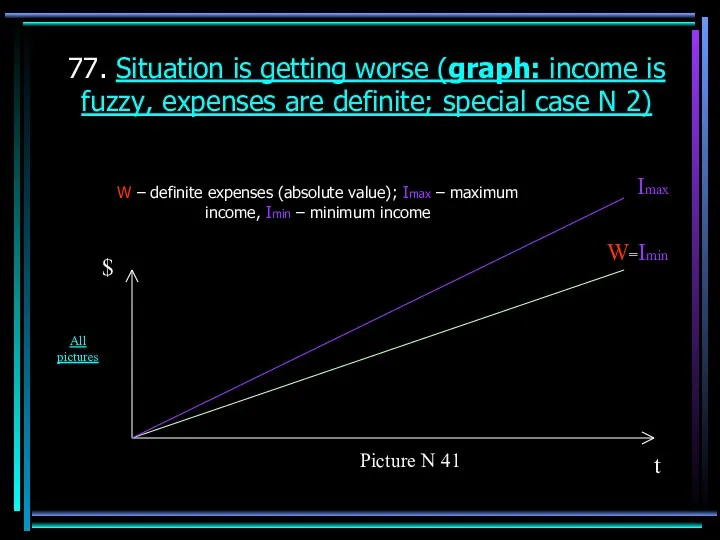
77. Situation is getting worse (graph: income is fuzzy, expenses are
77. Situation is getting worse (graph: income is fuzzy, expenses are
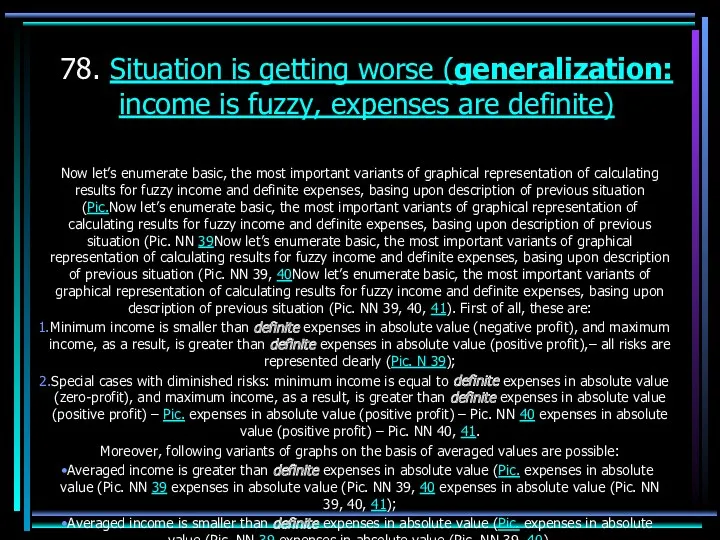
78. Situation is getting worse (generalization: income is fuzzy, expenses are
78. Situation is getting worse (generalization: income is fuzzy, expenses are
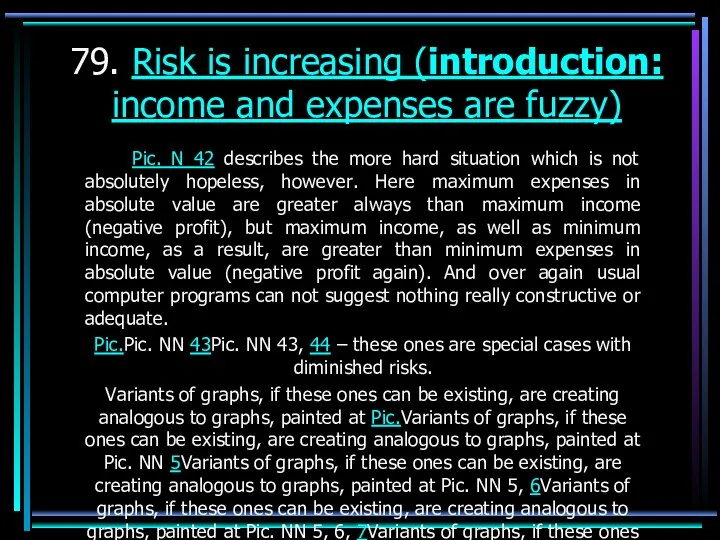
79. Risk is increasing (introduction: income and expenses are fuzzy)
Pic.
79. Risk is increasing (introduction: income and expenses are fuzzy)
Pic.
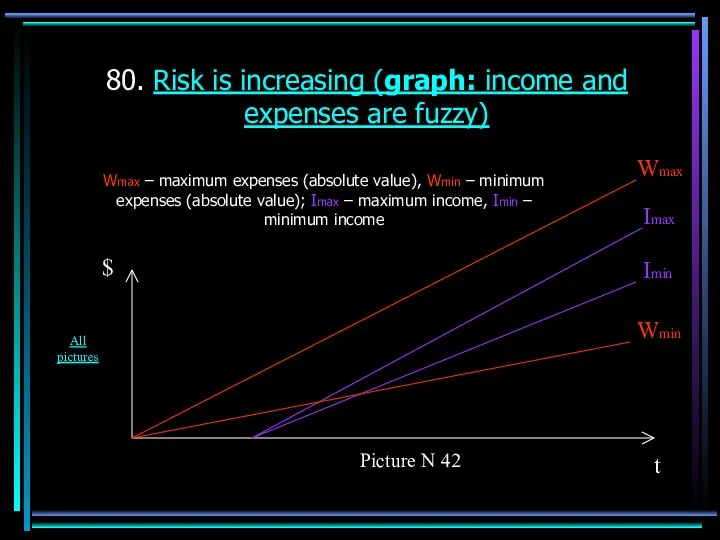
80. Risk is increasing (graph: income and expenses are fuzzy)
Wmax –
80. Risk is increasing (graph: income and expenses are fuzzy)
Wmax –
81. Risk is increasing (graph: income and expenses are fuzzy, special
81. Risk is increasing (graph: income and expenses are fuzzy, special

82. Risk is increasing (graph: income and expenses are fuzzy, special
82. Risk is increasing (graph: income and expenses are fuzzy, special
83. Risk is increasing (generalization: income and expenses are fuzzy)
Again let’s
83. Risk is increasing (generalization: income and expenses are fuzzy)
Again let’s
84. Risk is increasing (introduction: income is definite, expenses are fuzzy)
84. Risk is increasing (introduction: income is definite, expenses are fuzzy)
85. Risk is increasing (graph: income is definite, expenses are fuzzy)
Wmax
85. Risk is increasing (graph: income is definite, expenses are fuzzy)
Wmax
86. Risk is increasing (graph: income is definite, expenses are fuzzy;
86. Risk is increasing (graph: income is definite, expenses are fuzzy;

87. Risk is increasing (graph: income is definite, expenses are fuzzy;
87. Risk is increasing (graph: income is definite, expenses are fuzzy;
88. Risk is increasing (generalization: income is definite, expenses are fuzzy)
Again
88. Risk is increasing (generalization: income is definite, expenses are fuzzy)
Again
89. Worse and worse (introduction: income and expenses are fuzzy)
Pic.
89. Worse and worse (introduction: income and expenses are fuzzy)
Pic.
90. Worse and worse (graph: income and expenses are fuzzy)
Wmax –
90. Worse and worse (graph: income and expenses are fuzzy)
Wmax –
91. Worse and worse (graph: income and expenses are fuzzy, special
91. Worse and worse (graph: income and expenses are fuzzy, special
92. Worse and worse (graph: income and expenses are fuzzy, special
92. Worse and worse (graph: income and expenses are fuzzy, special
93. Worse and worse (graph: income and expenses are fuzzy, special
93. Worse and worse (graph: income and expenses are fuzzy, special
94. Worse and worse (graph: income and expenses are fuzzy, special
94. Worse and worse (graph: income and expenses are fuzzy, special

95. Worse and worse (graph: income and expenses are fuzzy, special
95. Worse and worse (graph: income and expenses are fuzzy, special
96. Worse and worse (graph: income and expenses are fuzzy, special
96. Worse and worse (graph: income and expenses are fuzzy, special
97. Worse and worse (generalization: income and expenses are fuzzy)
And again
97. Worse and worse (generalization: income and expenses are fuzzy)
And again
98. That’s quite bad (introduction: income and expenses are fuzzy)
Well,
98. That’s quite bad (introduction: income and expenses are fuzzy)
Well,
99. That’s quite bad (graph: income and expenses are fuzzy)
Wmax –
99. That’s quite bad (graph: income and expenses are fuzzy)
Wmax –
100. That’s quite bad (graph: income and expenses are fuzzy, special
100. That’s quite bad (graph: income and expenses are fuzzy, special
101. That’s quite bad (graph: income and expenses are fuzzy, special
101. That’s quite bad (graph: income and expenses are fuzzy, special
102. That’s quite bad (generalization: income and expenses are fuzzy)
At last,
102. That’s quite bad (generalization: income and expenses are fuzzy)
At last,
103. That’s quite bad (introduction: income is definite, expenses are fuzzy)
103. That’s quite bad (introduction: income is definite, expenses are fuzzy)
104. That’s quite bad (graph: income is definite, expenses are fuzzy)
Wmax
104. That’s quite bad (graph: income is definite, expenses are fuzzy)
Wmax
105. That’s quite bad (graph: income is definite, expenses are fuzzy;
105. That’s quite bad (graph: income is definite, expenses are fuzzy;
106. That’s quite bad (graph: income is definite, expenses are fuzzy;
106. That’s quite bad (graph: income is definite, expenses are fuzzy;
107. That’s quite bad (generalization: income is definite, expenses are fuzzy)
At
107. That’s quite bad (generalization: income is definite, expenses are fuzzy)
At
108. That’s quite bad (introduction: income is fuzzy, expenses are definite)
108. That’s quite bad (introduction: income is fuzzy, expenses are definite)
109. That’s quite bad (graph: income is fuzzy, expenses are definite)
W
109. That’s quite bad (graph: income is fuzzy, expenses are definite)
W
110. That’s quite bad (graph: income is fuzzy, expenses are definite;
110. That’s quite bad (graph: income is fuzzy, expenses are definite;
111. That’s quite bad (graph: income is fuzzy, expenses are definite;
111. That’s quite bad (graph: income is fuzzy, expenses are definite;
112. That’s quite bad (generalization: income is fuzzy, expenses are definite)
At
112. That’s quite bad (generalization: income is fuzzy, expenses are definite)
At
113. Basic difference
Let’s generalize all aforesaid. As You can see
113. Basic difference
Let’s generalize all aforesaid. As You can see
114. Combination of graphs
And now let’s sum up on the basis
114. Combination of graphs
And now let’s sum up on the basis
115. Incomplete data
At second, we can consider without any saying
115. Incomplete data
At second, we can consider without any saying
116. Indefinite data
At third, data may be indefinite. Sometimes a
116. Indefinite data
At third, data may be indefinite. Sometimes a
117. Dependent data
At fourth, data may be dependent, when one
117. Dependent data
At fourth, data may be dependent, when one
118. Illustration of dependence
Here is more complex dependence for illustration:
Bank credit
118. Illustration of dependence
Here is more complex dependence for illustration:
Bank credit
119. Multivariant data
At fifth, data may turn out to be
119. Multivariant data
At fifth, data may turn out to be
120. Paradoxical data
At sixth, data may be paradoxical. So, if
120. Paradoxical data
At sixth, data may be paradoxical. So, if
121. Distributed data
At seventh, data may be distributed - to
121. Distributed data
At seventh, data may be distributed - to
122. Nonevident data
And at eighth, at last, data may be
122. Nonevident data
And at eighth, at last, data may be
123. Data classification
Thus, let’s unite now all described data classes into
123. Data classification
Thus, let’s unite now all described data classes into
124. Complex data processing
After finish of data input, it is
124. Complex data processing
After finish of data input, it is
125. And what is user to do?
Thus, any user ought
125. And what is user to do?
Thus, any user ought
126. There is scale-ability also!
At last, it is necessary to
126. There is scale-ability also!
At last, it is necessary to
127. Exclusive services
Besides all, if You need for some single
127. Exclusive services
Besides all, if You need for some single
128. So, I offer
You to become my strategic partner at
128. So, I offer
You to become my strategic partner at
129. My advantages
My «visiting card» - Partnership System ZORAN - exclusive
129. My advantages
My «visiting card» - Partnership System ZORAN - exclusive
130. Know-how and results
Fundamental scientific theory;
New conception of artificial intelligence;
130. Know-how and results
Fundamental scientific theory;
New conception of artificial intelligence;
131. Marketing focus
Marketing focus for Partnership System ZORAN is directed
131. Marketing focus
Marketing focus for Partnership System ZORAN is directed
132. Ways to cooperation
Possible schemes of cooperation: any, excluding transference
132. Ways to cooperation
Possible schemes of cooperation: any, excluding transference
133. Patent
All rights to Partnership System ZORAN belong to author
133. Patent
All rights to Partnership System ZORAN belong to author
134. State of the elaboration at present
Up-to-date version of Partnership System
134. State of the elaboration at present
Up-to-date version of Partnership System

135. Short message to You
I SHALL BE GLAD TO SEE YOU
135. Short message to You
I SHALL BE GLAD TO SEE YOU
 Журнал Музет. Декабрь 2015
 Организация интернет-СМИ
 Системы перевода и распознования текста
 Система управления информационной безопасности
 Информация как объект защиты на различных уровнях её представления
 История развития систем защиты информации
 Настройка BIOS или UEFI для последующей установки операционной системы
 Теория сети
 Примеры автоматизированных обучающих систем
 Информатика 10-11 класс тема Логика
 Форматирование текстового документа. Форматирование символов и абзацев
 Защита информации в экономических информационных системах
 Базы данных СУБД Access
 Типы данных и таблицы. Выборка данных из таблиц. Оператор select. (Тема 5)
 Технология использования QR – кодов
 Разработка представлений
 Информация и ее кодирование
 Современный образовательный портал MegaCampus
 Operating systems. Introduction to computer and internet
 Методы сортировки
 Абстрактный тип данных. Стек
 Структуры данных
 Проблемні питання шкідливого програмного забезпечення
 Клавиатура компьютера. Основные приемы работы. Виды клавиш и их основное назначение
 ЕГЭ по информатике 2014. Задачи А7
 Графический редактор Adobe Photoshop
 Размещение архивной информации в сети Интернет Уральского Федерального округа
 Обучение в Цифровой образовательной среде