- Capital Budgeting Techniques

Содержание
- 2. After studying Chapter 13, you should be able to: Understand the payback period (PBP) method of
- 3. Capital Budgeting Techniques Project Evaluation and Selection Potential Difficulties Capital Rationing Project Monitoring Post-Completion Audit
- 4. Project Evaluation: Alternative Methods Payback Period (PBP) Internal Rate of Return (IRR) Net Present Value (NPV)
- 5. Proposed Project Data Julie Miller is evaluating a new project for her firm, (BMW). She has
- 6. Independent Project Independent -- A project whose acceptance (or rejection) does not prevent the acceptance of
- 7. Payback Period (PBP) PBP is the period of time required for the cumulative expected cash flows
- 8. (c) 10 K 22 K 37 K 47 K 54 K Payback Solution (#1) PBP =
- 9. Payback Solution (#2) PBP = 3 + ( 3K ) / 10K = 3.3 Years Note:
- 10. PBP Acceptance Criterion Yes! The firm will receive back the initial cash outlay in less than
- 11. PBP Strengths and Weaknesses Strengths: Easy to use and understand Can be used as a measure
- 12. Internal Rate of Return (IRR) IRR is the discount rate that equates the present value of
- 13. $15,000 $10,000 $7,000 IRR Solution $10,000 $12,000 (1+IRR)1 (1+IRR)2 Find the interest rate (IRR) that causes
- 14. IRR Acceptance Criterion No! The firm will receive 11.57% for each dollar invested in this project
- 15. IRR Strengths and Weaknesses Strengths: Accounts for TVM Considers all cash flows Less subjectivity Weaknesses: Assumes
- 16. Net Present Value (NPV) NPV is the present value of an investment project’s net cash flows
- 17. Basket Wonders has determined that the appropriate discount rate (k) for this project is 13%. $10,000
- 18. NPV Acceptance Criterion No! The NPV is negative. This means that the project is reducing shareholder
- 19. NPV Strengths and Weaknesses Strengths: Cash flows assumed to be reinvested at the hurdle rate. Accounts
- 20. Profitability Index (PI) PI is the ratio of the present value of a project’s future net
- 21. PI Acceptance Criterion No! The PI is less than 1.00. This means that the project is
- 22. PI Strengths and Weaknesses Strengths: Same as NPV Allows comparison of different scale projects Weaknesses: Same
- 23. Evaluation Summary Basket Wonders Independent Project
- 24. Other Project Relationships Mutually Exclusive -- A project whose acceptance precludes the acceptance of one or
- 25. Potential Problems Under Mutual Exclusivity A. Scale of Investment B. Cash-flow Pattern C. Project Life Ranking
- 26. A. Scale Differences Compare a small (S) and a large (L) project. NET CASH FLOWS Project
- 27. Scale Differences Calculate the PBP, IRR, NPV@10%, and PI@10%. Which project is preferred? Why? Project IRR
- 28. B. Cash Flow Pattern Let us compare a decreasing cash-flow (D) project and an increasing cash-flow
- 29. D 23% $198 1.17 I 17% $198 1.17 Cash Flow Pattern Calculate the IRR, NPV@10%, and
- 30. Capital Rationing Capital Rationing occurs when a constraint (or budget ceiling) is placed on the total
- 31. Available Projects for BW Project ICO IRR NPV PI A $ 500 18% $ 50 1.10
- 32. Choosing by IRRs for BW Project ICO IRR NPV PI C $ 5,000 37% $ 5,500
- 33. Choosing by NPVs for BW Project ICO IRR NPV PI F $15,000 28% $21,000 2.40 G
- 34. Choosing by PIs for BW Project ICO IRR NPV PI F $15,000 28% $21,000 2.40 B
- 35. Summary of Comparison Method Projects Accepted Value Added PI F, B, C, and D $38,000 NPV
- 36. Single-Point Estimate and Sensitivity Analysis Allows us to change from “single-point” (i.e., revenue, installation cost, salvage,
- 37. Post-Completion Audit Post-completion Audit A formal comparison of the actual costs and benefits of a project
- 38. Multiple IRR Problem* Two!! There are as many potential IRRs as there are sign changes. Let
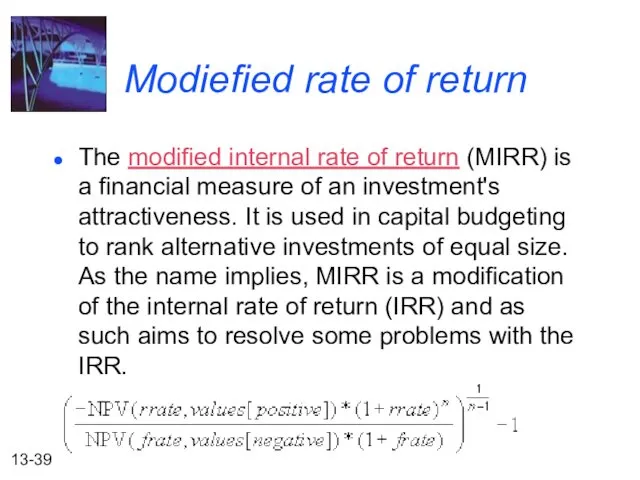
- 39. Modiefied rate of return The modified internal rate of return (MIRR) is a financial measure of
- 41. Скачать презентацию
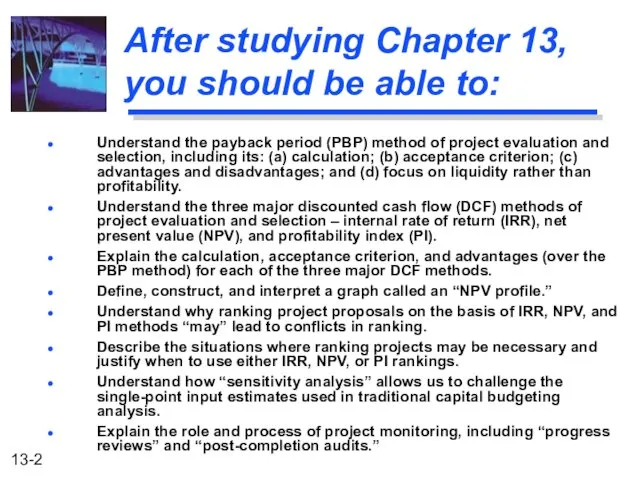
After studying Chapter 13, you should be able to:
Understand the payback
After studying Chapter 13, you should be able to:
Understand the payback
Capital Budgeting Techniques
Project Evaluation and Selection
Potential Difficulties
Capital Rationing
Capital Budgeting Techniques
Project Evaluation and Selection
Potential Difficulties
Capital Rationing
Project Evaluation: Alternative Methods
Payback Period (PBP)
Internal Rate of Return
Project Evaluation: Alternative Methods
Payback Period (PBP)
Internal Rate of Return
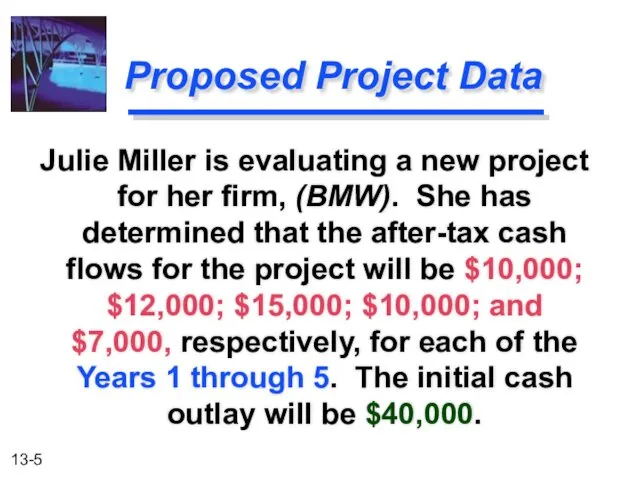
Proposed Project Data
Julie Miller is evaluating a new project for her
Proposed Project Data
Julie Miller is evaluating a new project for her
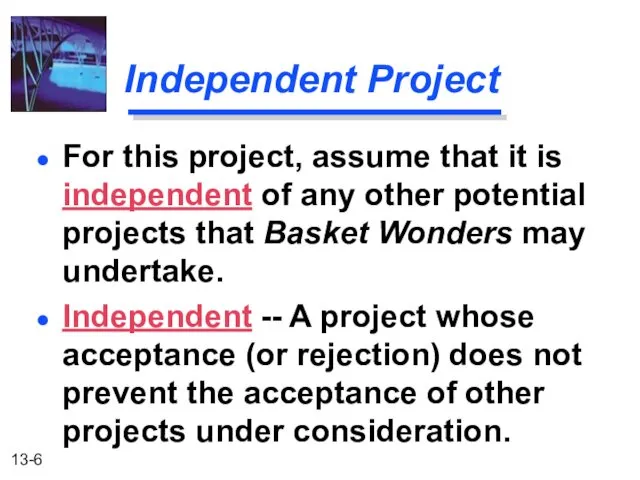
Independent Project
Independent -- A project whose acceptance (or rejection) does not
Independent Project
Independent -- A project whose acceptance (or rejection) does not
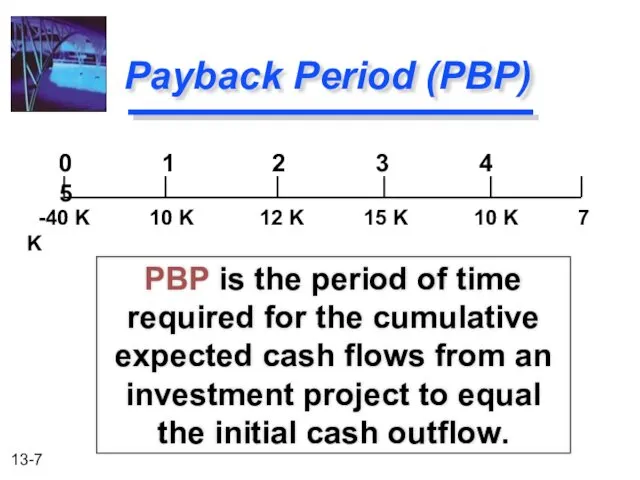
Payback Period (PBP)
PBP is the period of time required for the
Payback Period (PBP)
PBP is the period of time required for the
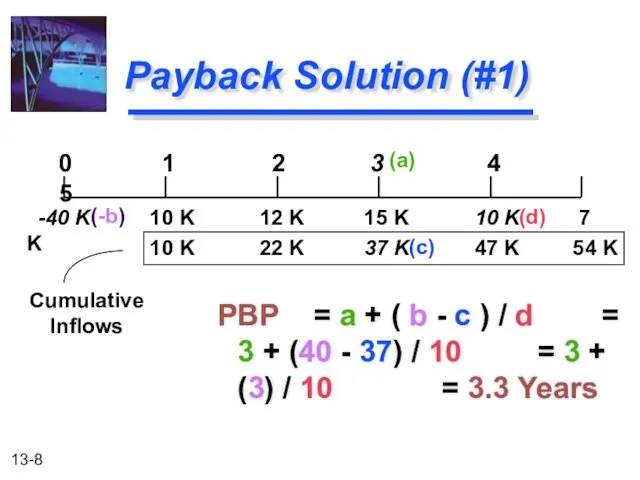
(c)
10 K 22 K 37 K 47 K 54 K
Payback Solution
(c)
10 K 22 K 37 K 47 K 54 K
Payback Solution
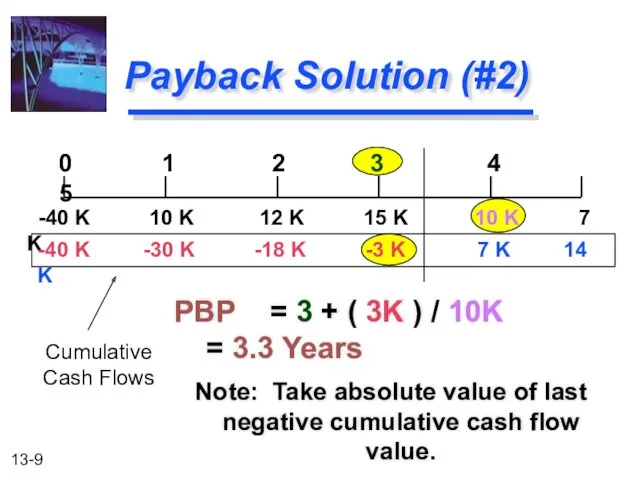
Payback Solution (#2)
PBP = 3 + ( 3K ) / 10K =
Payback Solution (#2)
PBP = 3 + ( 3K ) / 10K =
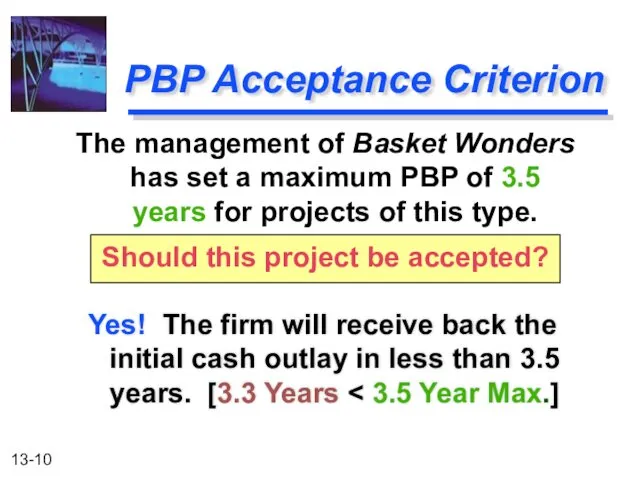
PBP Acceptance Criterion
Yes! The firm will receive back the initial cash
PBP Acceptance Criterion
Yes! The firm will receive back the initial cash
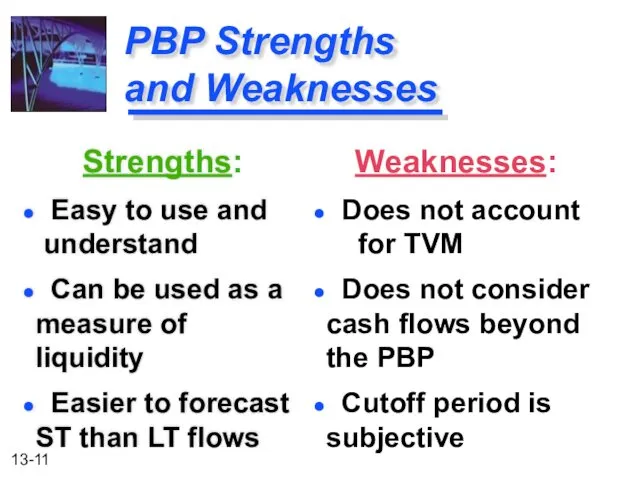
PBP Strengths
and Weaknesses
Strengths:
Easy to use and understand
Can be
PBP Strengths
and Weaknesses
Strengths:
Easy to use and understand
Can be
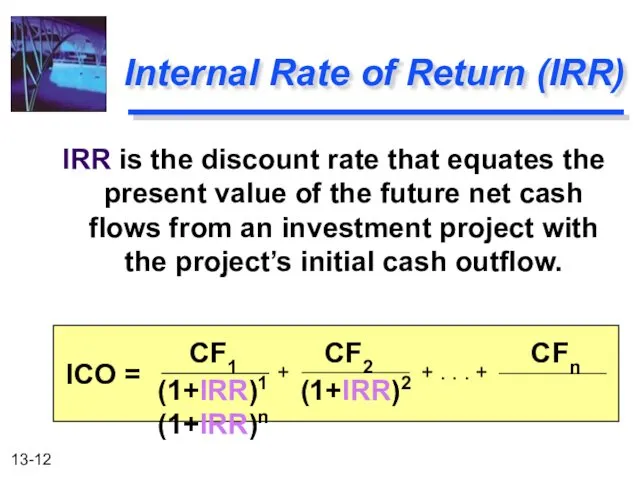
Internal Rate of Return (IRR)
IRR is the discount rate that equates
Internal Rate of Return (IRR)
IRR is the discount rate that equates
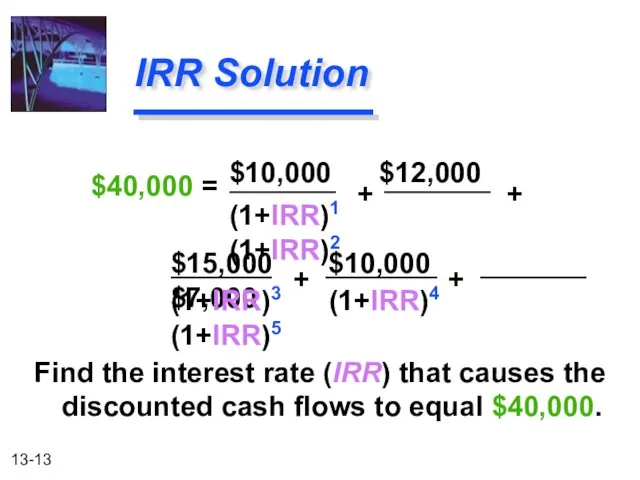
$15,000 $10,000 $7,000
IRR Solution
$10,000 $12,000
(1+IRR)1 (1+IRR)2
Find the interest rate (IRR)
$15,000 $10,000 $7,000
IRR Solution
$10,000 $12,000
(1+IRR)1 (1+IRR)2
Find the interest rate (IRR)
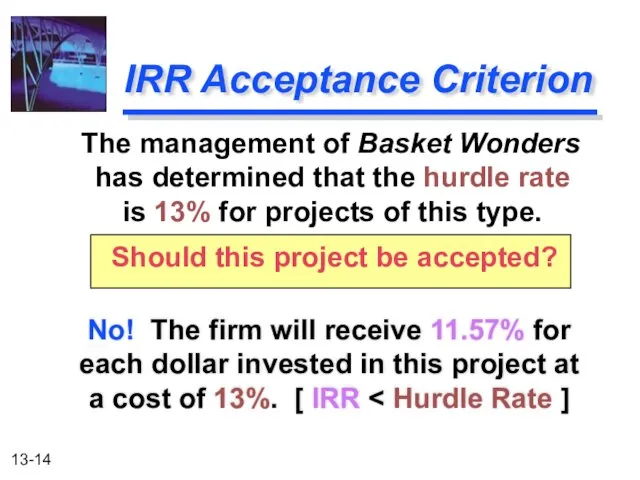
IRR Acceptance Criterion
No! The firm will receive 11.57% for each
IRR Acceptance Criterion
No! The firm will receive 11.57% for each
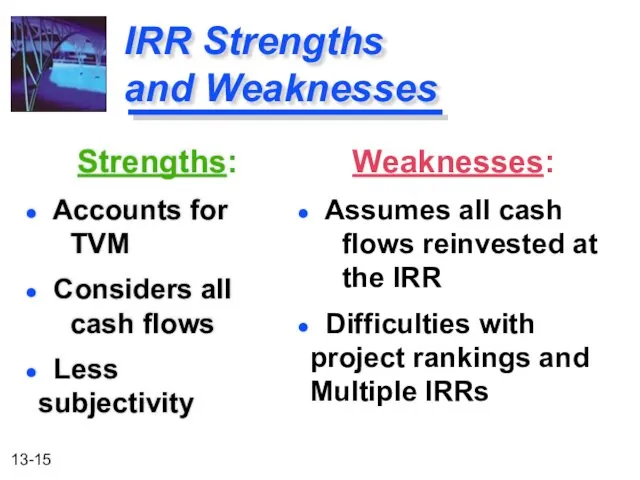
IRR Strengths
and Weaknesses
Strengths:
Accounts for TVM
Considers all
IRR Strengths
and Weaknesses
Strengths:
Accounts for TVM
Considers all
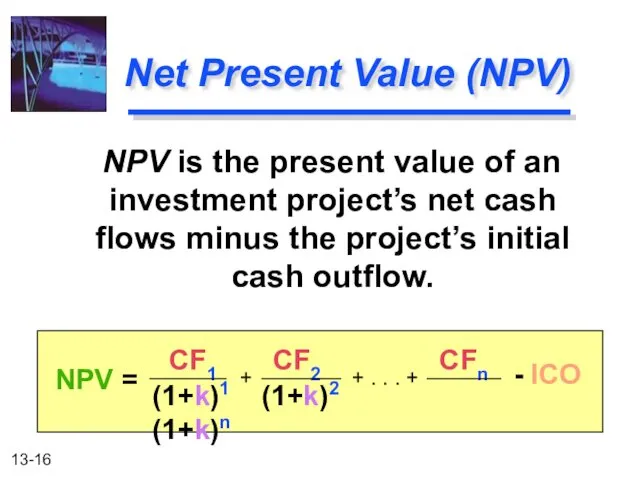
Net Present Value (NPV)
NPV is the present value of an
Net Present Value (NPV)
NPV is the present value of an
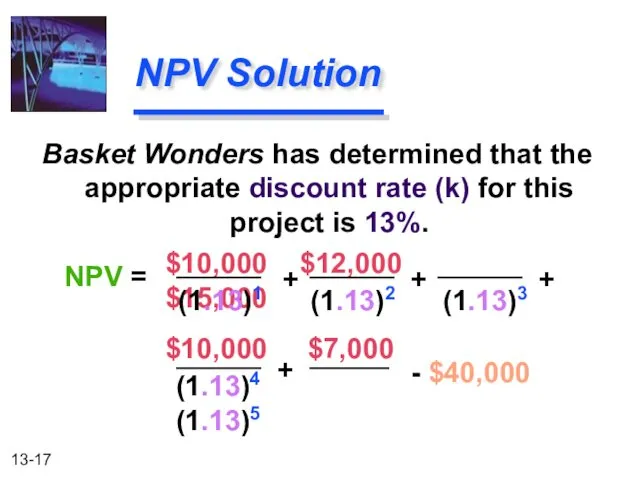
Basket Wonders has determined that the appropriate discount rate (k) for
Basket Wonders has determined that the appropriate discount rate (k) for
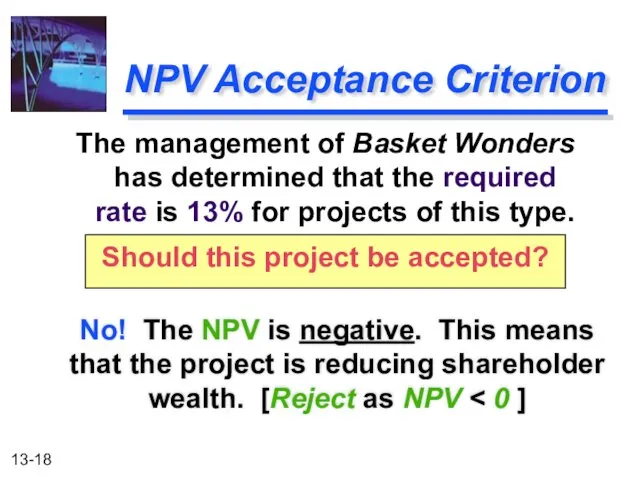
NPV Acceptance Criterion
No! The NPV is negative. This means that
NPV Acceptance Criterion
No! The NPV is negative. This means that
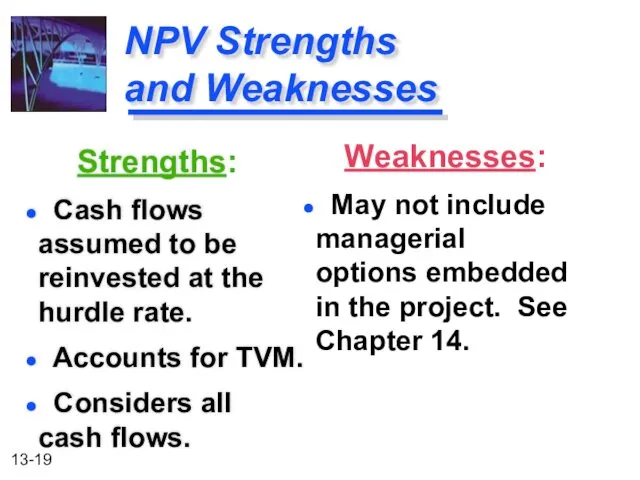
NPV Strengths
and Weaknesses
Strengths:
Cash flows assumed to be reinvested
NPV Strengths
and Weaknesses
Strengths:
Cash flows assumed to be reinvested
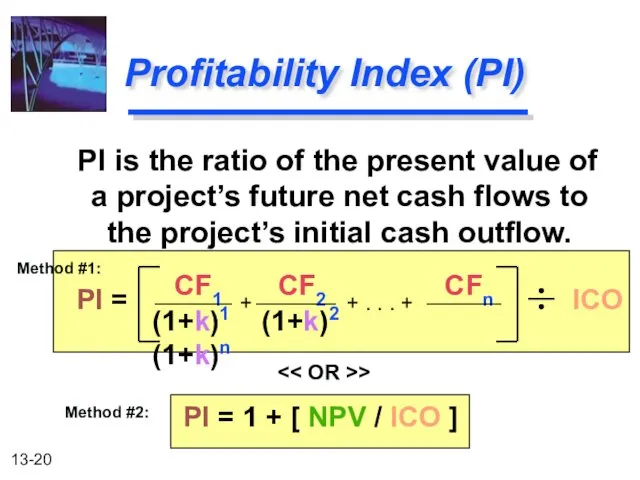
Profitability Index (PI)
PI is the ratio of the present value
Profitability Index (PI)
PI is the ratio of the present value
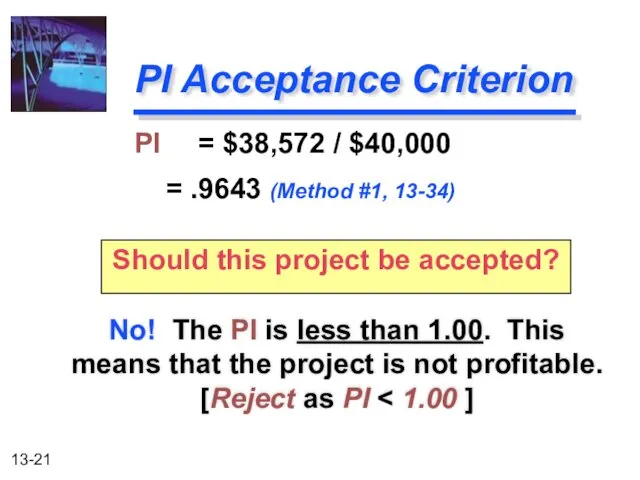
PI Acceptance Criterion
No! The PI is less than 1.00.
PI Acceptance Criterion
No! The PI is less than 1.00.
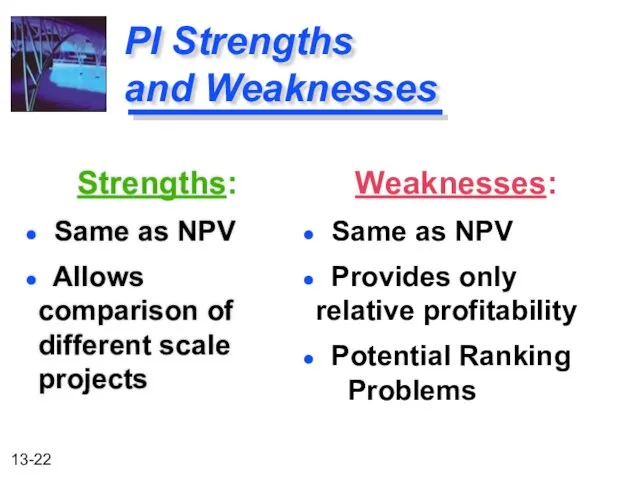
PI Strengths
and Weaknesses
Strengths:
Same as NPV
Allows comparison of
PI Strengths
and Weaknesses
Strengths:
Same as NPV
Allows comparison of
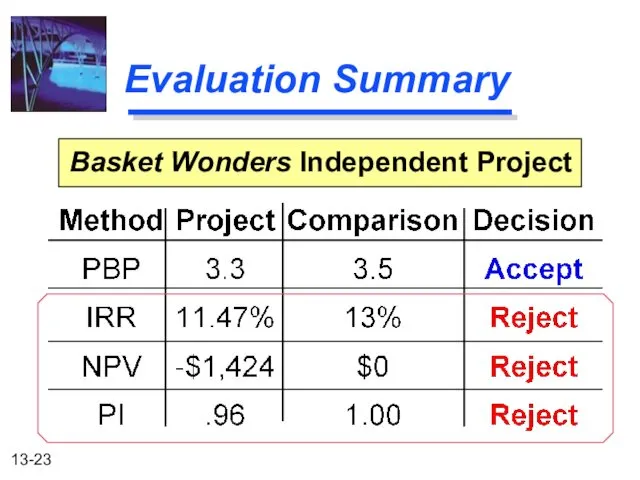
Evaluation Summary
Basket Wonders Independent Project
Evaluation Summary
Basket Wonders Independent Project

Other Project Relationships
Mutually Exclusive -- A project whose acceptance precludes the
Other Project Relationships
Mutually Exclusive -- A project whose acceptance precludes the
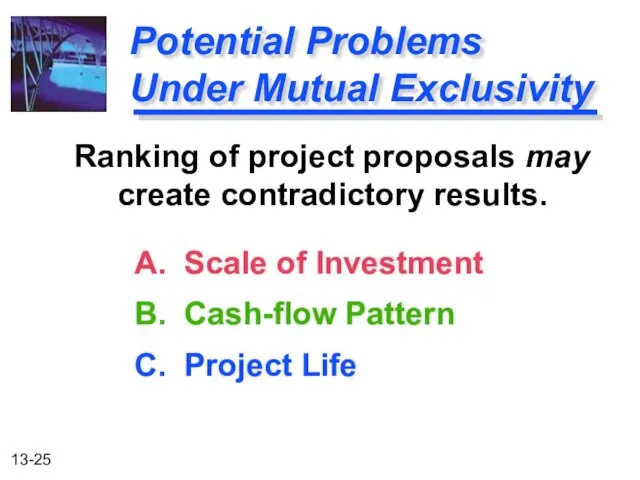
Potential Problems
Under Mutual Exclusivity
A. Scale of Investment
B. Cash-flow Pattern
C. Project
Potential Problems
Under Mutual Exclusivity
A. Scale of Investment
B. Cash-flow Pattern
C. Project
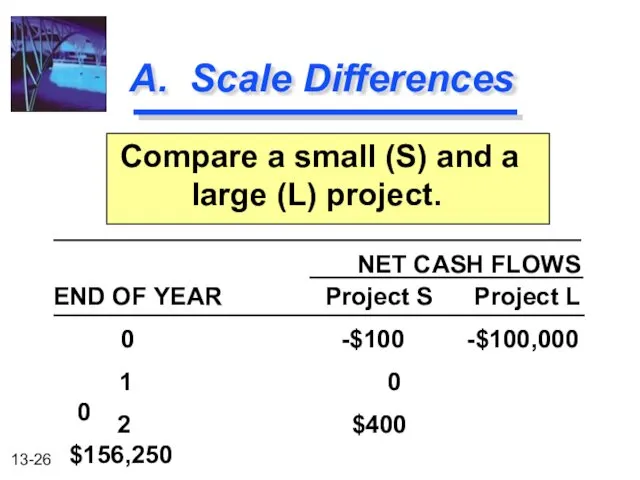
A. Scale Differences
Compare a small (S) and a large (L)
A. Scale Differences
Compare a small (S) and a large (L)
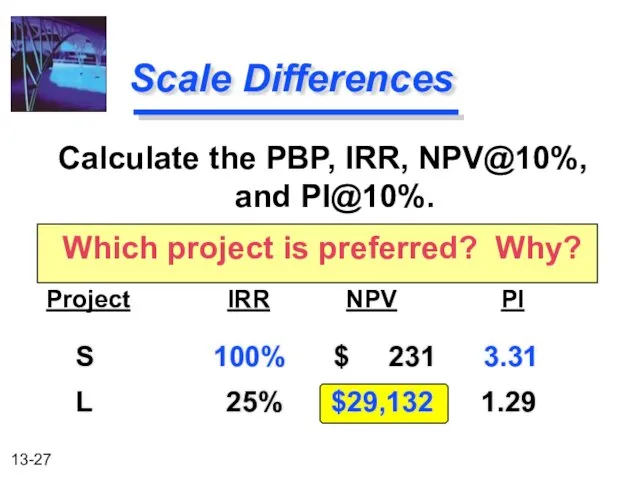
Scale Differences
Calculate the PBP, IRR, NPV@10%, and PI@10%.
Which project is preferred?
Scale Differences
Calculate the PBP, IRR, NPV@10%, and PI@10%.
Which project is preferred?
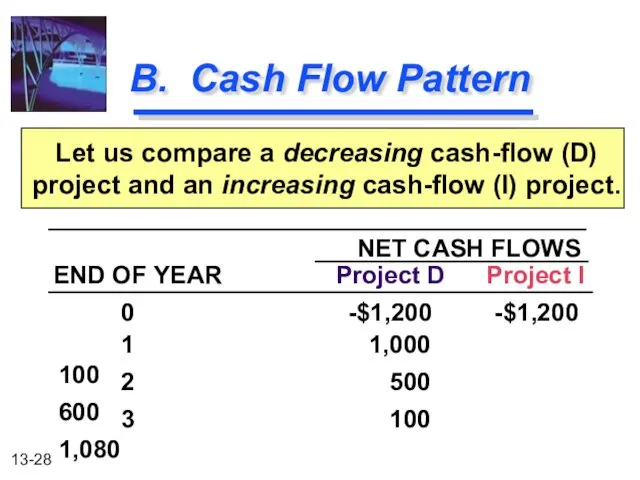
B. Cash Flow Pattern
Let us compare a decreasing cash-flow (D) project
B. Cash Flow Pattern
Let us compare a decreasing cash-flow (D) project
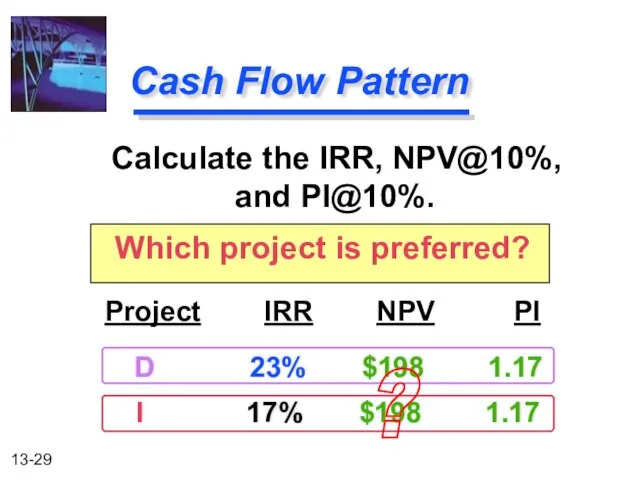
D 23% $198 1.17
I 17% $198 1.17
Cash Flow Pattern
D 23% $198 1.17
I 17% $198 1.17
Cash Flow Pattern
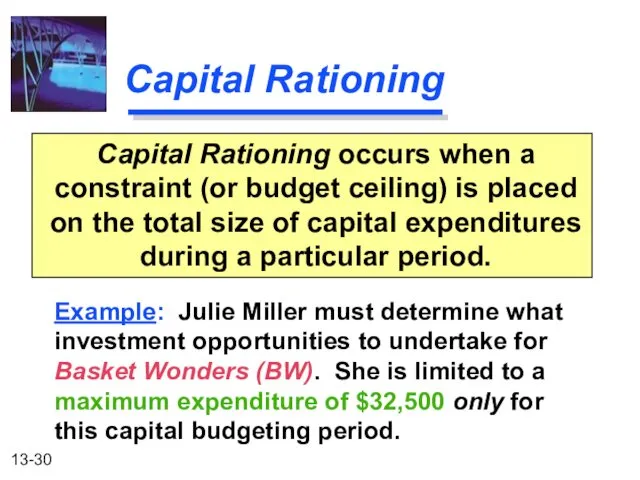
Capital Rationing
Capital Rationing occurs when a constraint (or budget ceiling) is
Capital Rationing
Capital Rationing occurs when a constraint (or budget ceiling) is
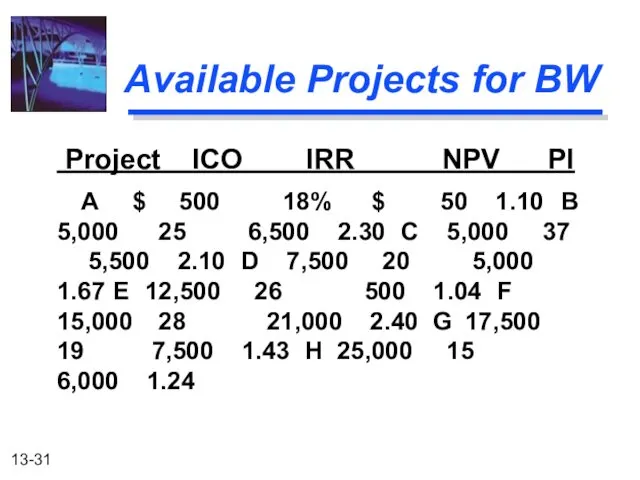
Available Projects for BW
Project ICO IRR NPV PI
A $ 500
Available Projects for BW
Project ICO IRR NPV PI
A $ 500
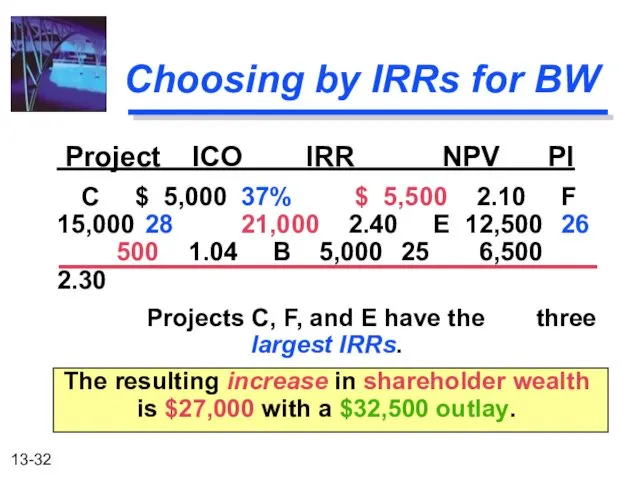
Choosing by IRRs for BW
Project ICO IRR NPV PI
C $
Choosing by IRRs for BW
Project ICO IRR NPV PI
C $
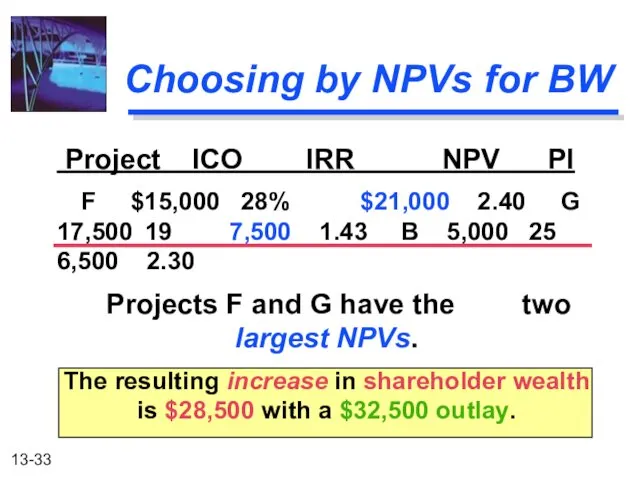
Choosing by NPVs for BW
Project ICO IRR NPV PI
F
Choosing by NPVs for BW
Project ICO IRR NPV PI
F
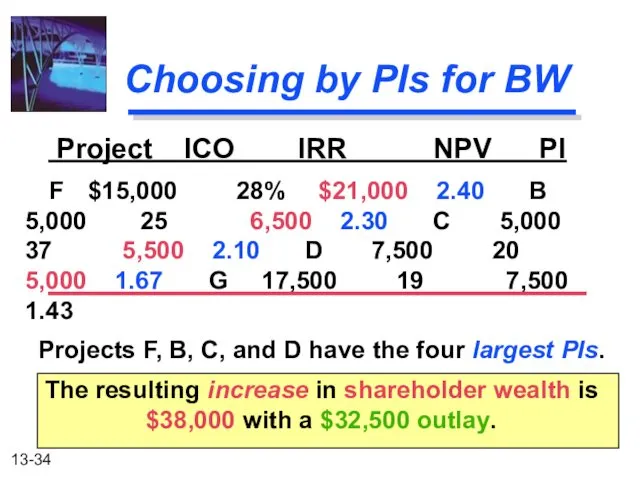
Choosing by PIs for BW
Project ICO IRR NPV PI
F
Choosing by PIs for BW
Project ICO IRR NPV PI
F
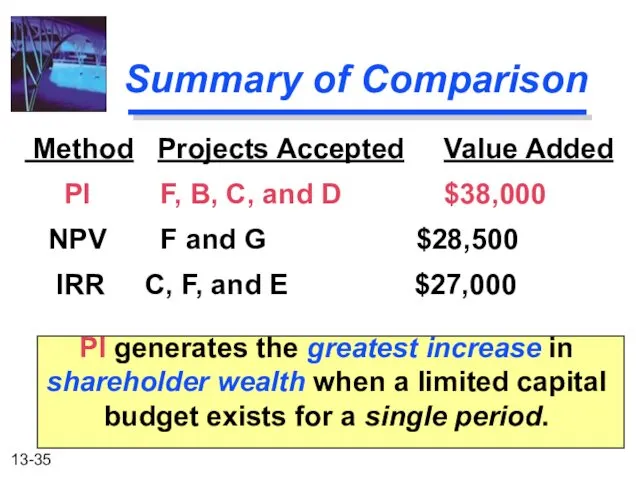
Summary of Comparison
Method Projects Accepted Value Added
PI F, B,
Summary of Comparison
Method Projects Accepted Value Added
PI F, B,
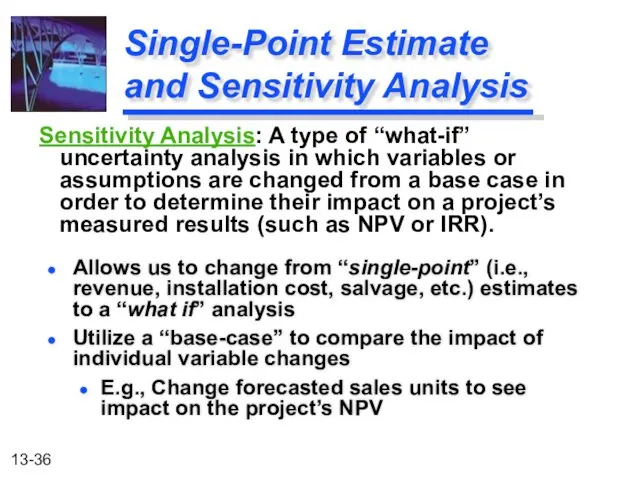
Single-Point Estimate and Sensitivity Analysis
Allows us to change from “single-point” (i.e.,
Single-Point Estimate and Sensitivity Analysis
Allows us to change from “single-point” (i.e.,
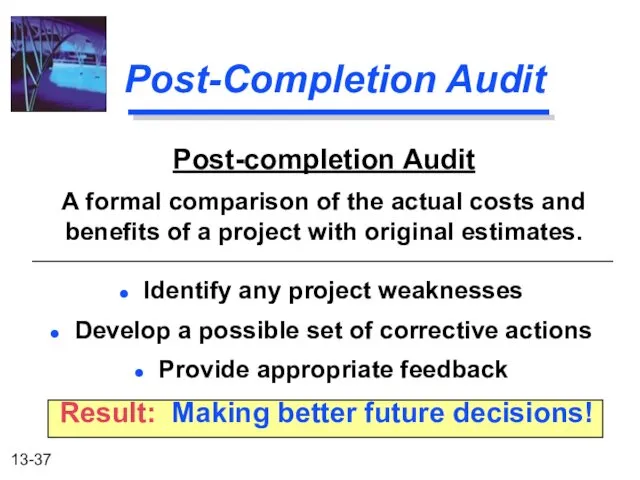
Post-Completion Audit
Post-completion Audit
A formal comparison of the actual costs and benefits
Post-Completion Audit
Post-completion Audit
A formal comparison of the actual costs and benefits
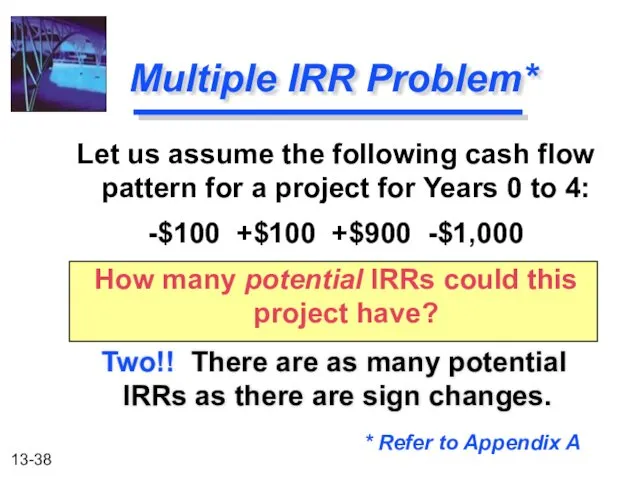
Multiple IRR Problem*
Two!! There are as many potential IRRs as
Multiple IRR Problem*
Two!! There are as many potential IRRs as
Modiefied rate of return
The modified internal rate of return (MIRR) is a financial
Modiefied rate of return
The modified internal rate of return (MIRR) is a financial
 Банковские гарантии
 Выбор аудиторской компании клиентами
 Страхування відповідальності та його види
 План финансово-хозяйственной деятельности, отчеты по исполнению ПФХД
 Банківське право України. Поняття, предмет регулювання, джерела і система
 Финансовый рынок
 Направления улучшения использования основных средств предприятия (на примере ООО АГРОФИРА Тысячный, Краснодарский край)
 Фундаментальный анализ финансовых рынков
 Функции международного финансового рынка, его структура и участники
 Налог на добавленную стоимость
 Джерела фінансової інформації та оцінка фінансово-майнового стану фірми
 Қаржы тұрақтылығын талдау
 Денежные реформы
 Некоторые вопросы по ГК, б/у и н/о
 Производственные возможности. Кривая производственных возможностей
 Программа страхования детей Дети
 O’zbekistonda lizing xizmatlari
 Анализ современных тенденций деятельности бюро кредитных историй
 Оценка недвижимости. Практический семинар
 Реализация Стратегии повышения финансовой грамотности в Новгородской области
 Підвищення пенсійних виплат з 1 травня 2017 року
 Фундаментальный анализ
 Социальное страхование
 Кәсіпорынның табыстылығын диверсификациялау мәселелері
 Сервисы
 The bank and the banking system
 Javne finansije. Lekcija 7
 Страхование в России