- Principles of Business Finance. Lecture 2: Financial Statements

Содержание
- 2. Sunset Boards, Inc. You are required to prepare the following:- An income statement for 2015 and
- 3. Learning Outcomes By the end of this lecture, you should be able to:- know the balance
- 4. Exhibit 3.1: Diaz Mfg. Balance Sheets
- 5. The Balance Sheet Reports the firm’s financial position at a particular point in time. Assets: Liabilities:
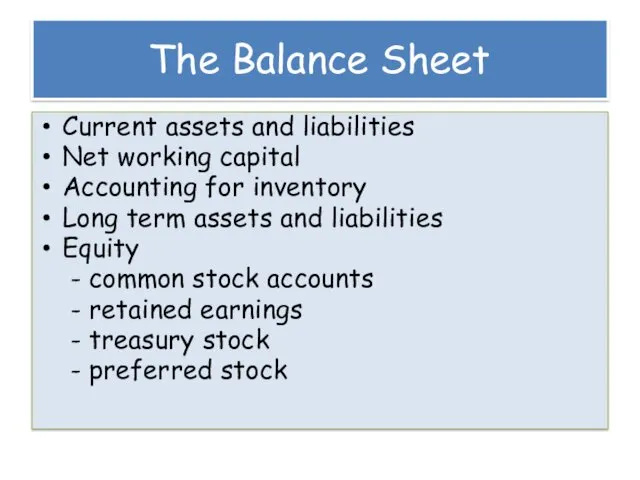
- 6. The Balance Sheet Current assets and liabilities Net working capital Accounting for inventory Long term assets
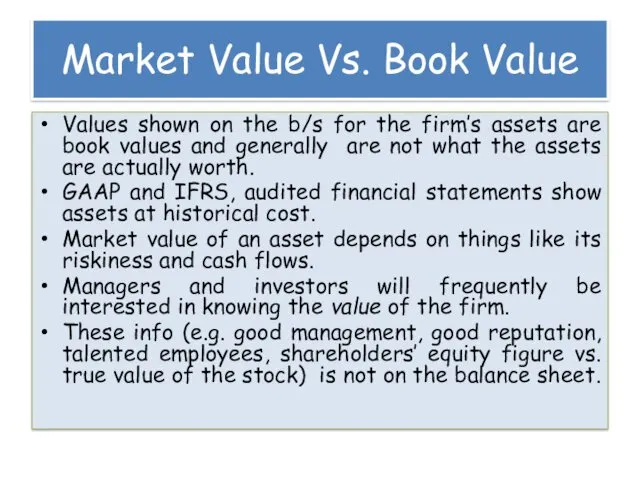
- 7. Market Value Vs. Book Value Values shown on the b/s for the firm’s assets are book
- 8. A More Informative Balance Sheet Assets Liabilities Stockholders’ equity
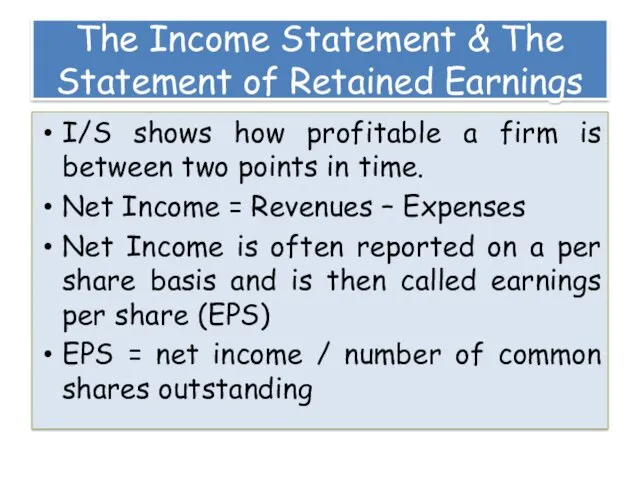
- 9. The Income Statement & The Statement of Retained Earnings I/S shows how profitable a firm is
- 10. Exhibit 3.2: Diaz Mfg. Income Statements
- 11. Expense Categories Depreciation expense Amortization expense Extraordinary items
- 12. The Statement of Retained Earnings Two events that affect the retained earnings account balance:- Firm reports
- 13. Cash Flows Goal of financial management is to maximize the value of stockholders’ shares which means
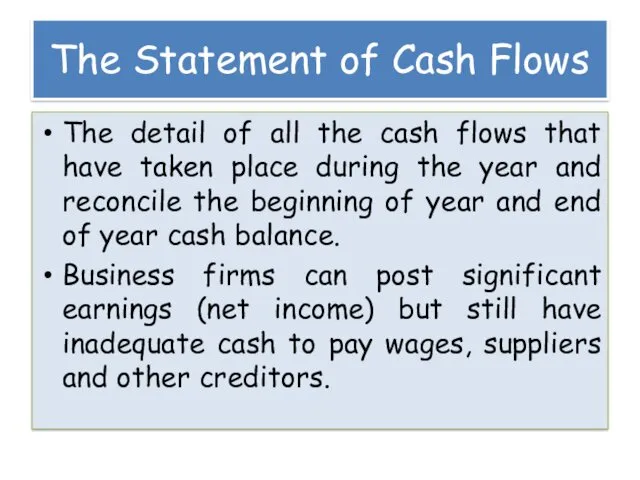
- 14. The Statement of Cash Flows The detail of all the cash flows that have taken place
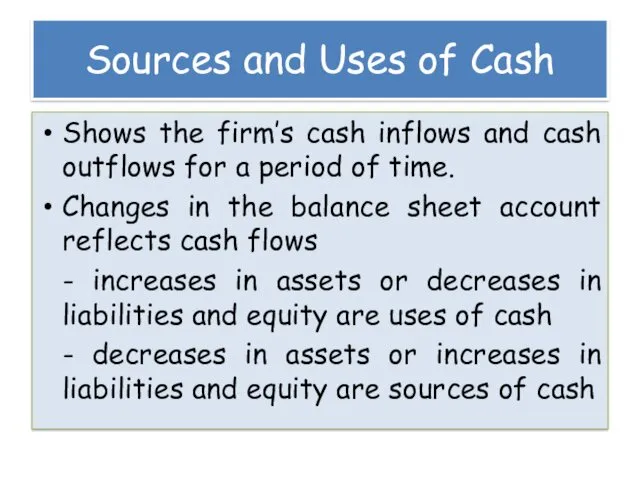
- 15. Sources and Uses of Cash Shows the firm’s cash inflows and cash outflows for a period
- 16. Let’s try this… Increase of CA Increase of CL Increase of FA Decrease of FA Increase
- 17. Sources and Uses of Cash Working capital Fixed assets Long term liabilities and equity Dividends
- 18. Organization of the Statement of Cash Flows The statement of cash flows is organized around 3
- 19. Exhibit 3.4: Diaz Mfg Statement of Cash Flows
- 20. Exhibit 3.5: Interrelations among the Financial Statements
- 21. Taxes The one thing we can rely on with taxes is that they are always changing
- 22. Cash Flow Cash Flow From Assets (CFFA) = Cash Flow to Creditors + Cash Flow to
- 23. Asia-Pacific Corporation Balance Sheet
- 24. Asia-Pacific Corporation Income Statement
- 25. Example: US Corporation – Part I OCF (I/S) = EBIT + depreciation – taxes = NCS
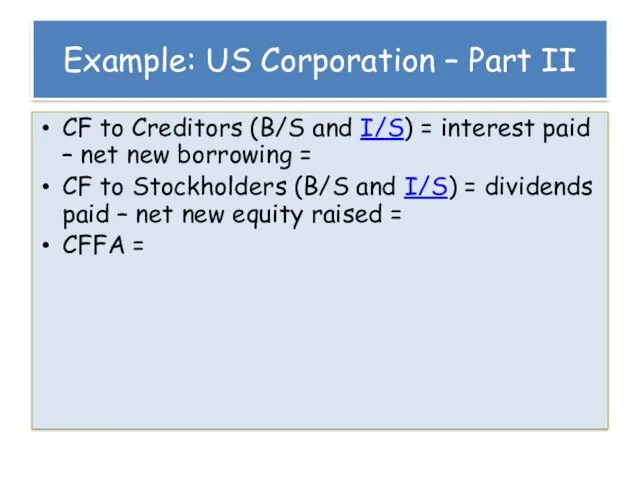
- 26. Example: US Corporation – Part II CF to Creditors (B/S and I/S) = interest paid –
- 27. Cash Flow Summary - Table 2.6
- 29. Скачать презентацию
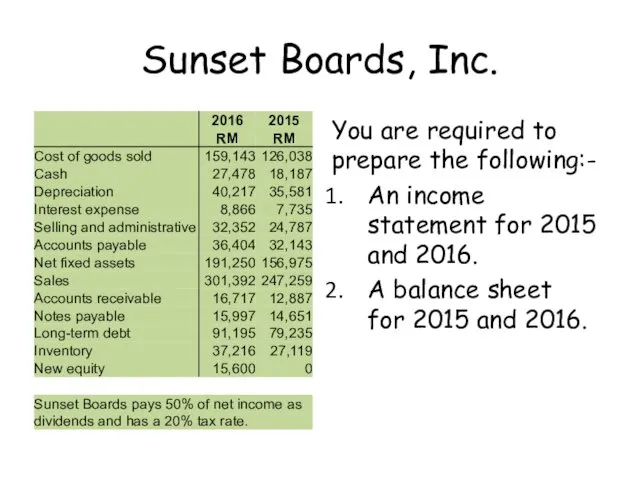
Sunset Boards, Inc.
You are required to prepare the following:-
An income statement
Sunset Boards, Inc.
You are required to prepare the following:-
An income statement
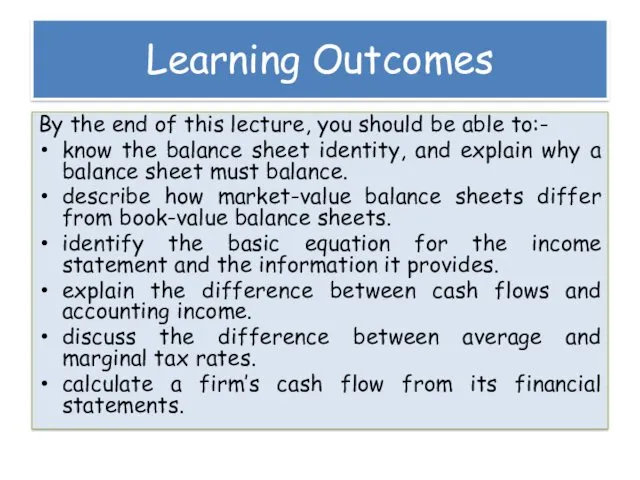
Learning Outcomes
By the end of this lecture, you should be able
Learning Outcomes
By the end of this lecture, you should be able
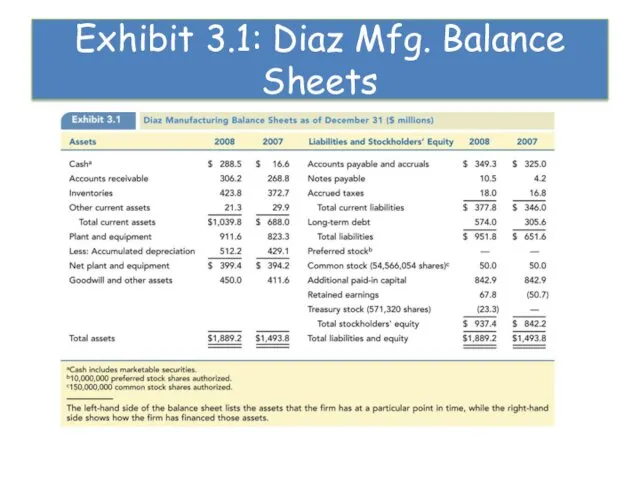
Exhibit 3.1: Diaz Mfg. Balance Sheets
Exhibit 3.1: Diaz Mfg. Balance Sheets
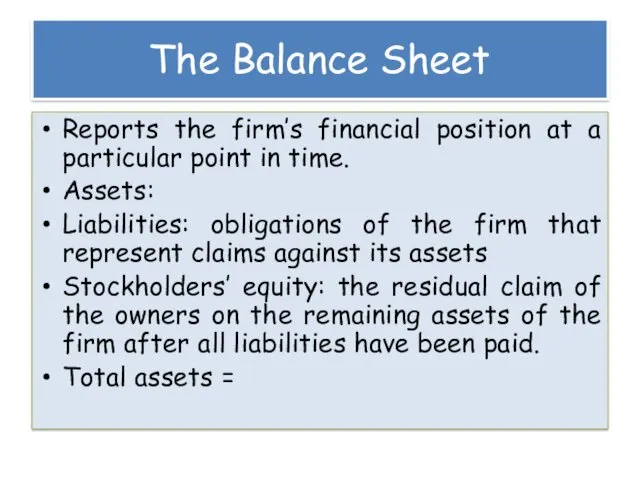
The Balance Sheet
Reports the firm’s financial position at a particular point
The Balance Sheet
Reports the firm’s financial position at a particular point
The Balance Sheet
Current assets and liabilities
Net working capital
Accounting for inventory
Long term
The Balance Sheet
Current assets and liabilities
Net working capital
Accounting for inventory
Long term
Market Value Vs. Book Value
Values shown on the b/s for the
Market Value Vs. Book Value
Values shown on the b/s for the
A More Informative Balance Sheet
Assets
Liabilities
Stockholders’ equity
A More Informative Balance Sheet
Assets
Liabilities
Stockholders’ equity
The Income Statement & The Statement of Retained Earnings
I/S shows how
The Income Statement & The Statement of Retained Earnings
I/S shows how
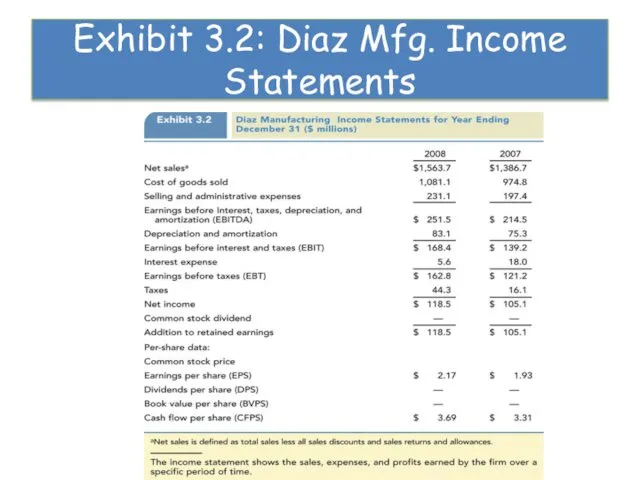
Exhibit 3.2: Diaz Mfg. Income Statements
Exhibit 3.2: Diaz Mfg. Income Statements
Expense Categories
Depreciation expense
Amortization expense
Extraordinary items
Expense Categories
Depreciation expense
Amortization expense
Extraordinary items
The Statement of Retained Earnings
Two events that affect the retained
earnings account
The Statement of Retained Earnings
Two events that affect the retained
earnings account
Cash Flows
Goal of financial management is to maximize the value of
Cash Flows
Goal of financial management is to maximize the value of
The Statement of Cash Flows
The detail of all the cash flows
The Statement of Cash Flows
The detail of all the cash flows
Sources and Uses of Cash
Shows the firm’s cash inflows and cash
Sources and Uses of Cash
Shows the firm’s cash inflows and cash
Let’s try this…
Increase of CA
Increase of CL
Increase of FA
Decrease of FA
Increase
Let’s try this…
Increase of CA
Increase of CL
Increase of FA
Decrease of FA
Increase
Sources and Uses of Cash
Working capital
Fixed assets
Long term liabilities and equity
Dividends
Sources and Uses of Cash
Working capital
Fixed assets
Long term liabilities and equity
Dividends
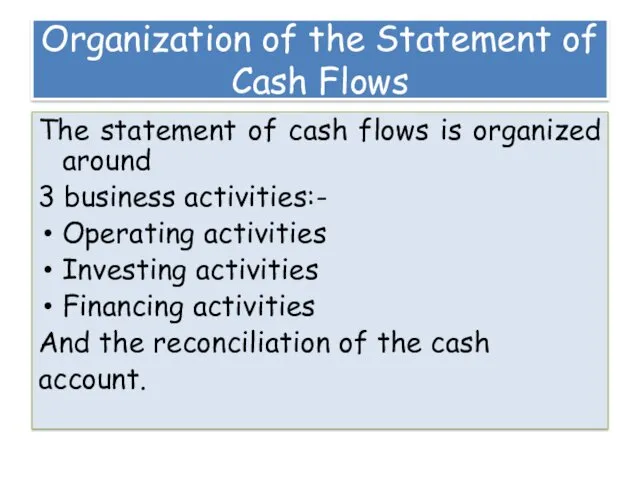
Organization of the Statement of Cash Flows
The statement of cash flows
Organization of the Statement of Cash Flows
The statement of cash flows
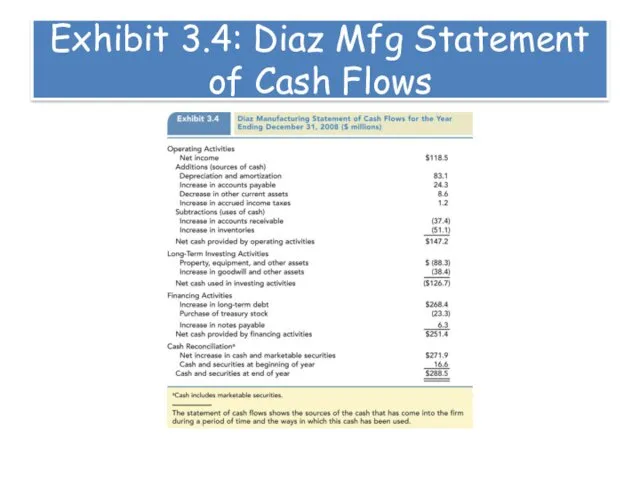
Exhibit 3.4: Diaz Mfg Statement of Cash Flows
Exhibit 3.4: Diaz Mfg Statement of Cash Flows
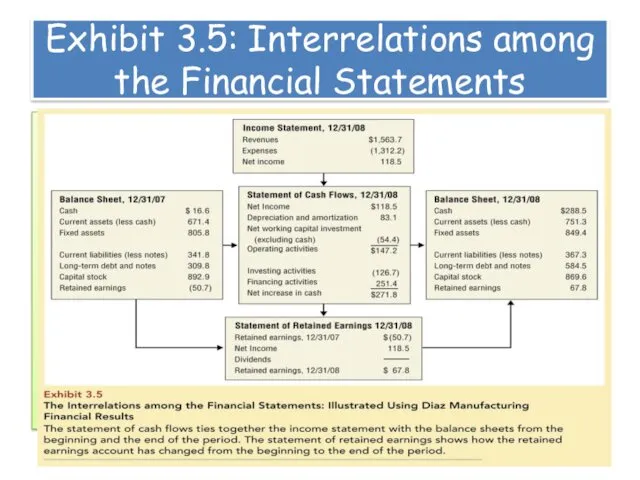
Exhibit 3.5: Interrelations among the Financial Statements
Exhibit 3.5: Interrelations among the Financial Statements
Taxes
The one thing we can rely on with taxes is that
Taxes
The one thing we can rely on with taxes is that
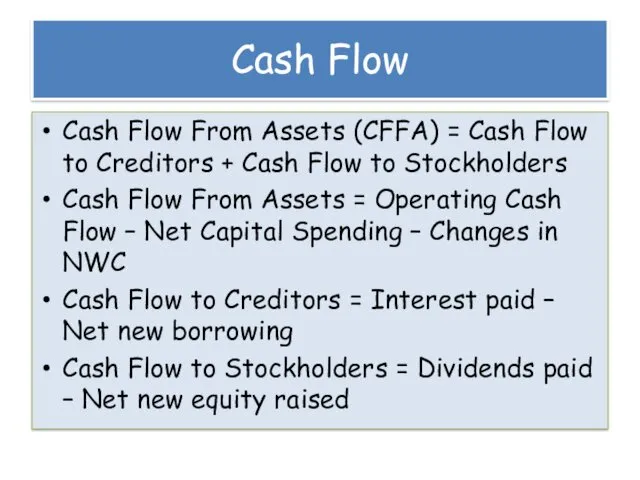
Cash Flow
Cash Flow From Assets (CFFA) = Cash Flow to Creditors
Cash Flow
Cash Flow From Assets (CFFA) = Cash Flow to Creditors
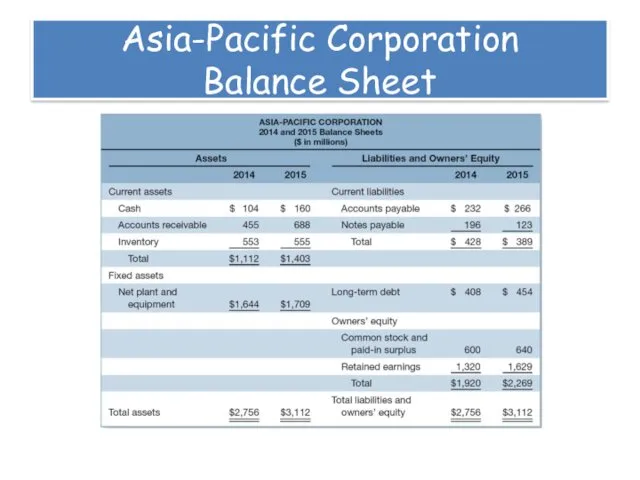
Asia-Pacific Corporation
Balance Sheet
Asia-Pacific Corporation
Balance Sheet
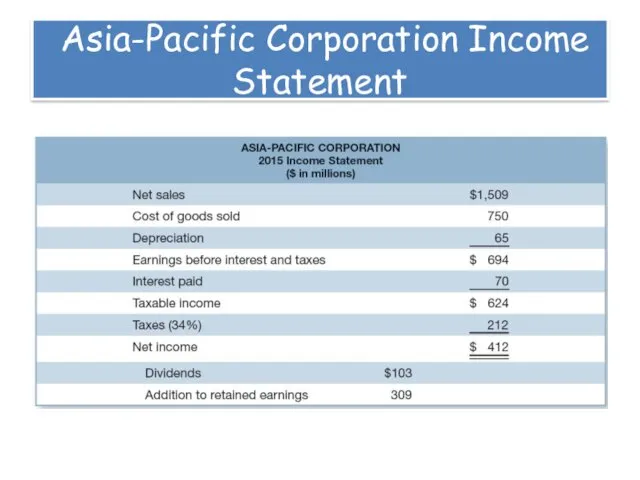
Asia-Pacific Corporation Income Statement
Asia-Pacific Corporation Income Statement
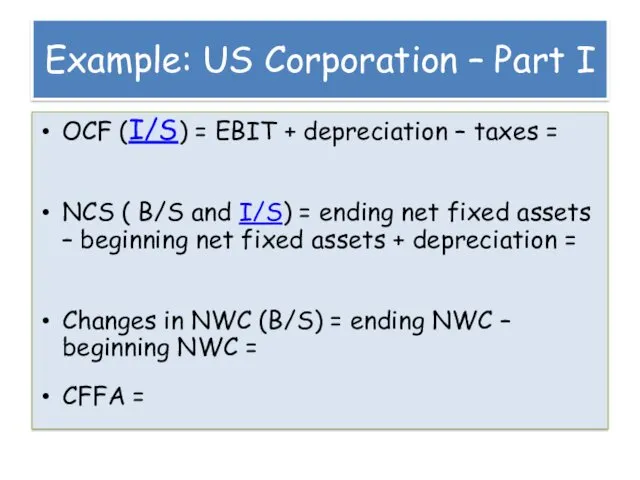
Example: US Corporation – Part I
OCF (I/S) = EBIT + depreciation
Example: US Corporation – Part I
OCF (I/S) = EBIT + depreciation
Example: US Corporation – Part II
CF to Creditors (B/S and I/S)
Example: US Corporation – Part II
CF to Creditors (B/S and I/S)
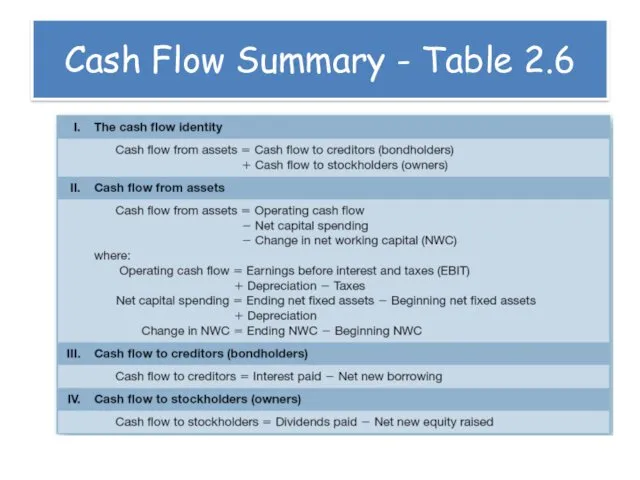
Cash Flow Summary - Table 2.6
Cash Flow Summary - Table 2.6
 Менеджмент капитала банка
 Banking
 Газпромбанк (Акционерное общество)
 Этика. Профессиональная этика
 Взаимоотношения с инвесторами. Вебинар
 Финансовый анализ ПАО “КАМАЗ“
 Новые полномочия финансового органа по контролю в сфере закупок, вступающие в силу с 1 января 2017 года
 Организация бухгалтерского учета на предприятии
 Концепции финансового менеджмента. (Лекция 2)
 Доходы и расходы семейного бюджета
 Акционерное общество Первоуральский акционерный коммерческий банк
 Задачі. Фінансові інвестиції
 Управление государственными и муниципальными закупками в системе образования
 Управління капіталом підприємства
 Денежный оборот. Масса и скорость
 Налоговые службы Костромской области
 Расходы предприятия, себестоимость продукции
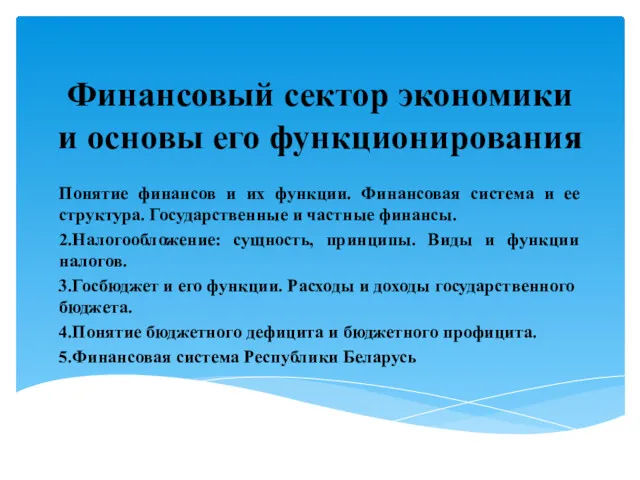 Финансовый сектор экономики и основы его функционирования
 Учет и анализ расчетов с покупателями и заказчиками
 Государственная поддержка малого бизнеса в России
 Қысқа мерзімдегі фирманың шығындар
 Венчурный бизнес. Специфика рискового финансирования
 Налоговое право. Налоговые органы. Виды налогов
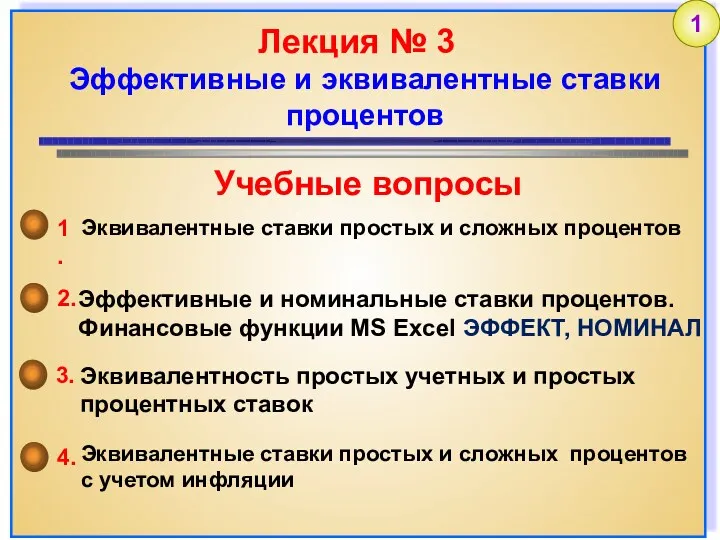 Эффективные и эквивалентные ставки процентов
 Организация финансовой деятельности
 Учет материально-производственных запасов
 Основы бизнес-планирования
 Направления улучшения использования основных средств предприятия (на примере ООО АГРОФИРА Тысячный, Краснодарский край)