Methods of comparable data obtaining. Currency conversion. Average annual exchange rate. The purchasing power parity презентация
- Methods of comparable data obtaining. Currency conversion. Average annual exchange rate. The purchasing power parity

Содержание
- 2. Methods of comparable data obtaining Currency conversion Average annual exchange rate The purchasing power parity Market
- 3. PPP (purchasing power parity) A Prototype Is The "Big Mac" Тимофеева А.А. 2018 ©
- 4. 3200 main consumer of goods and services 236 main investment products 16 typical construction projects Тимофеева
- 5. When PPP? Cross-country comparisons Rational allocation of limited funds (quotas of the IMF) The identification of
- 6. Сomparable price level Тимофеева А.А. 2018 ©
- 7. Price level ratio of PPP conversion factor (GDP) to market exchange rate Тимофеева А.А. 2018 ©
- 8. Тимофеева А.А. 2018 © List by the International Monetary Fund (Estimates for 2017)
- 9. Тимофеева А.А. 2018 © Proportion of countries by GDP PPP China USA India Japan Germany Russia
- 10. Сlassification of the countries
- 11. 195 countries, 72 dependent areas Country = economy ≠ state The number of States and dependent
- 12. Signs of dependent areas Advantages for mother-country Advantages for dependent area
- 13. Group of countries Developed countries Developing countries Transition economy(?) 5
- 14. Criteria: The nature of the economy The level of socio-economic development 6
- 15. Sectoral structure of GDP as an indicator of the level of socio-economic development The level and
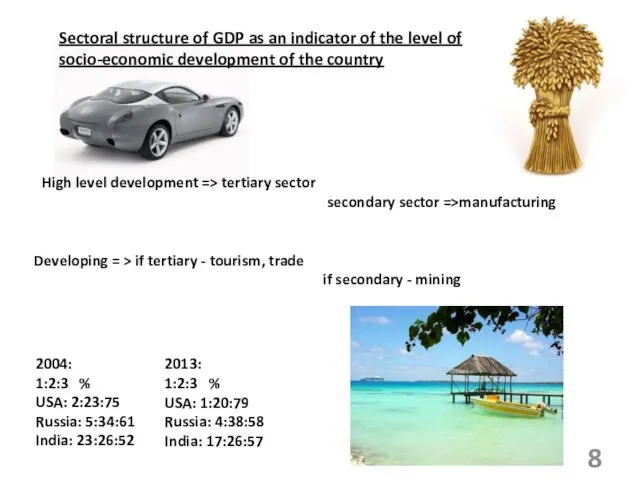
- 16. Sectoral structure of GDP as an indicator of the level of socio-economic development of the country
- 17. The level and quality of life Lifespan The incidence Personal safety Natural environment Unemployment Consumption Human
- 18. ИРЧП 2013 Russia – 50, 0,798
- 19. World map indicating the Human Development Index (based on 2014 data, published on December 14, 2015)
- 20. Approximate characteristics of developed countries 1) GDP per capita is on average about 30 thousand dollars
- 21. 4) Evolution towards domination of the industry and the trend of transformation of the industrial economy
- 22. 7) Business structure is non-uniform. The leading role in the economy belongs to powerful corporations –
- 23. 9) The state of developed countries is an active participant in economic activity Approximate characteristics of
- 24. 10) The openness to the world economy and the liberal organization of the foreign trade regime
- 25. Countries with economies in transition: The former socialist countries of Central and Eastern Europe: Albania, Bulgaria,
- 26. The term "transition economy" is used to describe the transformation of the socialist economy to the
- 27. Exemplary characteristics of developing countries The low level of socio-economic development 1) Suppliers of raw materials
- 28. 5) The agricultural profile of the economy and the share of the population employed in agriculture
- 29. The classification of the International Monetary Fund 2 groups of countries Major industrialized country, or "Big
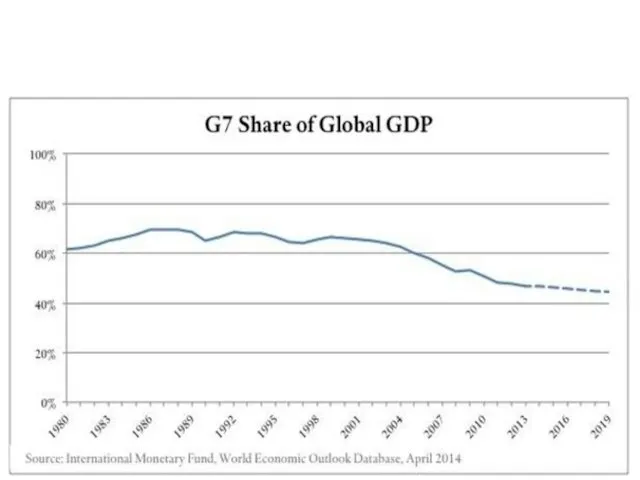
- 30. Major industrialized country, or "Big seven" ? 11.4% of the population 50% of the WGDP 42,3%
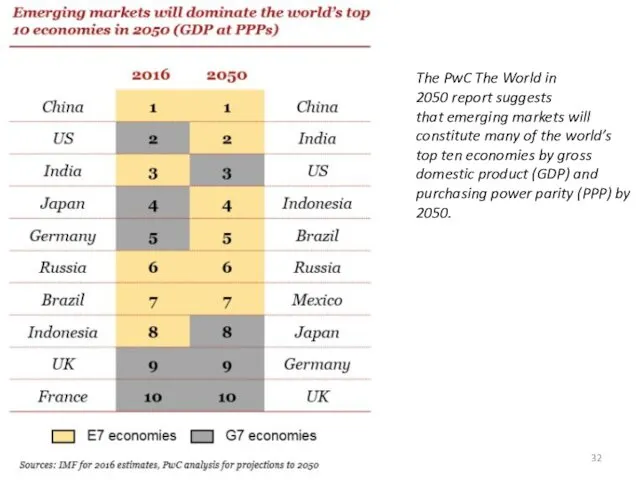
- 32. Тимофеева А.А. 2018 © The PwC The World in 2050 report suggests that emerging markets will
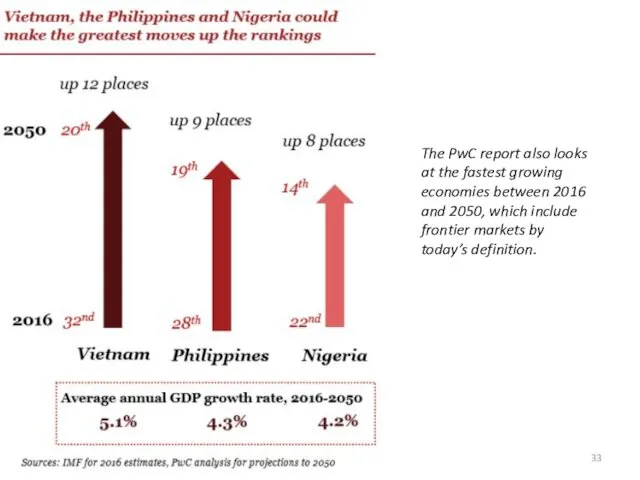
- 33. Тимофеева А.А. 2018 © The PwC report also looks at the fastest growing economies between 2016
- 34. Тимофеева А.А. 2018 ©
- 35. Тимофеева А.А. 2018 ©
- 36. Тимофеева А.А. 2018 © Challenges for policymakers Protectionism Benefits of globalisation ⬄ equity Green technologies
- 37. Тимофеева А.А. 2018 © Opportunities for business : Mature emerging markets (costs, consumers, B2B)
- 38. «Other emerging market and developing countries» 146 countries, 85% of the population, 60% of the WGDP,
- 39. Sub-group "Other emerging market and developing countries" exporters of liquid fuel; b) exporters of other raw
- 40. The classification of the world Bank GNI per capita 3 groups: Countries with low income Crane
- 41. 207 countries
- 42. The state of external debt Poor countries with largest external debt Countries with moderate debt Countries
- 47. 2015
- 52. Скачать презентацию
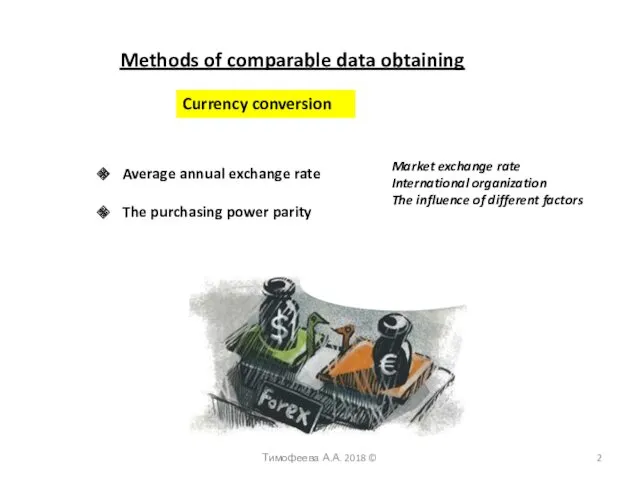
Methods of comparable data obtaining
Currency conversion
Average annual exchange rate
The purchasing power
Methods of comparable data obtaining
Currency conversion
Average annual exchange rate
The purchasing power
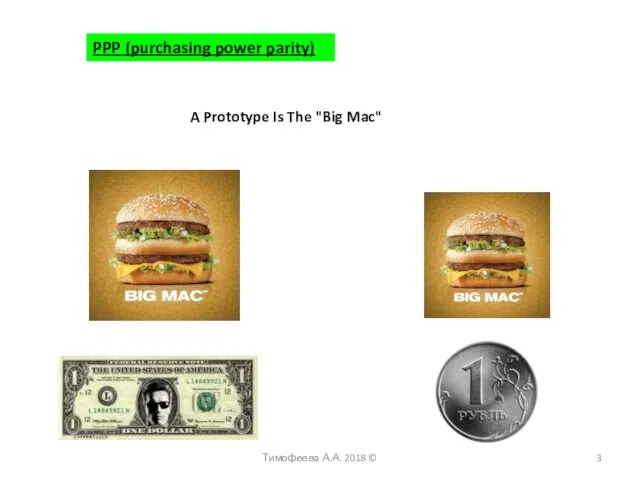
PPP (purchasing power parity)
A Prototype Is The "Big Mac"
Тимофеева А.А. 2018
PPP (purchasing power parity)
A Prototype Is The "Big Mac"
Тимофеева А.А. 2018
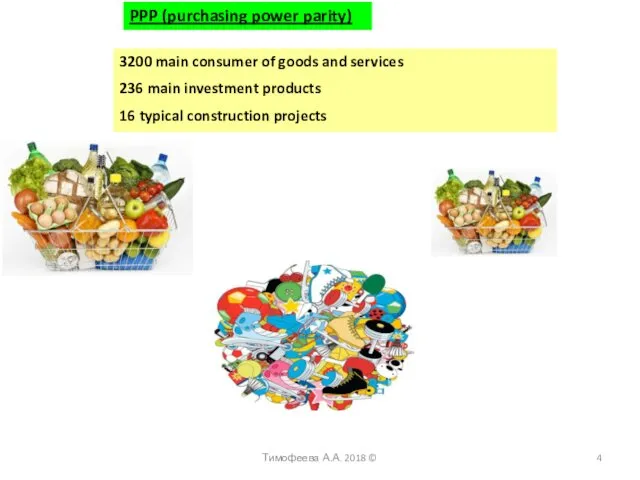
3200 main consumer of goods and services
236 main investment products
16 typical
3200 main consumer of goods and services
236 main investment products
16 typical
When PPP?
Cross-country comparisons
Rational allocation of limited funds (quotas of the IMF)
The
When PPP?
Cross-country comparisons
Rational allocation of limited funds (quotas of the IMF)
The
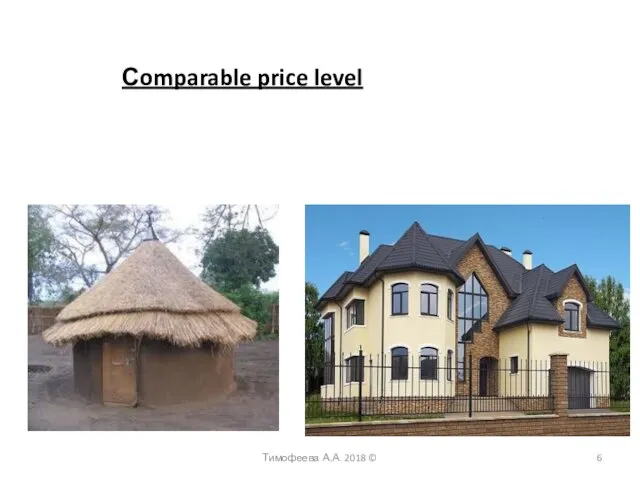
Сomparable price level
Тимофеева А.А. 2018 ©
Сomparable price level
Тимофеева А.А. 2018 ©
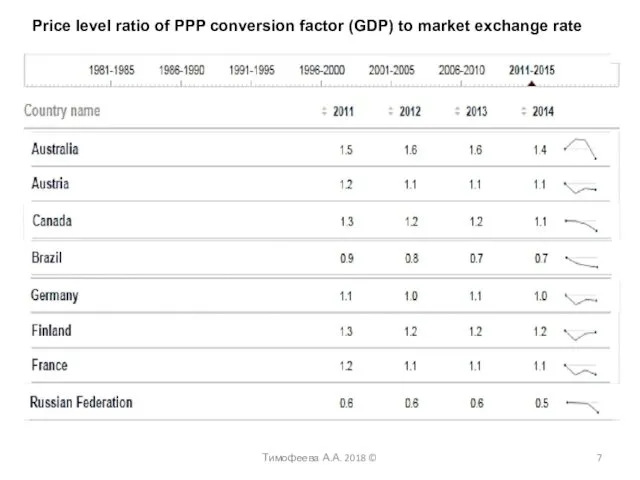
Price level ratio of PPP conversion factor (GDP) to market exchange
Price level ratio of PPP conversion factor (GDP) to market exchange
Тимофеева А.А. 2018 ©
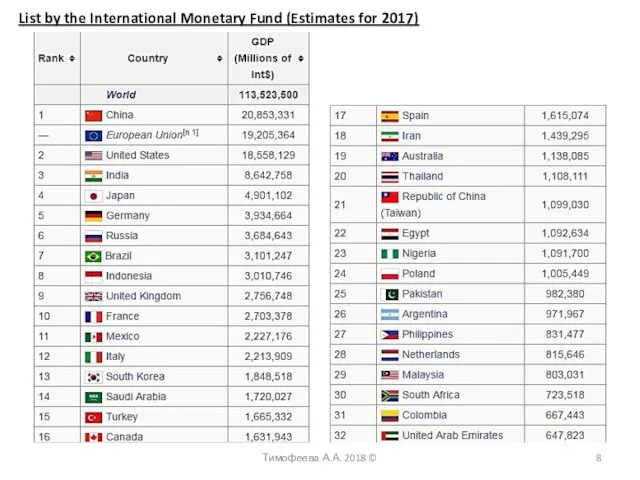
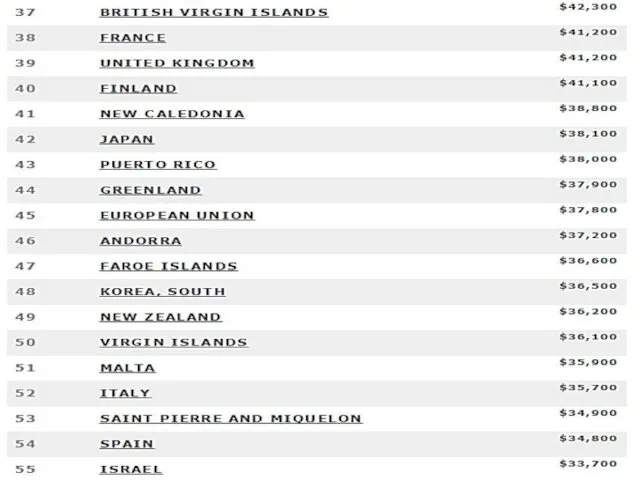
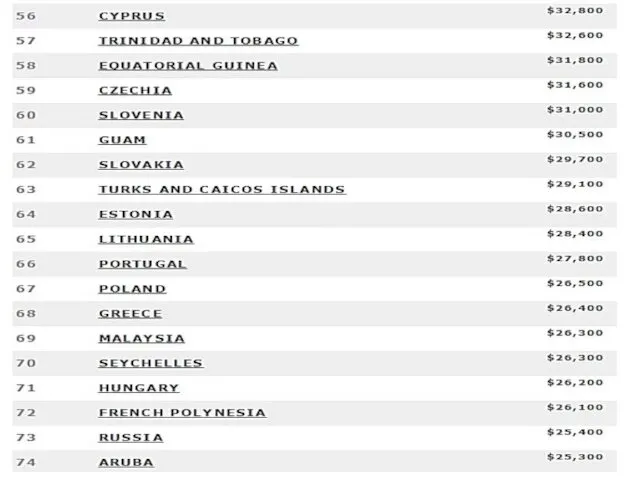
List by the International Monetary Fund (Estimates for
Тимофеева А.А. 2018 ©
List by the International Monetary Fund (Estimates for
Тимофеева А.А. 2018 ©
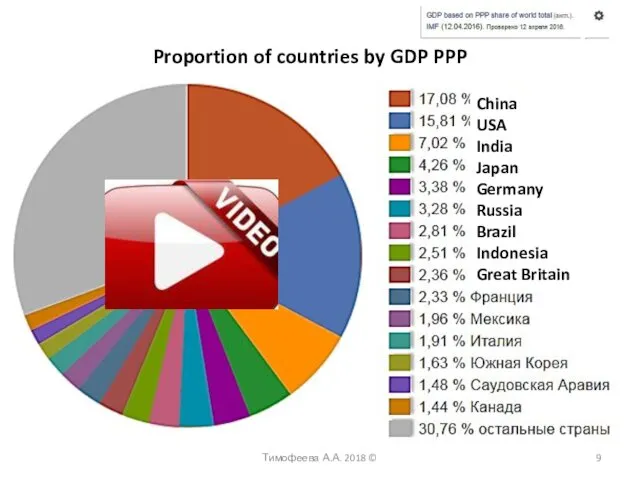
Proportion of countries by GDP PPP
China
USA
India
Japan
Germany
Russia
Brazil
Indonesia
Great Britain
Тимофеева А.А. 2018 ©
Proportion of countries by GDP PPP
China
USA
India
Japan
Germany
Russia
Brazil
Indonesia
Great Britain
Сlassification of the countries
Сlassification of the countries
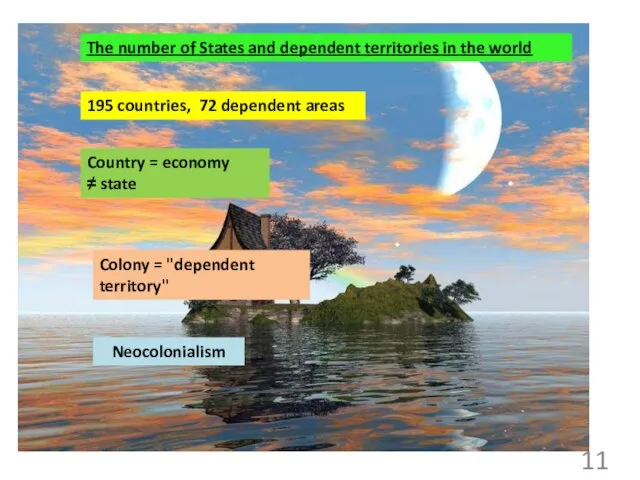
195 countries, 72 dependent areas
Country = economy
≠ state
The number of
195 countries, 72 dependent areas
Country = economy
≠ state
The number of
Signs of dependent areas
Advantages for mother-country
Advantages for dependent area
Signs of dependent areas
Advantages for mother-country
Advantages for dependent area
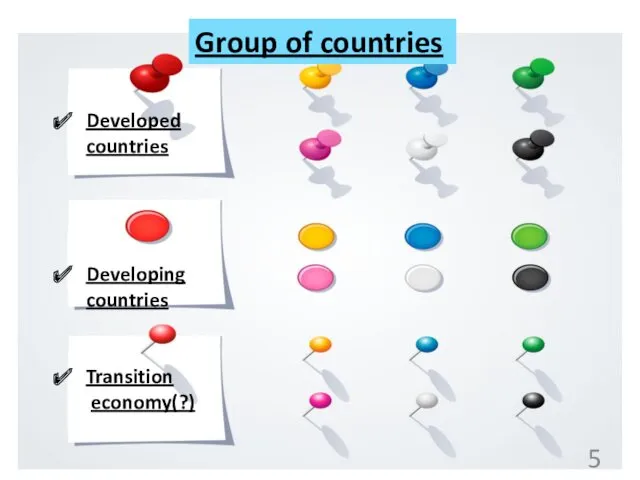
Group of countries
Developed
countries
Developing
countries
Transition
economy(?)
5
Group of countries
Developed
countries
Developing
countries
Transition
economy(?)
5
Criteria:
The nature of the economy
The level of socio-economic development
6
Criteria:
The nature of the economy
The level of socio-economic development
6
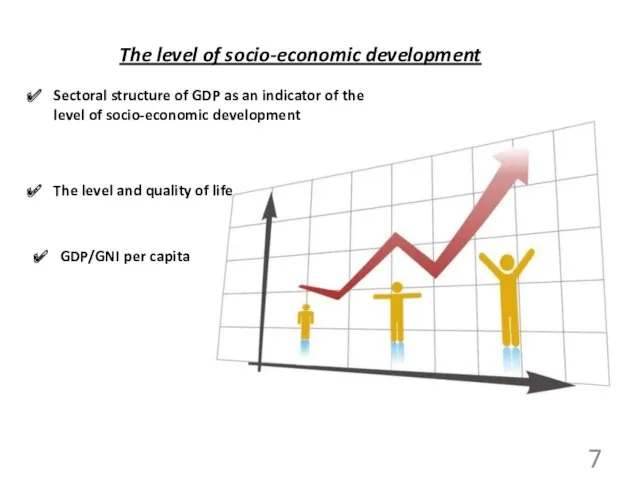
Sectoral structure of GDP as an indicator of the level of
Sectoral structure of GDP as an indicator of the level of
Sectoral structure of GDP as an indicator of the level of
Sectoral structure of GDP as an indicator of the level of
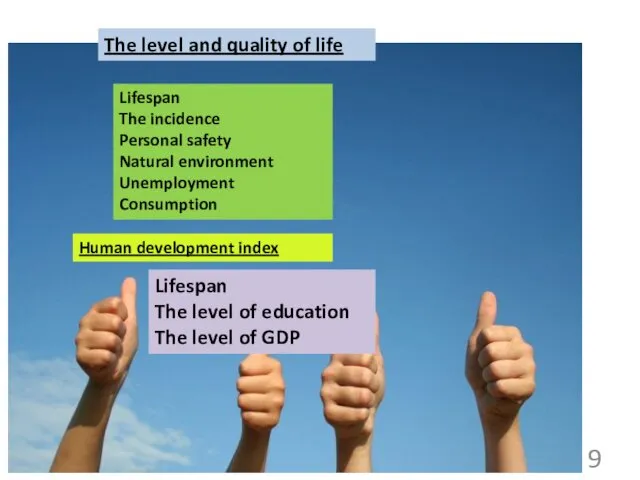
The level and quality of life
Lifespan
The incidence
Personal safety
Natural environment
Unemployment
Consumption
Human development index
Lifespan
The
The level and quality of life
Lifespan
The incidence
Personal safety
Natural environment
Unemployment
Consumption
Human development index
Lifespan
The
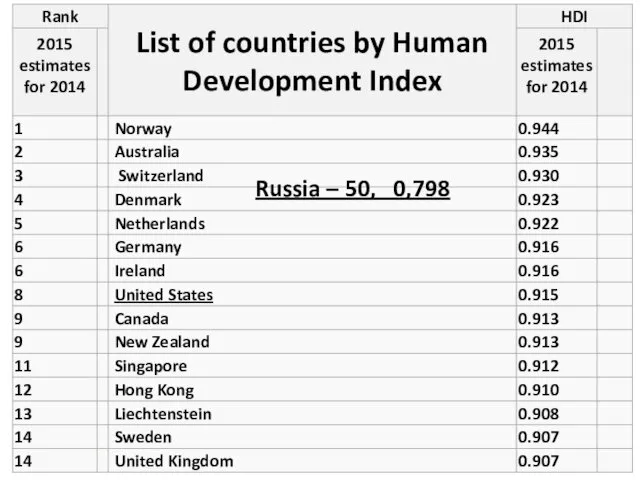
ИРЧП 2013
Russia – 50, 0,798
ИРЧП 2013
Russia – 50, 0,798
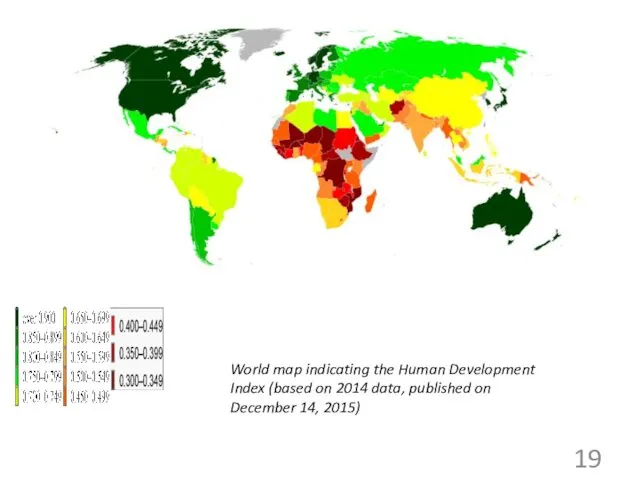
World map indicating the Human Development Index (based on 2014 data, published on
World map indicating the Human Development Index (based on 2014 data, published on
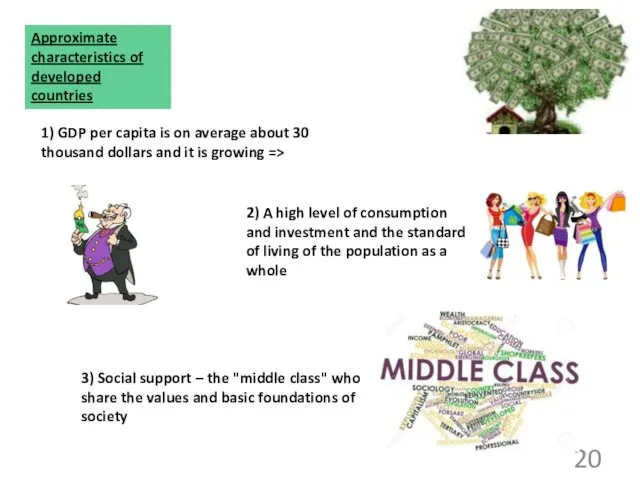
Approximate characteristics of developed countries
1) GDP per capita is on average
Approximate characteristics of developed countries
1) GDP per capita is on average
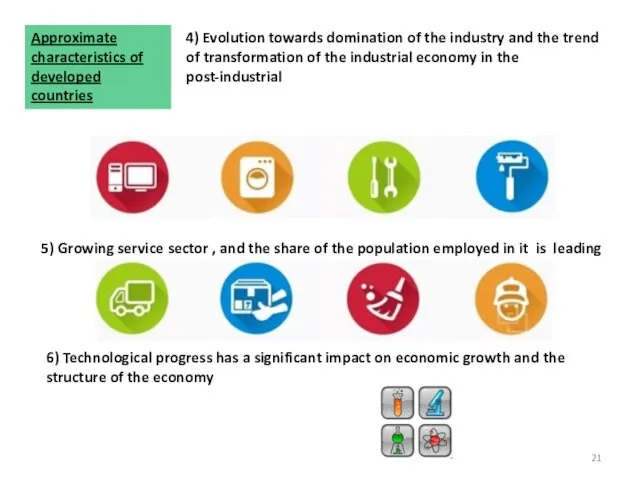
4) Evolution towards domination of the industry and the trend of
4) Evolution towards domination of the industry and the trend of
7) Business structure is non-uniform. The leading role in the economy
7) Business structure is non-uniform. The leading role in the economy
9) The state of developed countries is an active participant in
9) The state of developed countries is an active participant in
10) The openness to the world economy and the liberal organization
10) The openness to the world economy and the liberal organization
Countries with economies in transition:
The former socialist countries of Central
Countries with economies in transition:
The former socialist countries of Central
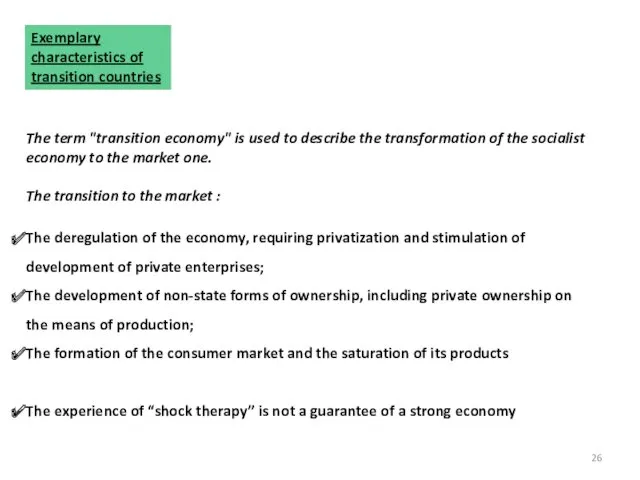
The term "transition economy" is used to describe the transformation of
The term "transition economy" is used to describe the transformation of
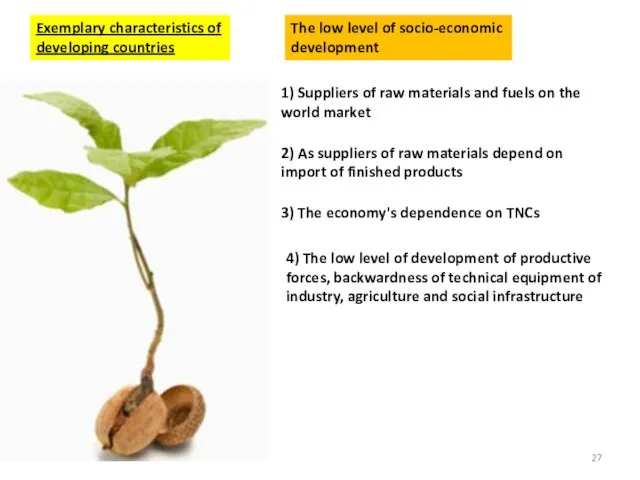
Exemplary characteristics of developing countries
The low level of socio-economic development
1) Suppliers
Exemplary characteristics of developing countries
The low level of socio-economic development
1) Suppliers
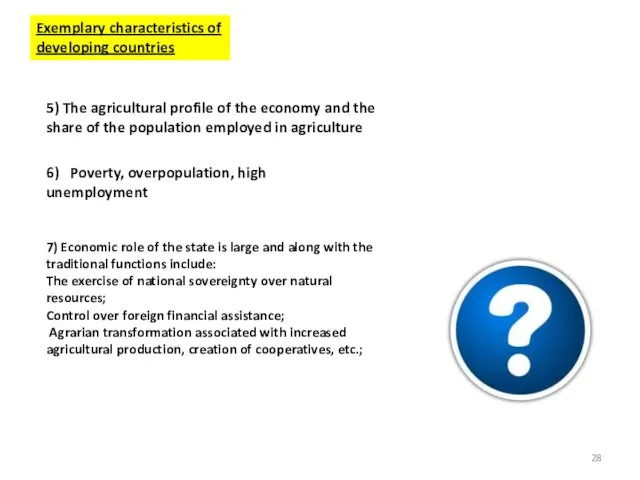
5) The agricultural profile of the economy and the share of
5) The agricultural profile of the economy and the share of
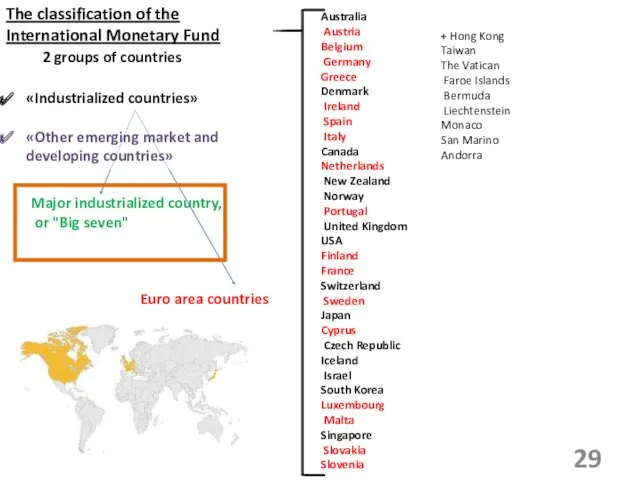
The classification of the International Monetary Fund
2 groups of countries
Major
The classification of the International Monetary Fund
2 groups of countries
Major

Major industrialized country,
or "Big seven"
?
11.4% of the population
50% of
Major industrialized country,
or "Big seven"
?
11.4% of the population
50% of
Тимофеева А.А. 2018 ©
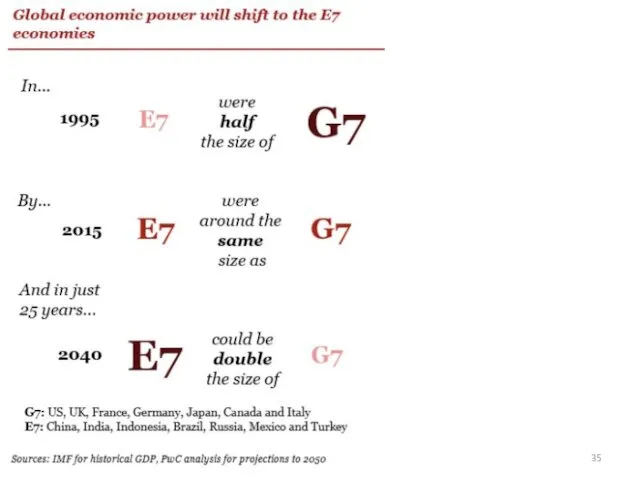
The PwC The World in 2050 report suggests that emerging markets will
Тимофеева А.А. 2018 ©
The PwC The World in 2050 report suggests that emerging markets will
Тимофеева А.А. 2018 ©
The PwC report also looks at the fastest
Тимофеева А.А. 2018 ©
The PwC report also looks at the fastest
Тимофеева А.А. 2018 ©
Тимофеева А.А. 2018 ©
Тимофеева А.А. 2018 ©
Тимофеева А.А. 2018 ©
Тимофеева А.А. 2018 ©
Challenges for policymakers
Protectionism
Benefits of globalisation ⬄ equity
Green technologies
Тимофеева А.А. 2018 ©
Challenges for policymakers
Protectionism
Benefits of globalisation ⬄ equity
Green technologies

Тимофеева А.А. 2018 ©
Opportunities for business :
Mature emerging markets (costs, consumers,
Тимофеева А.А. 2018 ©
Opportunities for business :
Mature emerging markets (costs, consumers,
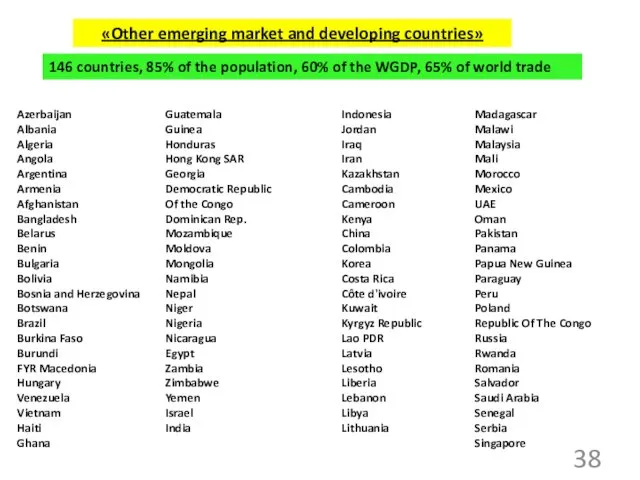
«Other emerging market and developing countries»
146 countries, 85% of the population,
«Other emerging market and developing countries»
146 countries, 85% of the population,
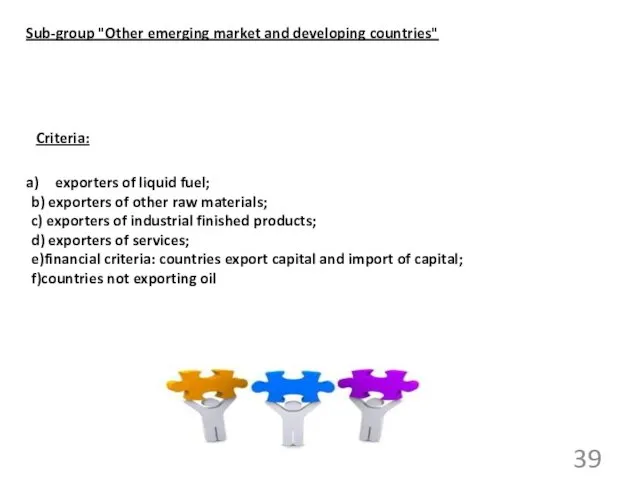
Sub-group "Other emerging market and developing countries"
exporters of liquid fuel;
b)
Sub-group "Other emerging market and developing countries"
exporters of liquid fuel;
b)
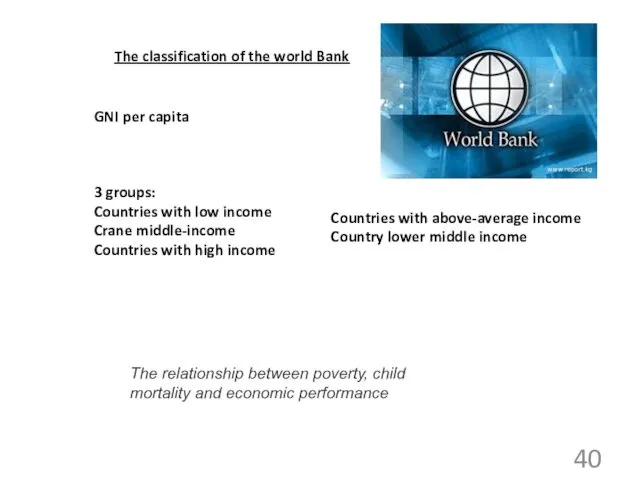
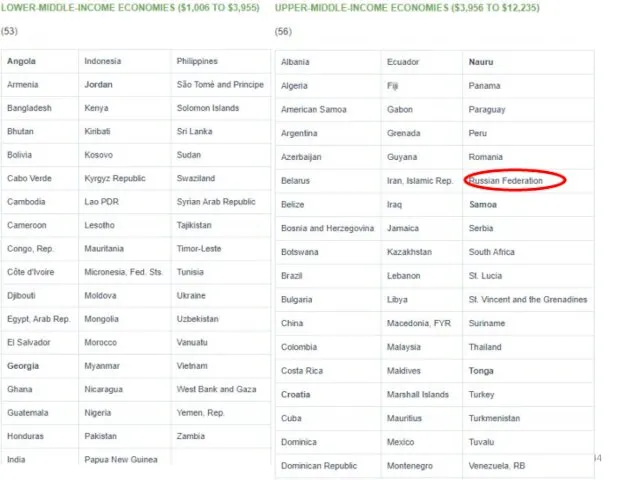
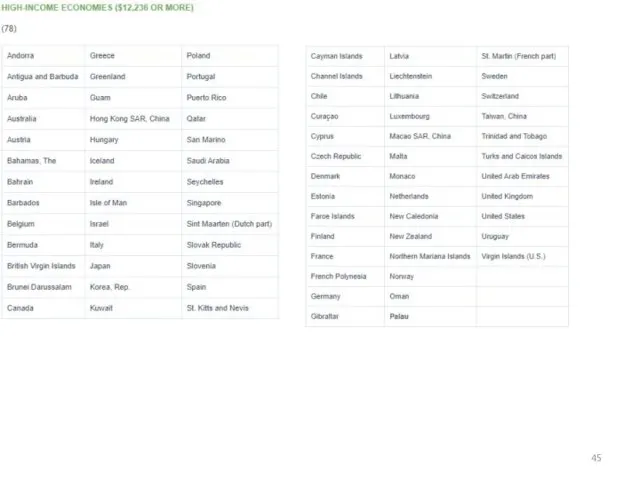
The classification of the world Bank
GNI per capita
3 groups:
Countries with low
The classification of the world Bank
GNI per capita
3 groups:
Countries with low
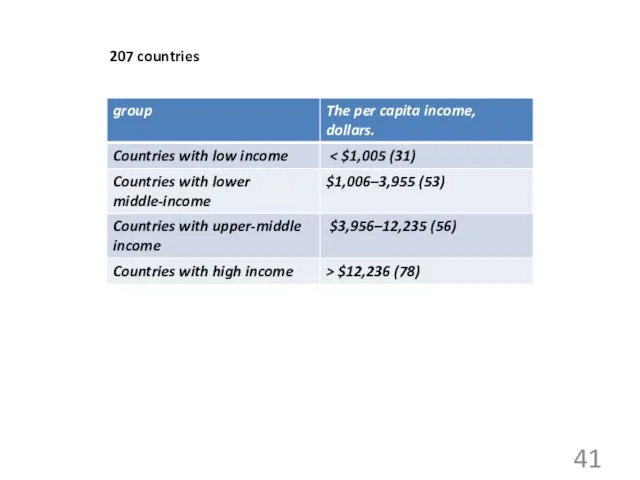
207 countries
207 countries
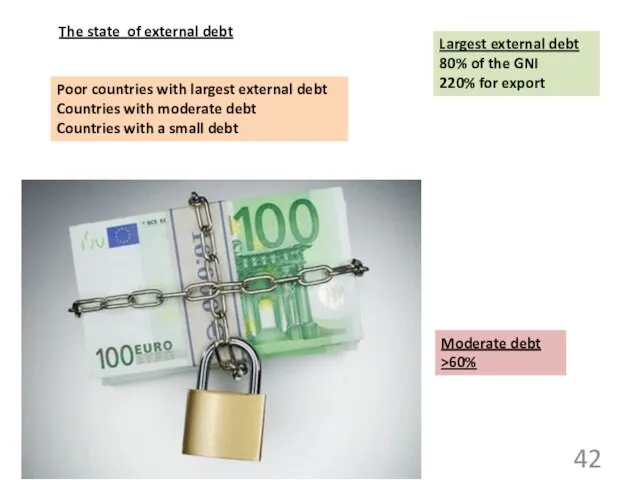
The state of external debt
Poor countries with largest external debt
Countries with
The state of external debt
Poor countries with largest external debt
Countries with

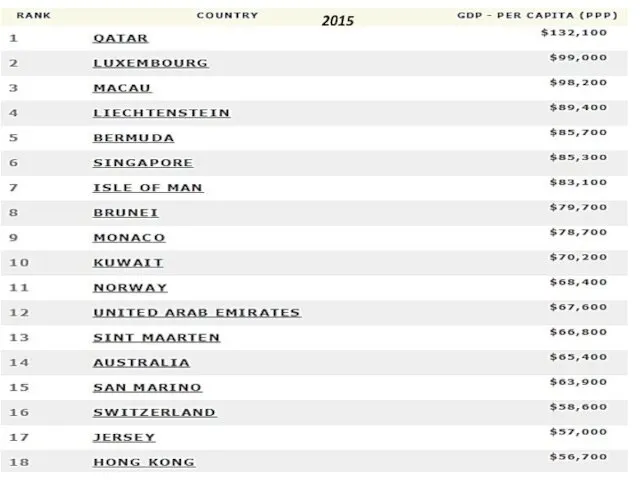
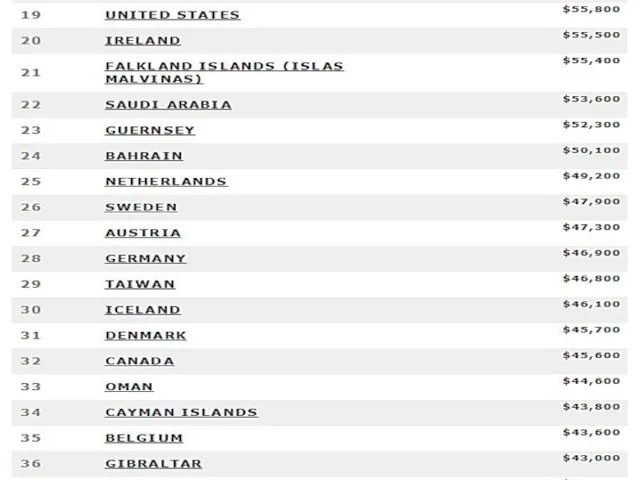
2015
2015
 Электронный бюджет
 Бухгалтерский учет материальных запасов
 Бағалы қағаздар нарығы
 О механизме предоставления государственной поддержки сельскохозяйственным товаропроизводителям
 Социальные и медицинские услуги в праве социального обеспечения
 Системы директ – костинг, стандарт – кост и нормативный метод
 Робота банку з готівкою, розрахунково-касові операції
 Сферы применения BlockChain в бизнесе
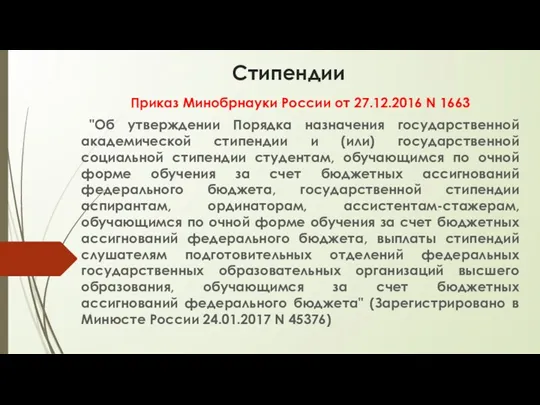 Стипендии
 Затраты на производство и реализацию продукции и их финансирование
 Организация ведения бухгалтерского учета и составления бухгалтерской отчетности в банках Республики Беларусь
 Налоги. Прямые и косвенные налоги
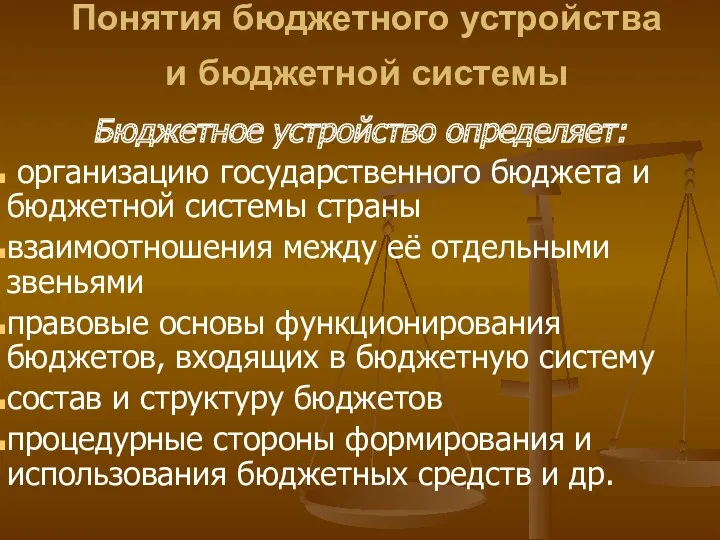 Понятия бюджетного устройства и бюджетной системы
 Green Chemistry for Life
 Возврат день в день розница. Карта
 Конференция. Бухотчетность за 2019 год
 Содержание и организация государственных и муниципальных финансов
 Порядок исполнения бюджета Свердловской области
 Тест по бухгалтерскому учету
 Кәсіпорынның табыстылығын диверсификациялау мәселелері
 Финансовый рынок
 Қаржы нарығы
 Налоги юридических лиц
 Изменения в бухгалтерской (финансовой) отчетности за 2018 год
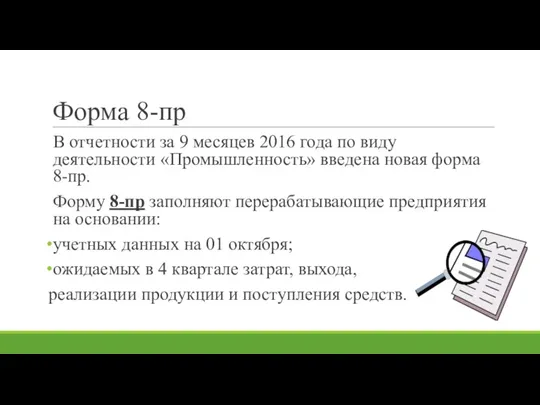 Отчетность. Форма 8-пр
 Актуальные вопросы составления бюджетной (бухгалтерской) отчетности за 2021 год
 Soliq ma’murchiligi
 Облікова політика підприємства