- Statistical Concepts and Market Returns

Содержание
- 2. Construction of a Frequency Distribution 1 Sort the data in ascending order. 2 Calculate the range
- 3. Histogram/Frequency polygon A histogram is a bar chart of data that have been grouped into a
- 4. Measures of central tendency(mean)
- 5. Weighted and Harmonic mean A portfolio’s return is a weighted mean return computed from the returns
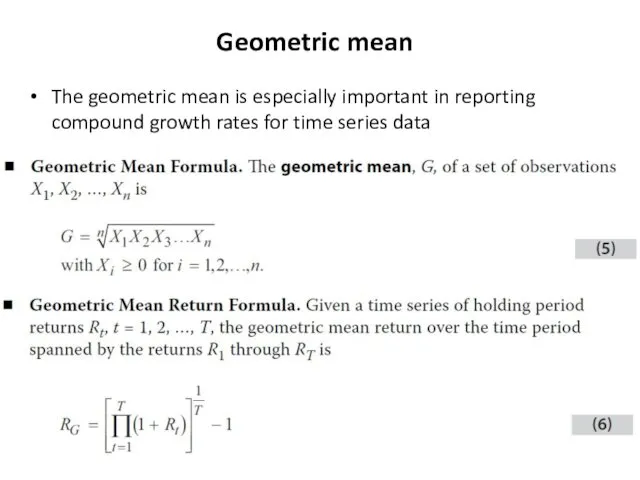
- 6. Geometric mean The geometric mean is especially important in reporting compound growth rates for time series
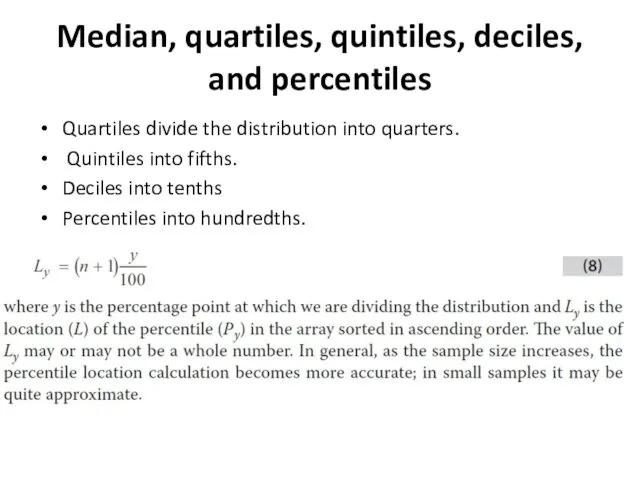
- 7. Median, quartiles, quintiles, deciles, and percentiles Quartiles divide the distribution into quarters. Quintiles into fifths. Deciles
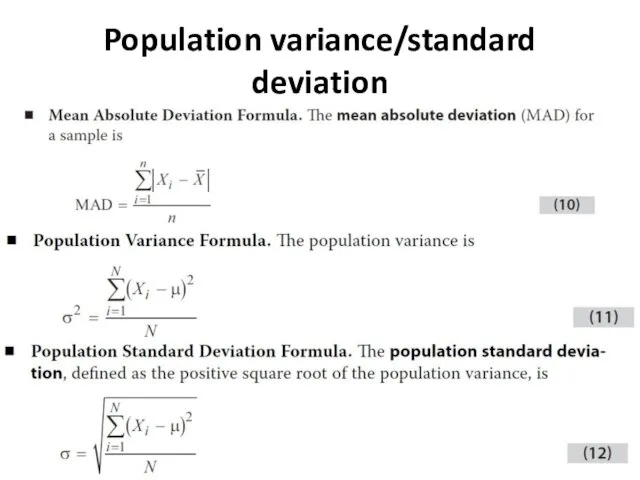
- 8. Population variance/standard deviation
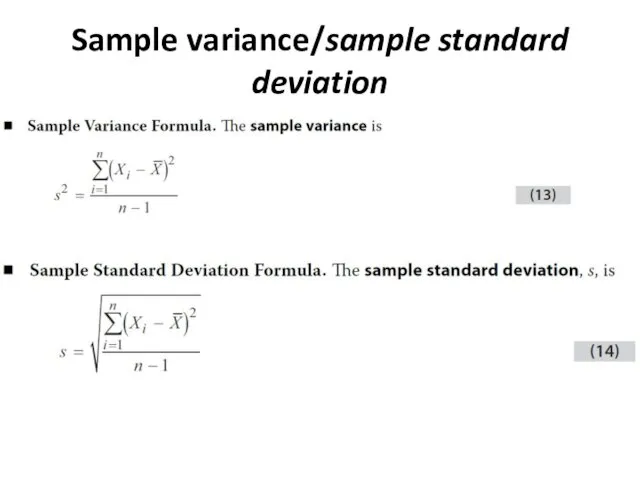
- 9. Sample variance/sample standard deviation
- 10. Semivariance The semivariance is the average squared deviation below the mean. Target semivariance is the average
- 11. Chebyshev’s inequality
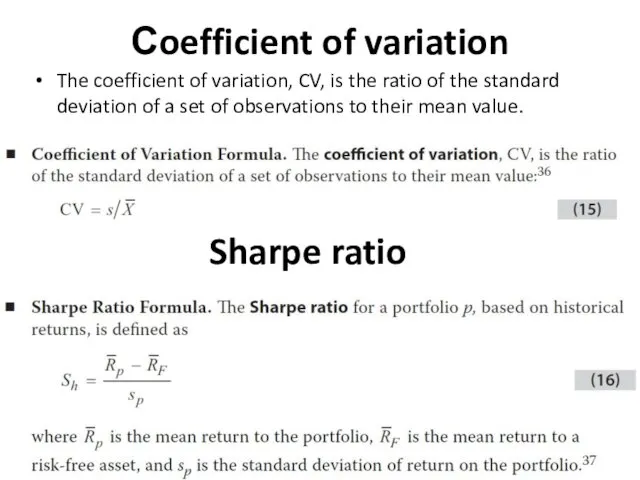
- 12. Сoefficient of variation The coefficient of variation, CV, is the ratio of the standard deviation of
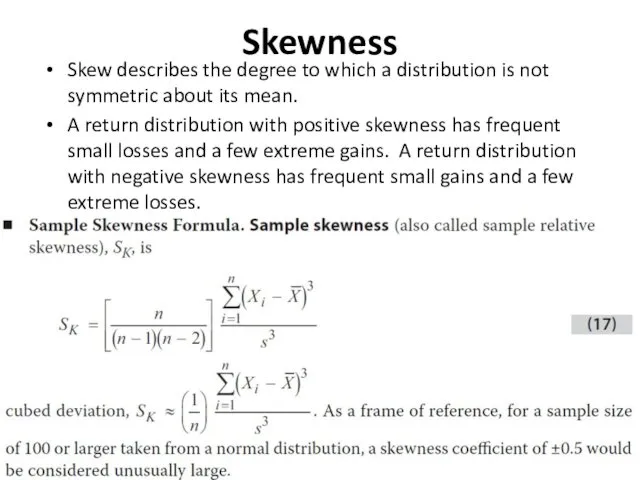
- 13. Skewness Skew describes the degree to which a distribution is not symmetric about its mean. A
- 15. Скачать презентацию
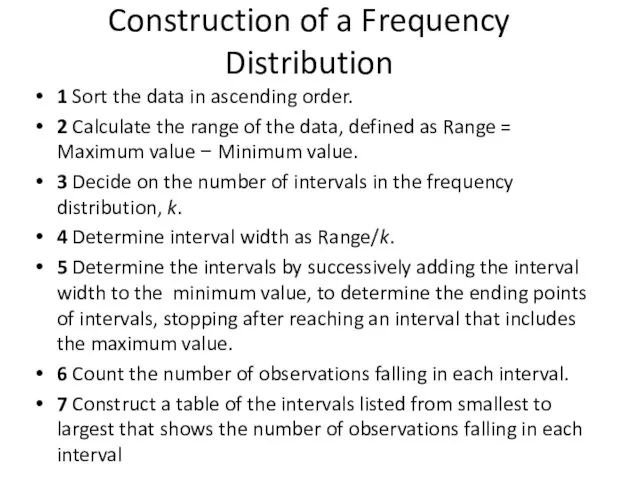
Construction of a Frequency Distribution
1 Sort the data in ascending order.
2
Construction of a Frequency Distribution
1 Sort the data in ascending order.
2
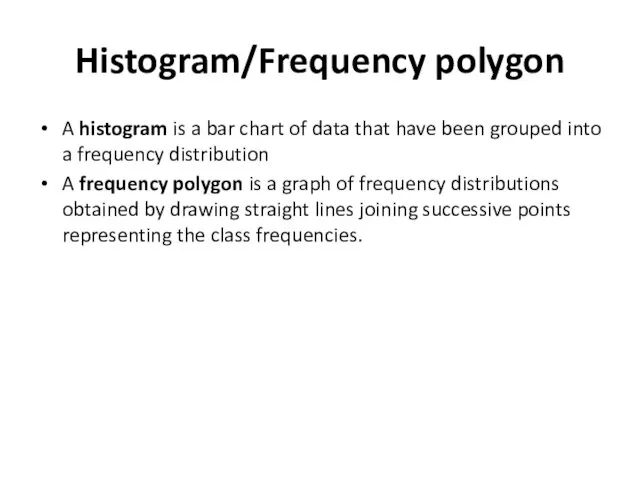
Histogram/Frequency polygon
A histogram is a bar chart of data that
Histogram/Frequency polygon
A histogram is a bar chart of data that
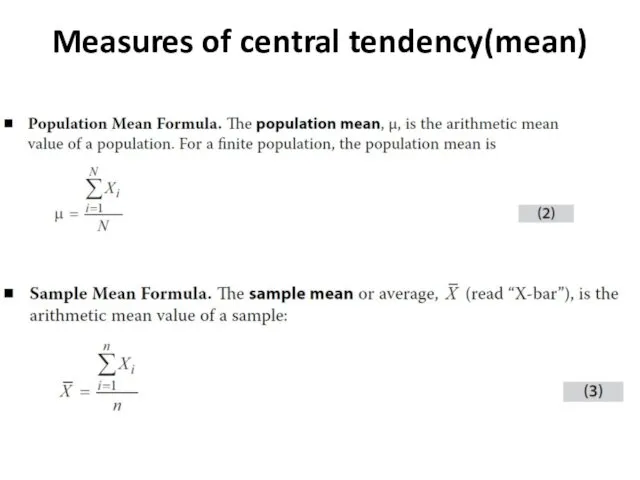
Measures of central tendency(mean)
Measures of central tendency(mean)
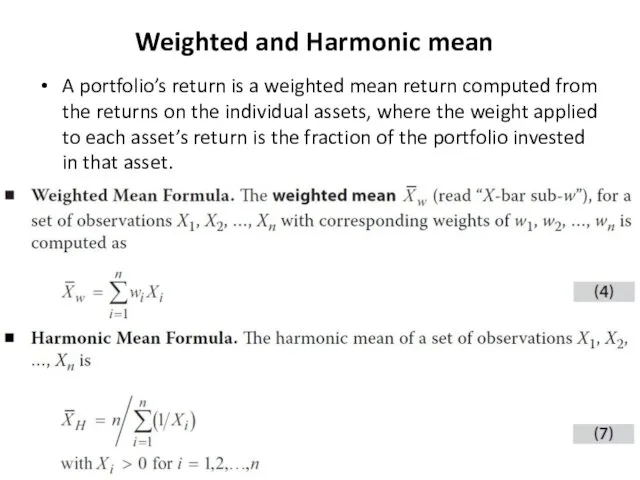
Weighted and Harmonic mean
A portfolio’s return is a weighted mean return
Weighted and Harmonic mean
A portfolio’s return is a weighted mean return
Geometric mean
The geometric mean is especially important in reporting compound growth
Geometric mean
The geometric mean is especially important in reporting compound growth
Median, quartiles, quintiles, deciles, and percentiles
Quartiles divide the distribution into quarters.
Median, quartiles, quintiles, deciles, and percentiles
Quartiles divide the distribution into quarters.
Population variance/standard deviation
Population variance/standard deviation
Sample variance/sample standard deviation
Sample variance/sample standard deviation
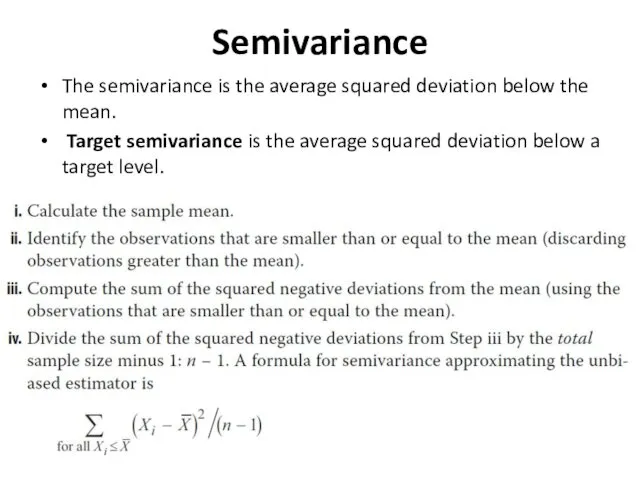
Semivariance
The semivariance is the average squared deviation below the mean.
Target
Semivariance
The semivariance is the average squared deviation below the mean.
Target
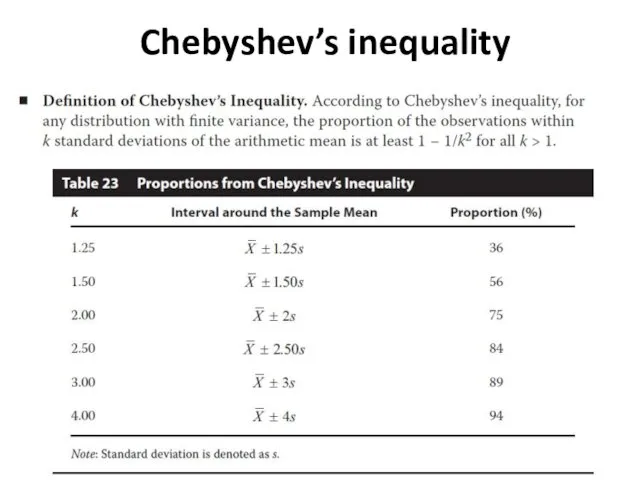
Chebyshev’s inequality
Chebyshev’s inequality
Сoefficient of variation
The coefficient of variation, CV, is the ratio of
Сoefficient of variation
The coefficient of variation, CV, is the ratio of
Skewness
Skew describes the degree to which a distribution is not symmetric
Skewness
Skew describes the degree to which a distribution is not symmetric
 Учёт затрат и калькулирование себестоимости готовой продукции
 Учет расчетов с персоналом по оплате труда
 О применении Федерального закона от 28 декабря 2013 года № 400-ФЗ О страховых пенсиях
 Про виконання доходної частини місцевих бюджетів області за 2017 рік та основні резерви по наповненню бюджетів на 2018 рік
 Анализ роли криптовалют в современной экономике
 Сутність та значення фондової біржі
 Право социального обеспечения. Тема 3 и тема 4
 Бүгінгі БАӘ – араб әлеміндегі ең бай мемлекеттердің бірі
 Банки и небанковские кредитные учреждения: услуги для населения
 Финансы, как экономическая категория
 Итоги исполнения бюджета по доходам за 2021 год
 Бюджетная классификация РФ
 Бюджет и бюджетная система РФ
 Финансовое право. Понятие, предмет и метод
 Автоматизация банковской деятельности. Лекция 5
 Астана халықаралық қаржы орталығы
 Специальное предложение для вашей компании. Почта Банк
 Планування заходів щодо залучення інвестицій
 КАСКО - добровольное страхование транспортного средства
 Технология блокчейн. Криптовалюты. Биткойн. Цифровая (виртуальная) валюта
 Тарифы региональных операторов по обращению с ТКО в Московской области
 Риски реальных инвестиций. Тема 6
 Водный налог
 Внебюджетные и целевые бюджетные фонды
 Денежно-кредитная политика
 Упрощенная система налогообложения. Тема 3
 Финансовая деятельность государства
 Информационные технологии в анализе инвестиционных проектов