- The Capital Asset Pricing Model (CAPM). Corporate Finance

Содержание
- 2. 10.1 Individual Securities 10.2 Expected Return, Variance, and Covariance 10.3 The Return and Risk for Portfolios
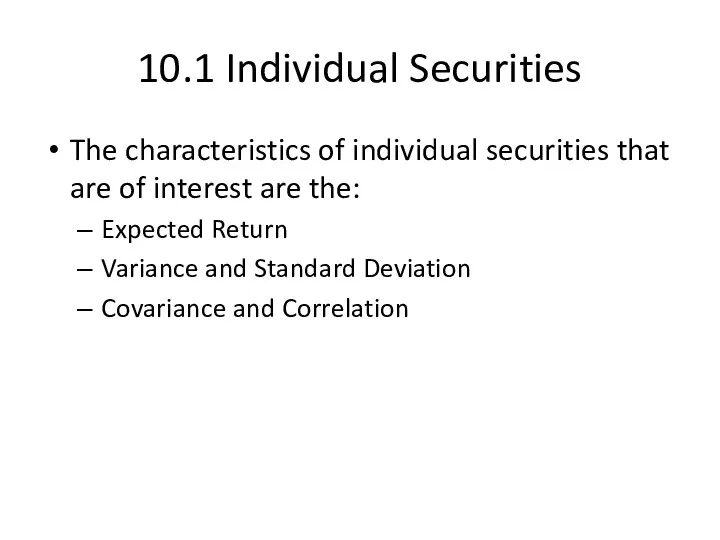
- 3. 10.1 Individual Securities The characteristics of individual securities that are of interest are the: Expected Return
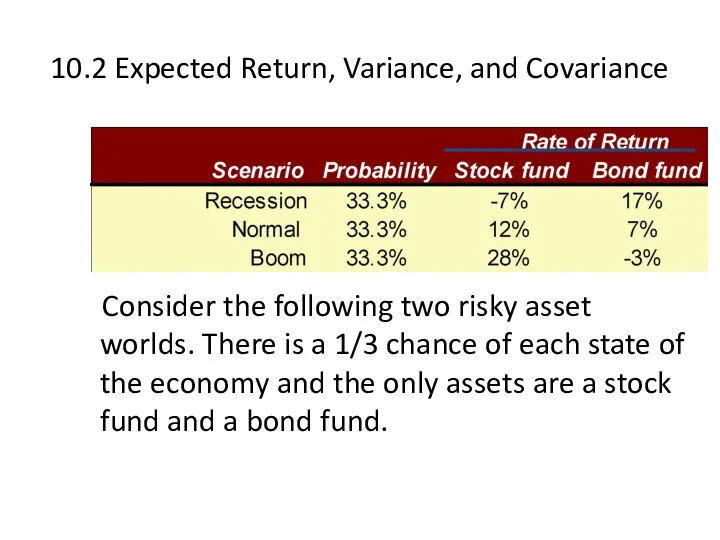
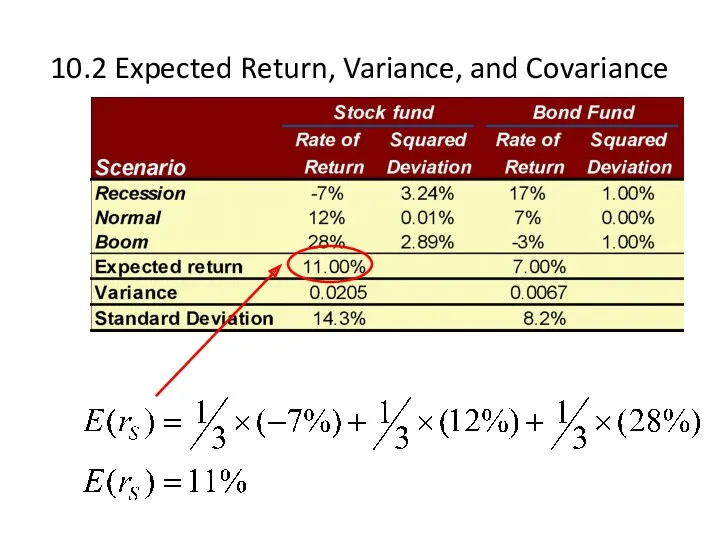
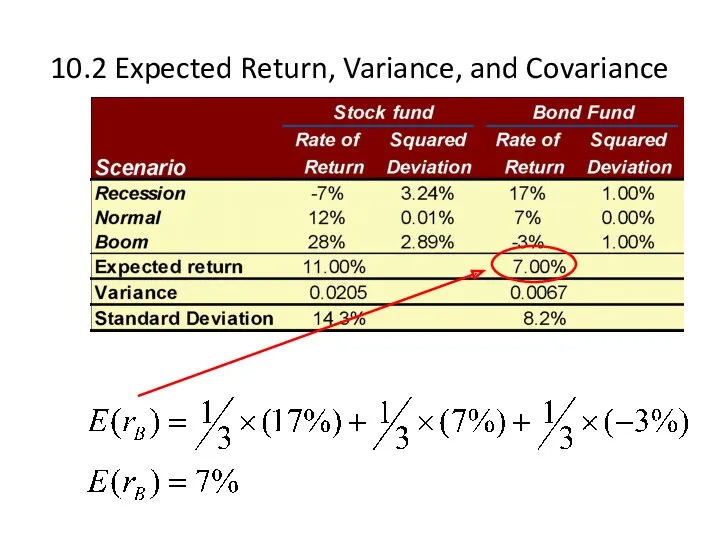
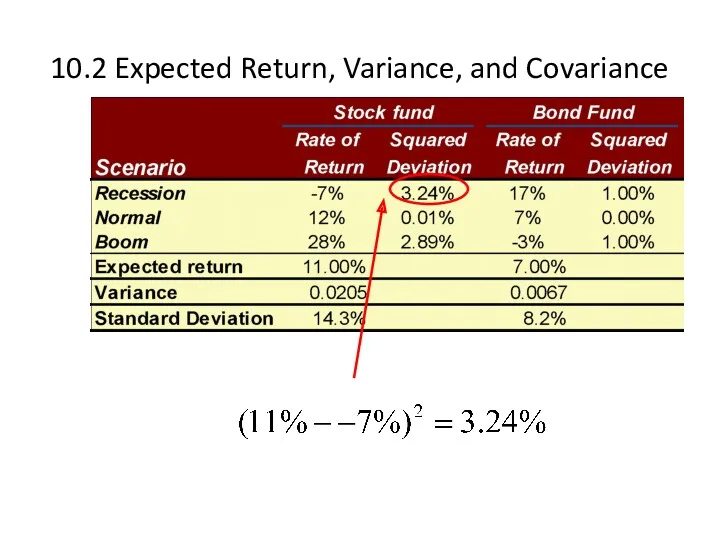
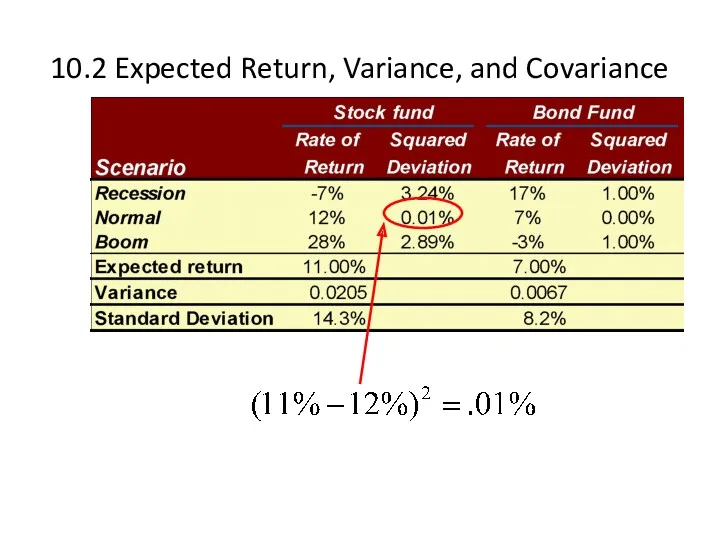
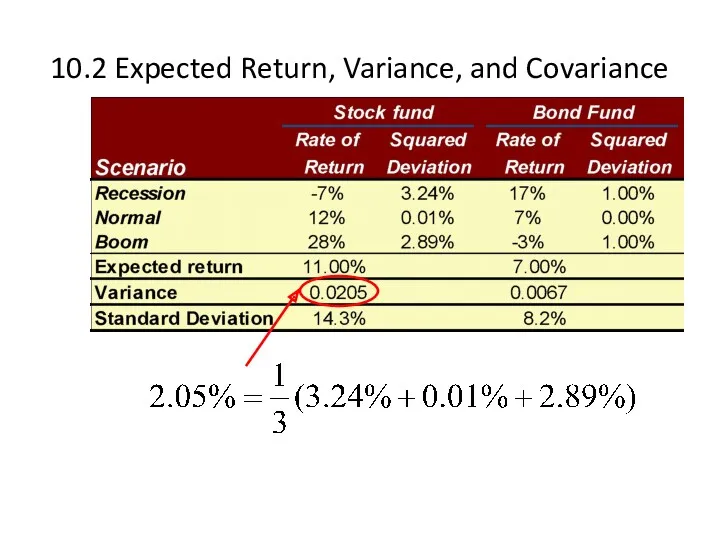
- 4. 10.2 Expected Return, Variance, and Covariance Consider the following two risky asset worlds. There is a
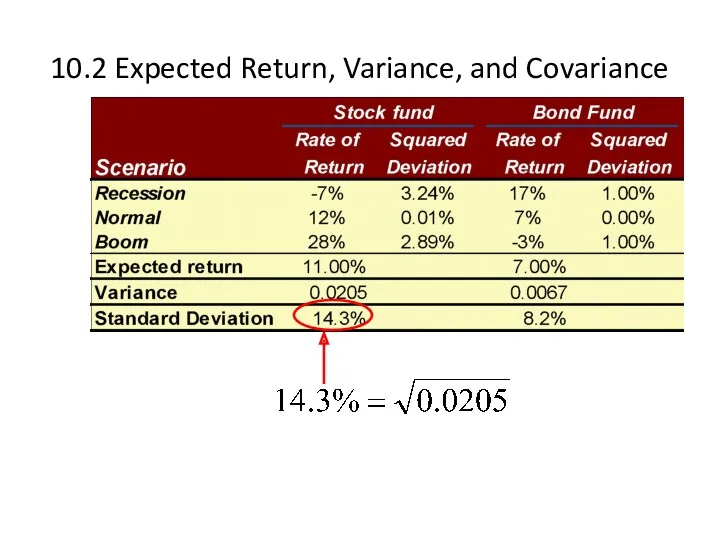
- 5. 10.2 Expected Return, Variance, and Covariance
- 6. 10.2 Expected Return, Variance, and Covariance
- 7. 10.2 Expected Return, Variance, and Covariance
- 8. 10.2 Expected Return, Variance, and Covariance
- 9. 10.2 Expected Return, Variance, and Covariance
- 10. 10.2 Expected Return, Variance, and Covariance
- 11. 10.2 Expected Return, Variance, and Covariance
- 12. 10.2 Expected Return, Variance, and Covariance
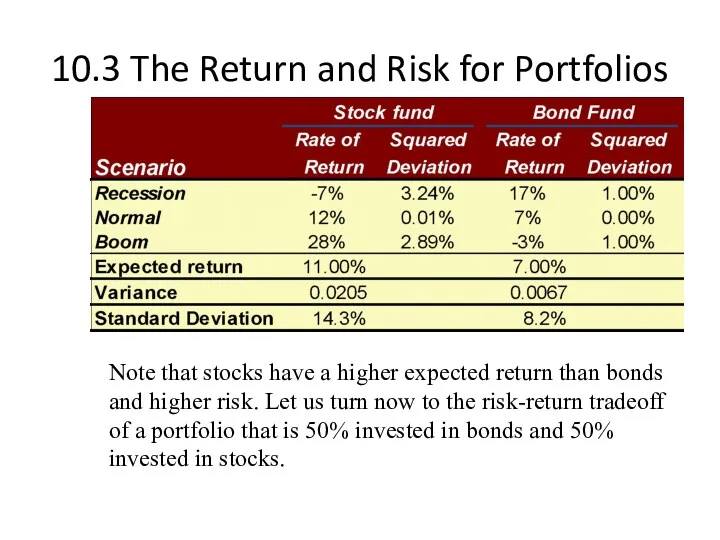
- 13. 10.3 The Return and Risk for Portfolios Note that stocks have a higher expected return than
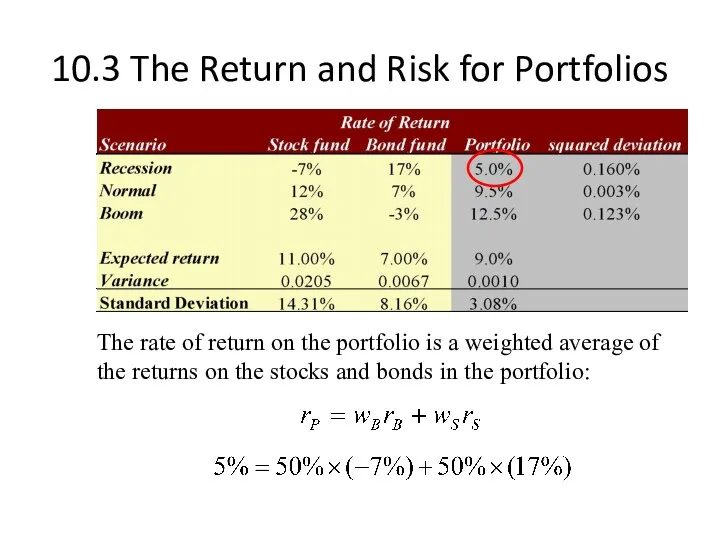
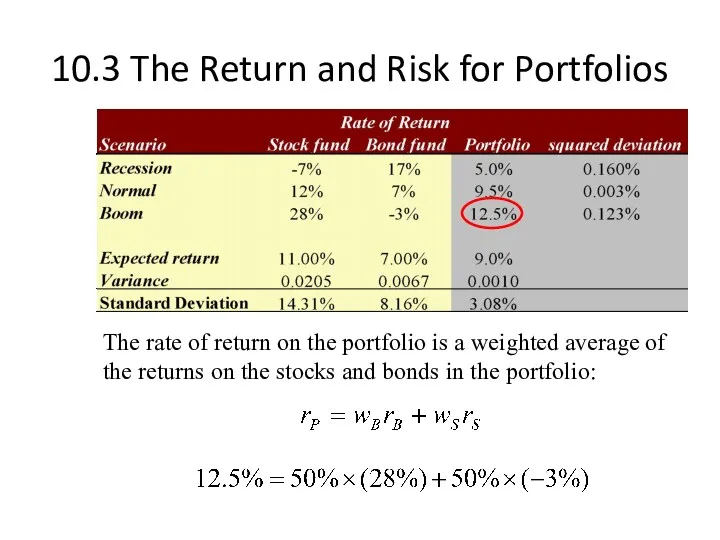
- 14. 10.3 The Return and Risk for Portfolios The rate of return on the portfolio is a
- 15. 10.3 The Return and Risk for Portfolios The rate of return on the portfolio is a
- 16. 10.3 The Return and Risk for Portfolios The rate of return on the portfolio is a
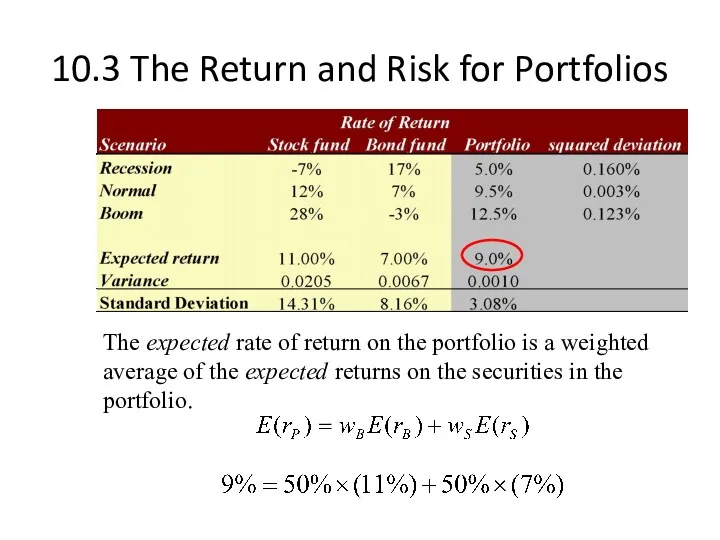
- 17. 10.3 The Return and Risk for Portfolios The expected rate of return on the portfolio is
- 18. 10.3 The Return and Risk for Portfolios The variance of the rate of return on the
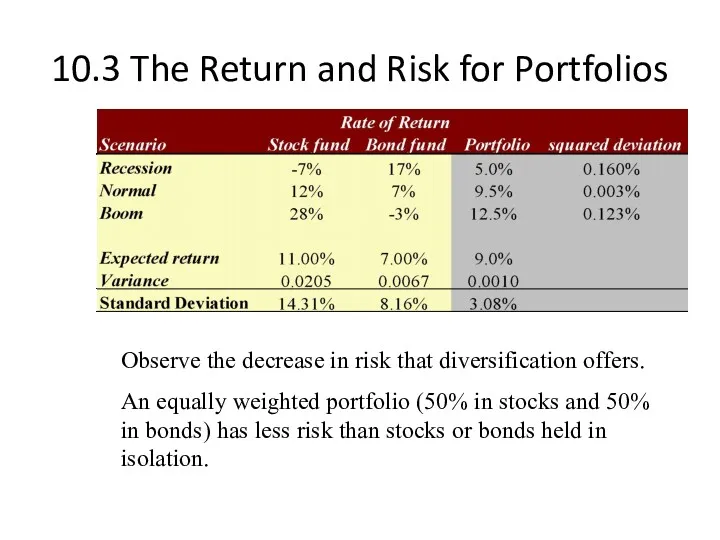
- 19. 10.3 The Return and Risk for Portfolios Observe the decrease in risk that diversification offers. An
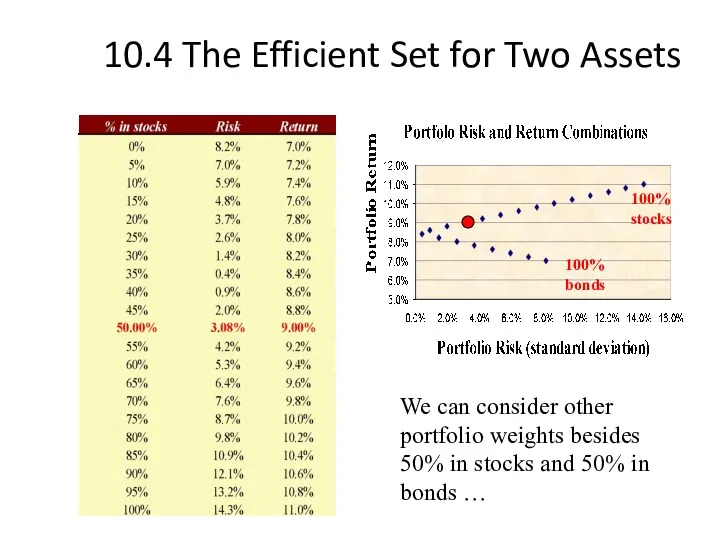
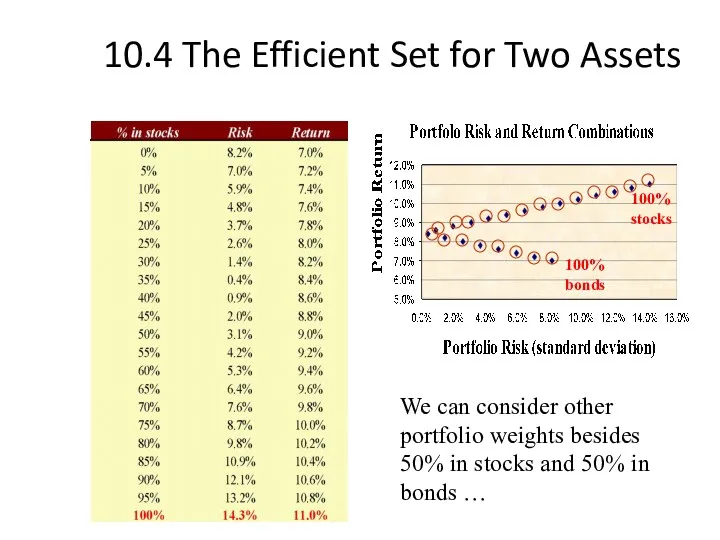
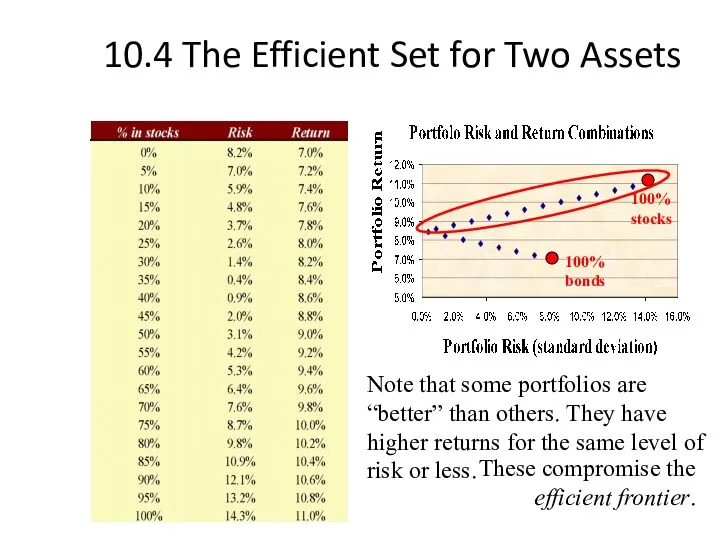
- 20. 10.4 The Efficient Set for Two Assets We can consider other portfolio weights besides 50% in
- 21. 10.4 The Efficient Set for Two Assets We can consider other portfolio weights besides 50% in
- 22. 10.4 The Efficient Set for Two Assets 100% stocks 100% bonds Note that some portfolios are
- 23. Two-Security Portfolios with Various Correlations 100% bonds return σ 100% stocks ρ = 0.2 ρ =
- 24. Portfolio Risk/Return Two Securities: Correlation Effects Relationship depends on correlation coefficient -1.0 The smaller the correlation,
- 25. Portfolio Risk as a Function of the Number of Stocks in the Portfolio Nondiversifiable risk; Systematic
- 26. 10.5 The Efficient Set for Many Securities Consider a world with many risky assets; we can
- 27. 10.5 The Efficient Set for Many Securities Given the opportunity set we can identify the minimum
- 28. 10.5 The Efficient Set for Many Securities The section of the opportunity set above the minimum
- 29. Optimal Risky Portfolio with a Risk-Free Asset In addition to stocks and bonds, consider a world
- 30. 10.7 Riskless Borrowing and Lending Now investors can allocate their money across the T-bills and a
- 31. 10.7 Riskless Borrowing and Lending With a risk-free asset available and the efficient frontier identified, we
- 32. 10.8 Market Equilibrium With the capital allocation line identified, all investors choose a point along the
- 33. The Separation Property The Separation Property states that the market portfolio, M, is the same for
- 34. The Separation Property Investor risk aversion is revealed in their choice of where to stay along
- 35. Market Equilibrium Just where the investor chooses along the Capital Asset Line depends on his risk
- 36. Market Equilibrium All investors have the same CML because they all have the same optimal risky
- 37. The Separation Property The separation property implies that portfolio choice can be separated into two tasks:
- 38. Optimal Risky Portfolio with a Risk-Free Asset By the way, the optimal risky portfolio depends on
- 39. Definition of Risk When Investors Hold the Market Portfolio Researchers have shown that the best measure
- 40. Estimating β with regression Security Returns Return on market % Ri = α i + βiRm
- 41. Estimates of β for Selected Stocks
- 42. The Formula for Beta Clearly, your estimate of beta will depend upon your choice of a
- 43. 10.9 Relationship between Risk and Expected Return (CAPM) Expected Return on the Market: Expected return on
- 44. Expected Return on an Individual Security This formula is called the Capital Asset Pricing Model (CAPM)
- 45. Relationship Between Risk & Expected Return Expected return β 1.0
- 46. Relationship Between Risk & Expected Return Expected return β 1.5
- 47. 10.10 Summary and Conclusions This chapter sets forth the principles of modern portfolio theory. The expected
- 48. 10.10 Summary and Conclusions The efficient set of risky assets can be combined with riskless borrowing
- 50. Скачать презентацию
10.1 Individual Securities
10.2 Expected Return, Variance, and Covariance
10.3 The Return and
10.1 Individual Securities
10.2 Expected Return, Variance, and Covariance
10.3 The Return and
10.1 Individual Securities
The characteristics of individual securities that are of interest
10.1 Individual Securities
The characteristics of individual securities that are of interest
10.2 Expected Return, Variance, and Covariance
Consider the following two risky
10.2 Expected Return, Variance, and Covariance
Consider the following two risky

10.2 Expected Return, Variance, and Covariance
10.2 Expected Return, Variance, and Covariance
10.2 Expected Return, Variance, and Covariance
10.2 Expected Return, Variance, and Covariance
10.2 Expected Return, Variance, and Covariance
10.2 Expected Return, Variance, and Covariance
10.2 Expected Return, Variance, and Covariance
10.2 Expected Return, Variance, and Covariance
10.2 Expected Return, Variance, and Covariance
10.2 Expected Return, Variance, and Covariance

10.2 Expected Return, Variance, and Covariance
10.2 Expected Return, Variance, and Covariance
10.2 Expected Return, Variance, and Covariance
10.2 Expected Return, Variance, and Covariance
10.2 Expected Return, Variance, and Covariance
10.2 Expected Return, Variance, and Covariance
10.3 The Return and Risk for Portfolios
Note that stocks have a
10.3 The Return and Risk for Portfolios
Note that stocks have a
10.3 The Return and Risk for Portfolios
The rate of return on
10.3 The Return and Risk for Portfolios
The rate of return on

10.3 The Return and Risk for Portfolios
The rate of return on
10.3 The Return and Risk for Portfolios
The rate of return on
10.3 The Return and Risk for Portfolios
The rate of return on
10.3 The Return and Risk for Portfolios
The rate of return on
10.3 The Return and Risk for Portfolios
The expected rate of return
10.3 The Return and Risk for Portfolios
The expected rate of return

10.3 The Return and Risk for Portfolios
The variance of the rate
10.3 The Return and Risk for Portfolios
The variance of the rate
10.3 The Return and Risk for Portfolios
Observe the decrease in risk
10.3 The Return and Risk for Portfolios
Observe the decrease in risk
10.4 The Efficient Set for Two Assets
We can consider other portfolio
10.4 The Efficient Set for Two Assets
We can consider other portfolio
10.4 The Efficient Set for Two Assets
We can consider other portfolio
10.4 The Efficient Set for Two Assets
We can consider other portfolio
10.4 The Efficient Set for Two Assets
100% stocks
100% bonds
Note that some
10.4 The Efficient Set for Two Assets
100% stocks
100% bonds
Note that some
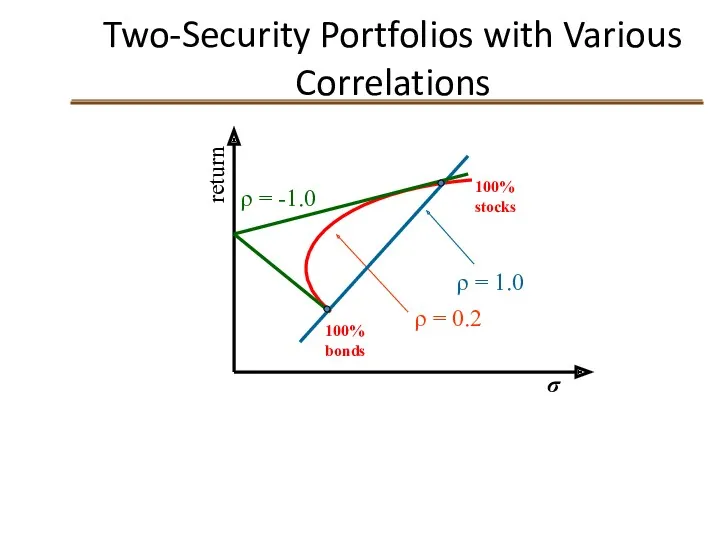
Two-Security Portfolios with Various Correlations
100% bonds
return
σ
100% stocks
ρ = 0.2
ρ =
Two-Security Portfolios with Various Correlations
100% bonds
return
σ
100% stocks
ρ = 0.2
ρ =

Portfolio Risk/Return Two Securities: Correlation Effects
Relationship depends on correlation coefficient
-1.0 <
Portfolio Risk/Return Two Securities: Correlation Effects
Relationship depends on correlation coefficient
-1.0 <
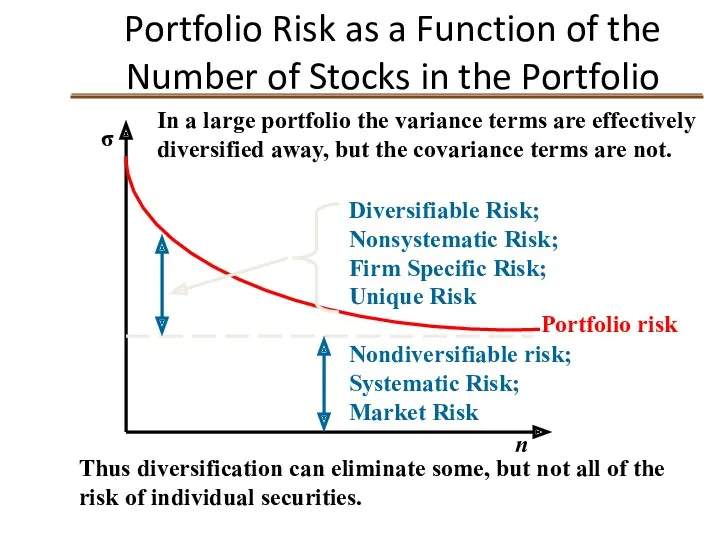
Portfolio Risk as a Function of the Number of Stocks in
Portfolio Risk as a Function of the Number of Stocks in
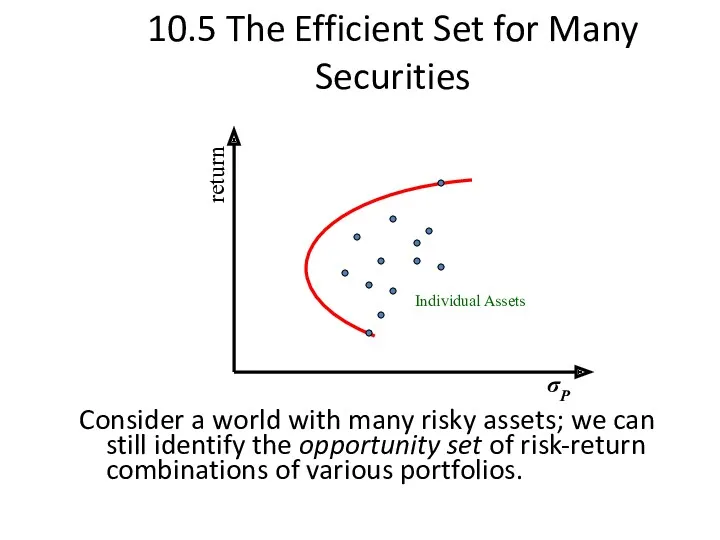
10.5 The Efficient Set for Many Securities
Consider a world with many
10.5 The Efficient Set for Many Securities
Consider a world with many
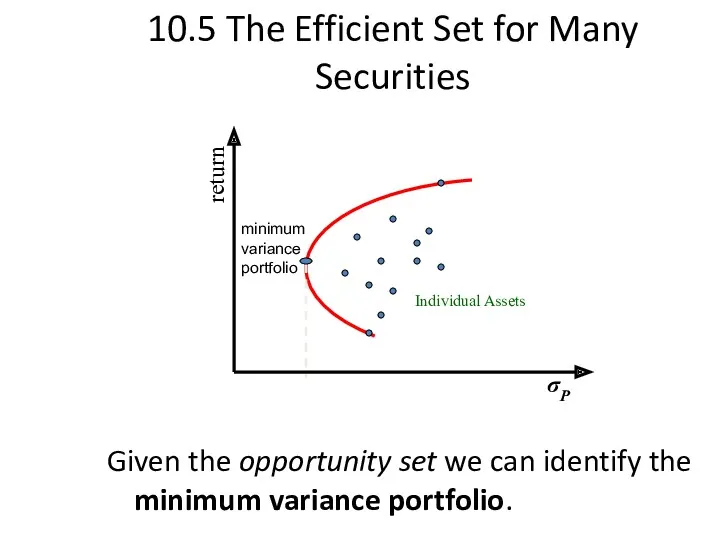
10.5 The Efficient Set for Many Securities
Given the opportunity set we
10.5 The Efficient Set for Many Securities
Given the opportunity set we
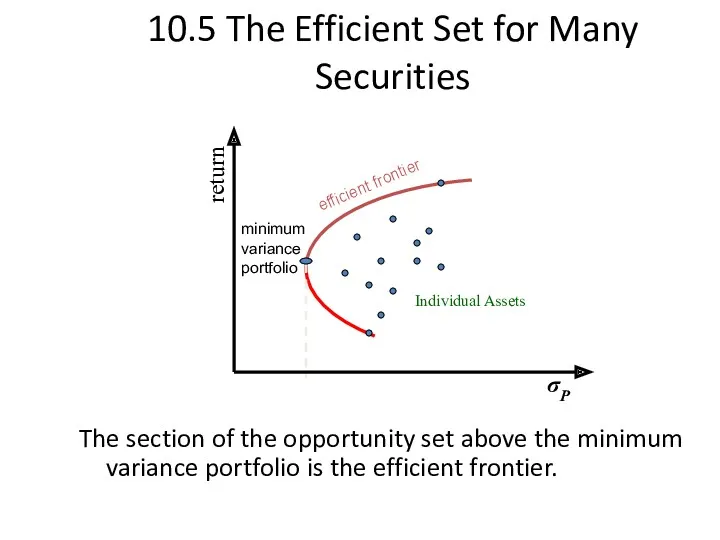
10.5 The Efficient Set for Many Securities
The section of the opportunity
10.5 The Efficient Set for Many Securities
The section of the opportunity
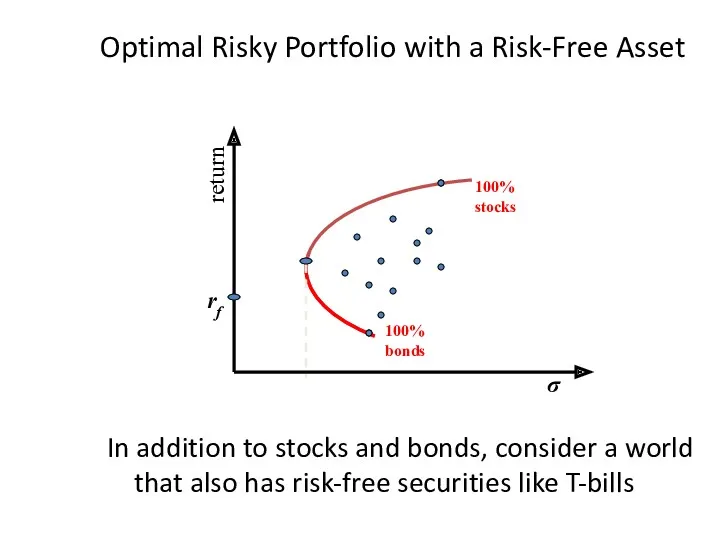
Optimal Risky Portfolio with a Risk-Free Asset
In addition to stocks
Optimal Risky Portfolio with a Risk-Free Asset
In addition to stocks
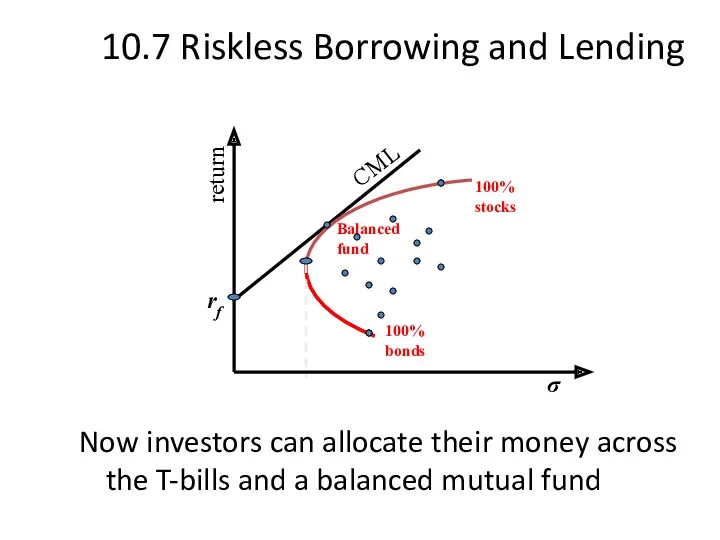
10.7 Riskless Borrowing and Lending
Now investors can allocate their money across
10.7 Riskless Borrowing and Lending
Now investors can allocate their money across

10.7 Riskless Borrowing and Lending
With a risk-free asset available and the
10.7 Riskless Borrowing and Lending
With a risk-free asset available and the
10.8 Market Equilibrium
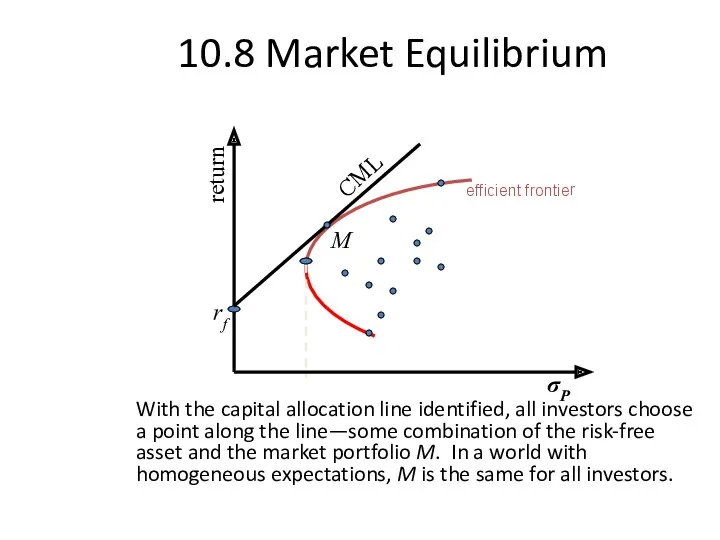
With the capital allocation line identified, all investors choose
10.8 Market Equilibrium
With the capital allocation line identified, all investors choose
The Separation Property
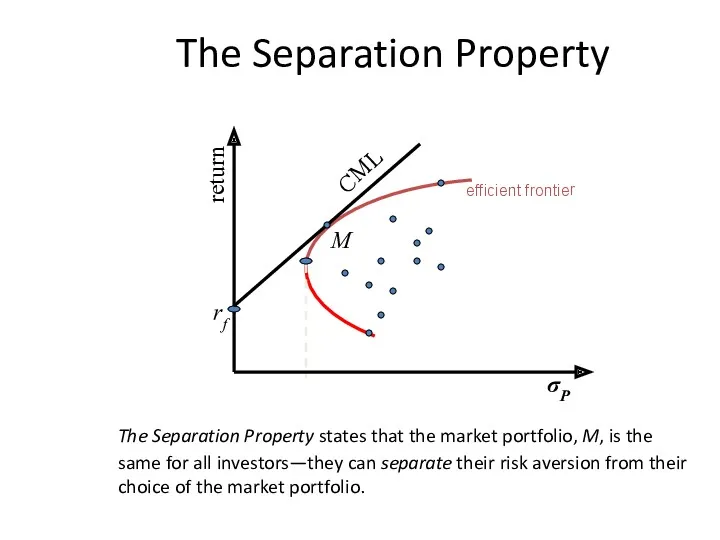
The Separation Property states that the market portfolio,
The Separation Property
The Separation Property states that the market portfolio,
The Separation Property
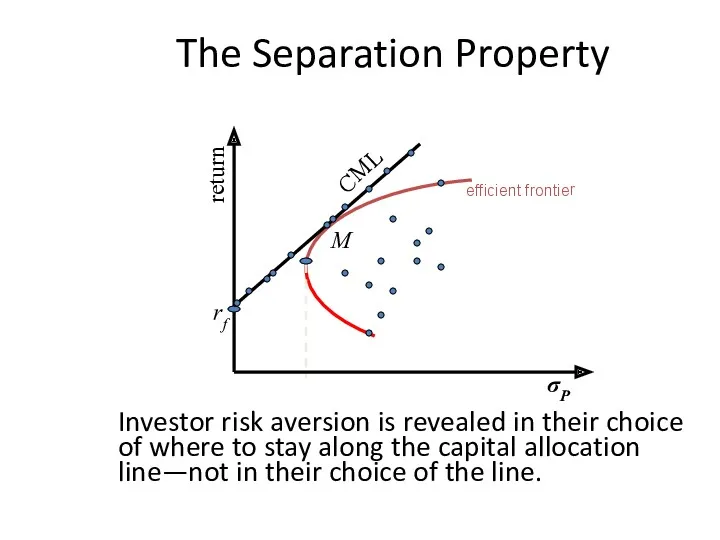
Investor risk aversion is revealed in their choice
The Separation Property
Investor risk aversion is revealed in their choice
Market Equilibrium
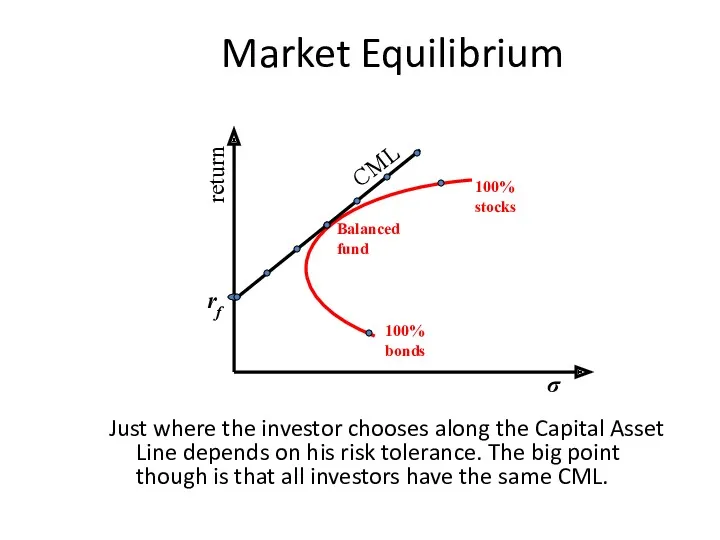
Just where the investor chooses along the Capital Asset Line
Market Equilibrium
Just where the investor chooses along the Capital Asset Line
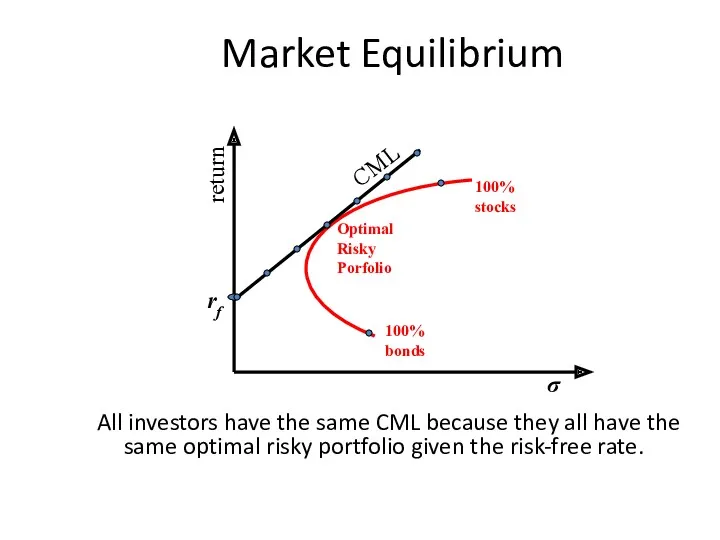
Market Equilibrium
All investors have the same CML because they all have
Market Equilibrium
All investors have the same CML because they all have
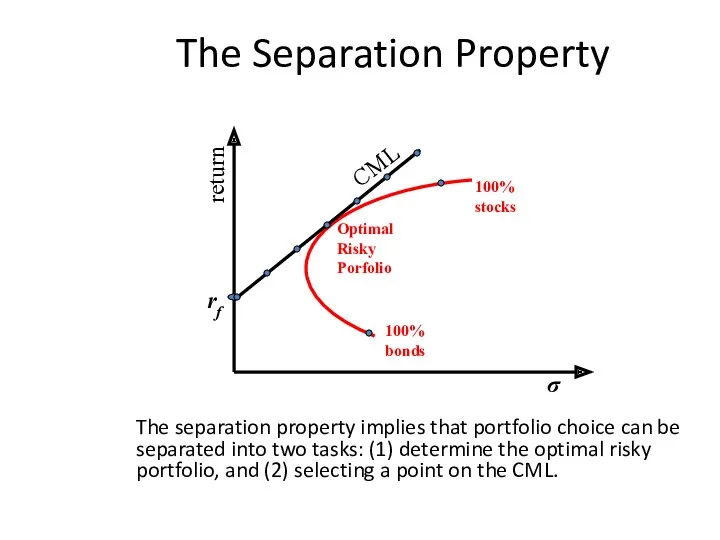
The Separation Property
The separation property implies that portfolio choice can be
The Separation Property
The separation property implies that portfolio choice can be
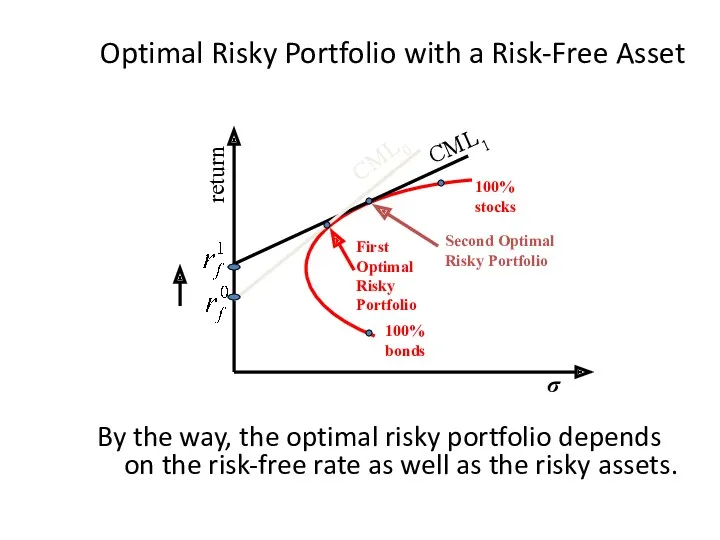
Optimal Risky Portfolio with a Risk-Free Asset
By the way, the
Optimal Risky Portfolio with a Risk-Free Asset
By the way, the
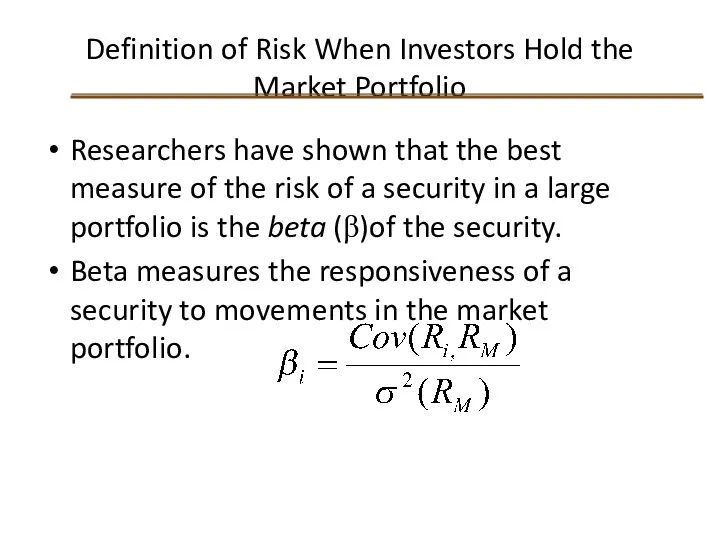
Definition of Risk When Investors Hold the Market Portfolio
Researchers have shown
Definition of Risk When Investors Hold the Market Portfolio
Researchers have shown
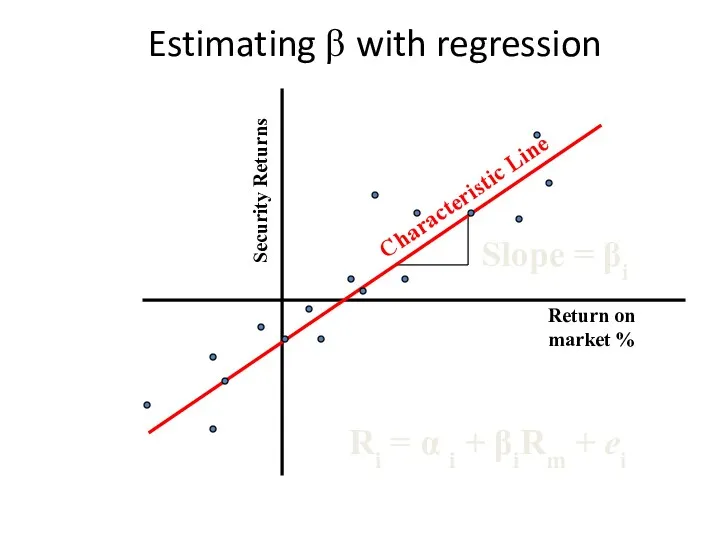
Estimating β with regression
Security Returns
Return on market %
Ri = α i
Estimating β with regression
Security Returns
Return on market %
Ri = α i
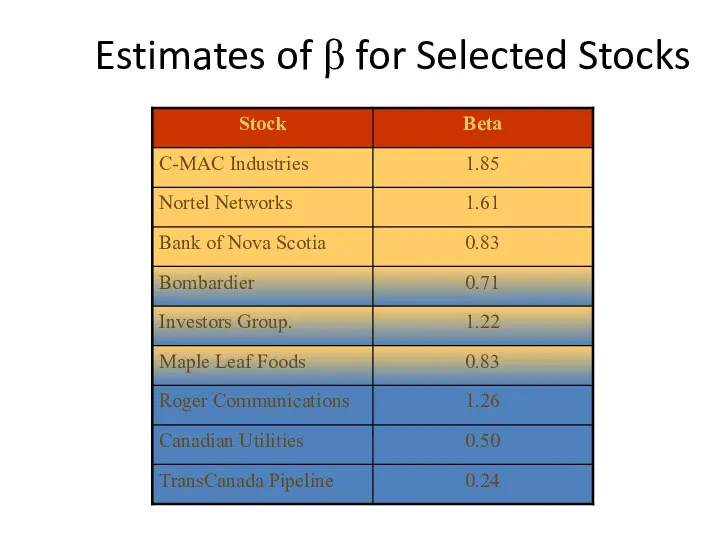
Estimates of β for Selected Stocks
Estimates of β for Selected Stocks
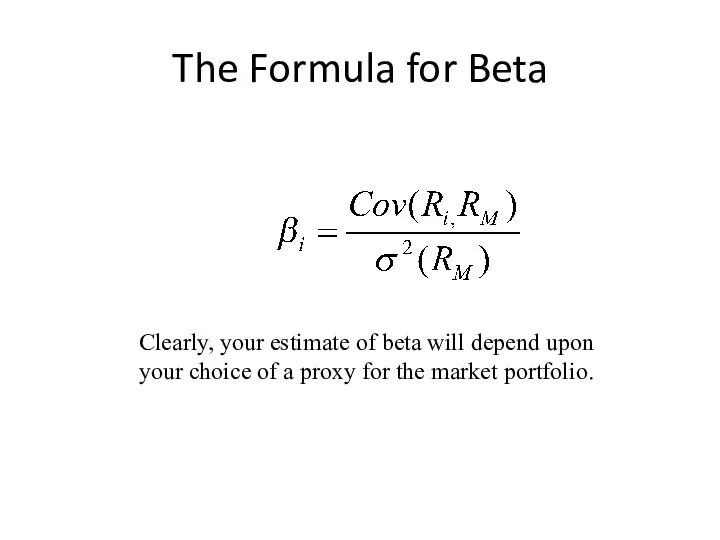
The Formula for Beta
Clearly, your estimate of beta will depend upon
The Formula for Beta
Clearly, your estimate of beta will depend upon
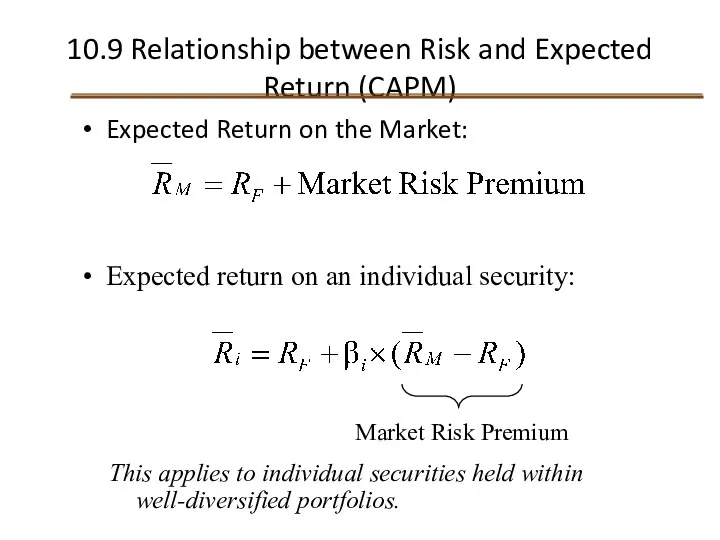
10.9 Relationship between Risk and Expected Return (CAPM)
Expected Return on the
10.9 Relationship between Risk and Expected Return (CAPM)
Expected Return on the
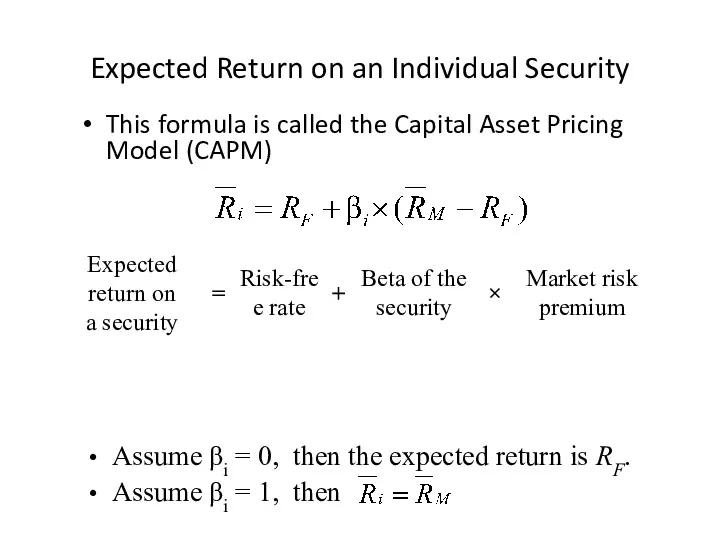
Expected Return on an Individual Security
This formula is called the Capital
Expected Return on an Individual Security
This formula is called the Capital
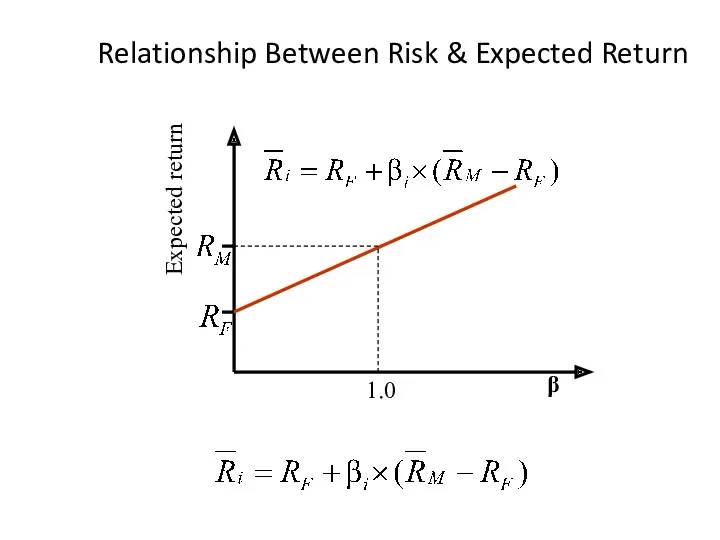
Relationship Between Risk & Expected Return
Expected return
β
1.0
Relationship Between Risk & Expected Return
Expected return
β
1.0
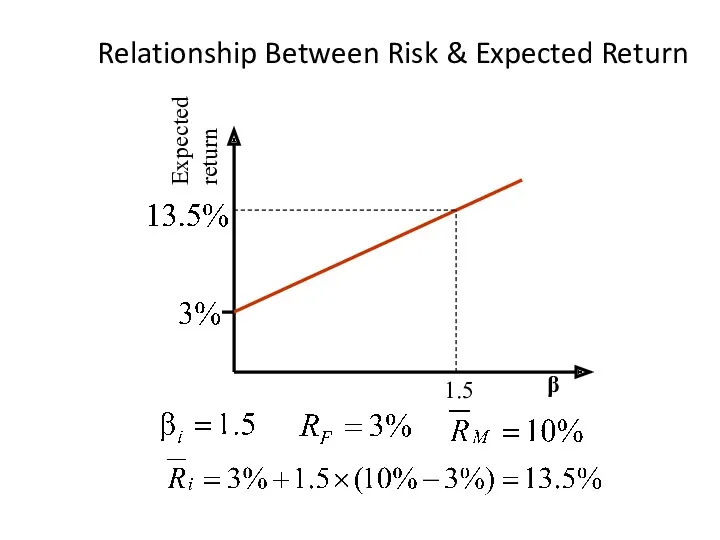
Relationship Between Risk & Expected Return
Expected return
β
1.5
Relationship Between Risk & Expected Return
Expected return
β
1.5
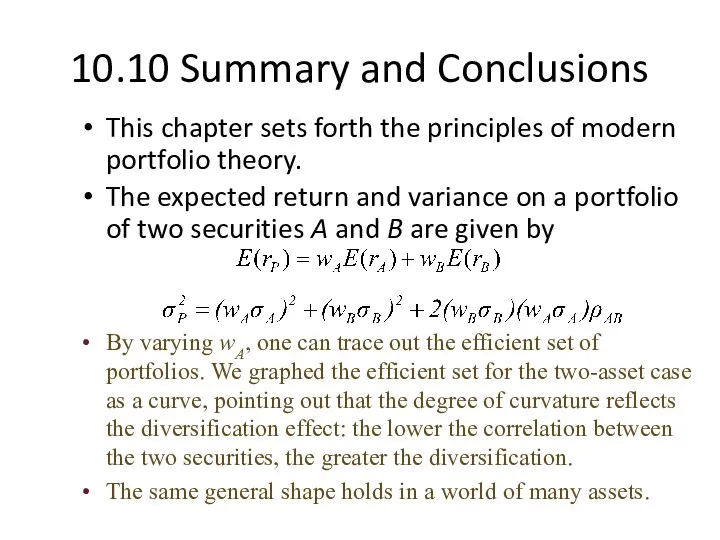
10.10 Summary and Conclusions
This chapter sets forth the principles of modern
10.10 Summary and Conclusions
This chapter sets forth the principles of modern
10.10 Summary and Conclusions
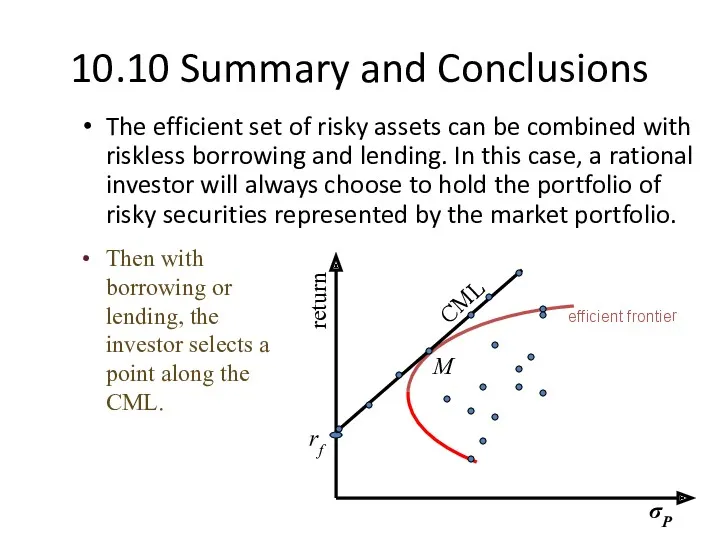
The efficient set of risky assets can be
10.10 Summary and Conclusions
The efficient set of risky assets can be
 Методология таможенной статистики
 Международная академия бизнеса. Международные стандарты финансовой отчётности
 Страхование экспортных кредитов в Чехии
 Итоги работы управления Федерального казначейства по Курской области
 Виды стипендий. Оcобенности назначения государственной социальной стипендии,
 Loan Repayment Options: What You Need to Know
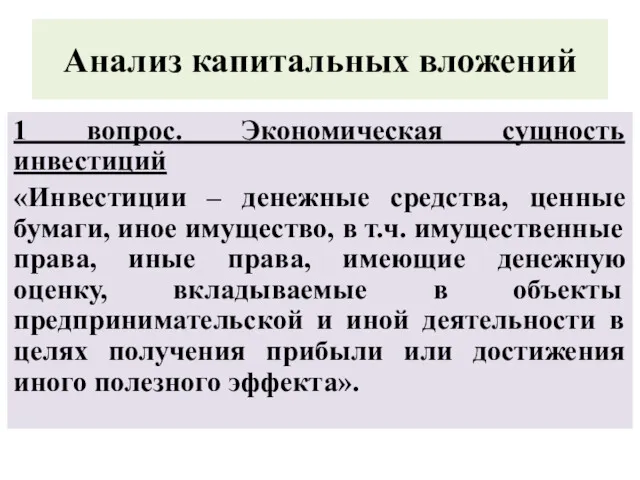 Анализ капитальных вложений
 Инвестиция. Инвестициялар төмендегі мақсаттарды шешуге көмектеседі
 Налог на доходы физических лиц
 Персонал предприятия. Понятие и классификация персонала. Показатели эффективности использования трудовых ресурсов
 Организационные основы проведения финансового контроля. (Лекция 3)
 Как заработать больше, а тратить меньше
 Проект поддержки местных инициатив (ППМИ)
 Денежные фонды и резервы организации
 Оценка финансово-хозяйственной деятельности предприятия в системе экономической безопасности предприятия
 Зарплатный проект Газпромбанк
 О публичных обязательствах в 2018 году
 Price. Pricing Considerations
 Сутність страхування
 Фінансова стратегія підприємства
 Money show film - history of money
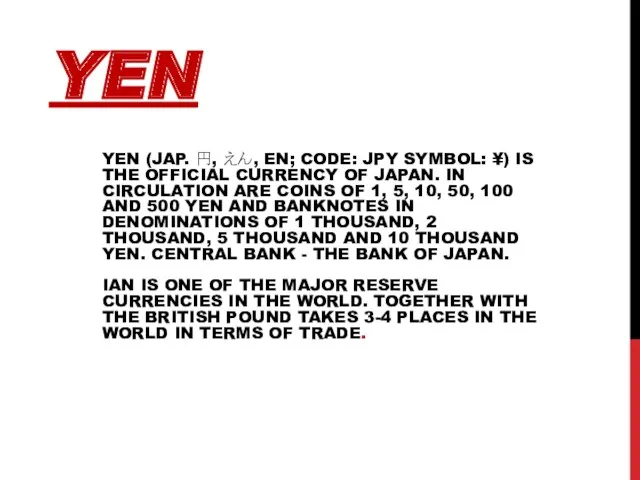 The official currency japanese, yen
 Нормативная база ценообразования в строительстве. Сметно-нормативная база
 Государственный кредит
 Финансовый сектор экономики и основы его функционирования
 Бизнес-ангелы и их роль в современной экономике
 Ценовая политика
 Бонистика. Виды бумажных денежных знаков и ценных бумаг