- The Hershey Company SEC

Содержание
- 2. The Hershey Company…a bit of History The Hershey Company was founded in 1894 by Milton S.
- 3. Hershey: Income Statement – Revenue Hershey has had steady Revenue growth since 2015 Net Sales grew
- 4. Hershey: Income Statement – Expenses Hershey reducing SG&A to essential spending Goodwill and asset impairments associated
- 5. The Hershey Company: Net Income/EPS Hershey’s Net Income increased 40% in 2016 and 9% in 2017
- 6. Hershey: Balance Sheet Analysis Assets: Hershey’s PPE represents the largest asset at 38% of total assets.
- 7. Hershey: Statement of Cash Flow Operating Activities: Hershey provides cash flow from operations Increased by $236M
- 8. Hershey: Ratio Analysis - 2017 Current Ratio: Hershey has $.96 for every $1 of assets to
- 9. Hershey: Vertical Analysis – Income Statement The cost of sales (a) is 54% of the net
- 10. Hershey: Vertical Analysis – Balance Sheet Accounts receivable (c) at 11% of total assets. Hershey’s receivable
- 11. Hershey: Horizontal Analysis – Income Statement
- 13. Скачать презентацию

The Hershey Company…a bit of History
The Hershey Company was founded in
The Hershey Company…a bit of History
The Hershey Company was founded in
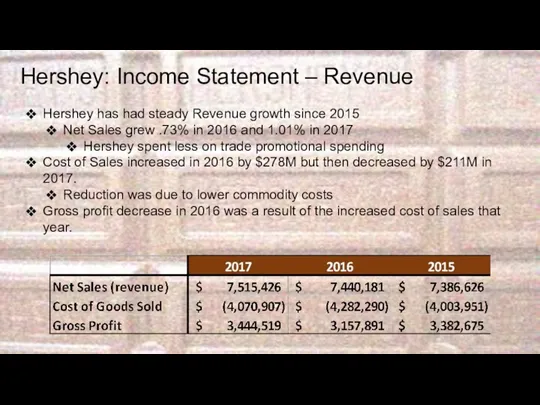
Hershey: Income Statement – Revenue
Hershey has had steady Revenue growth since
Hershey: Income Statement – Revenue
Hershey has had steady Revenue growth since
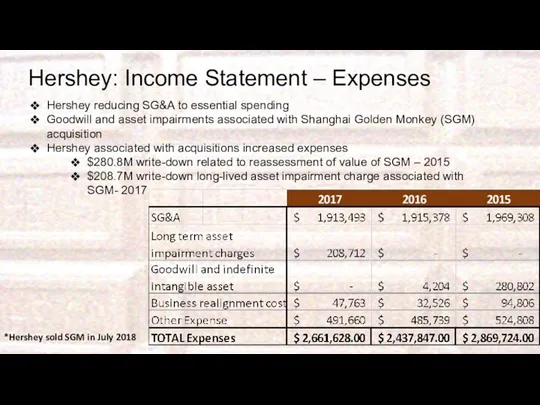
Hershey: Income Statement – Expenses
Hershey reducing SG&A to essential spending
Goodwill
Hershey: Income Statement – Expenses
Hershey reducing SG&A to essential spending
Goodwill
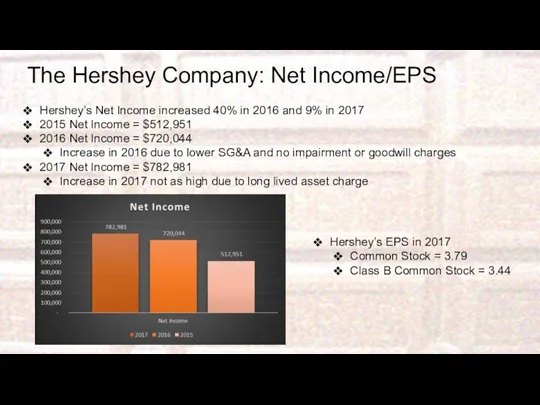
The Hershey Company: Net Income/EPS
Hershey’s Net Income increased 40% in 2016
The Hershey Company: Net Income/EPS
Hershey’s Net Income increased 40% in 2016
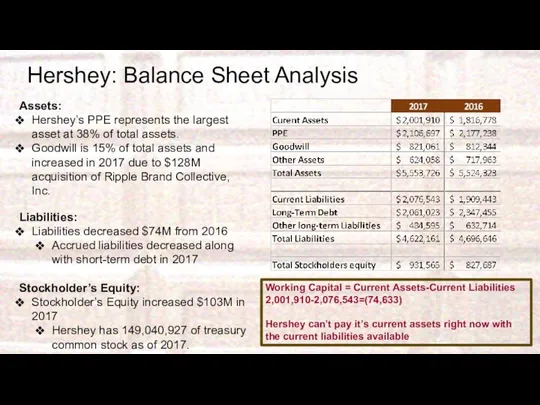
Hershey: Balance Sheet Analysis
Assets:
Hershey’s PPE represents the largest asset at 38%
Hershey: Balance Sheet Analysis
Assets:
Hershey’s PPE represents the largest asset at 38%
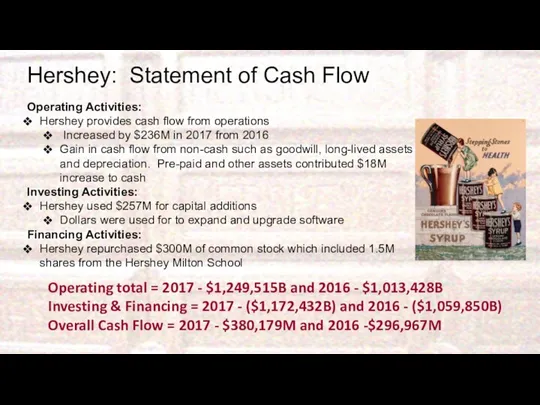
Hershey: Statement of Cash Flow
Operating Activities:
Hershey provides cash flow from operations
Hershey: Statement of Cash Flow
Operating Activities:
Hershey provides cash flow from operations
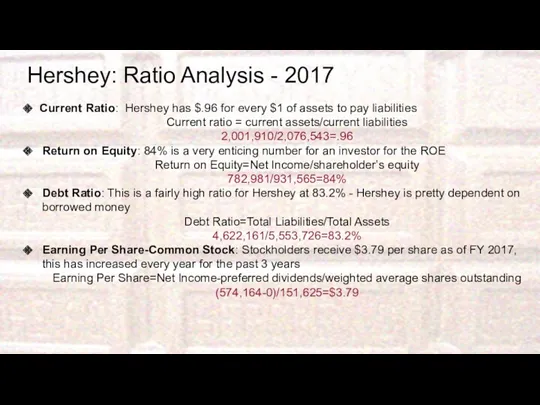
Hershey: Ratio Analysis - 2017
Current Ratio: Hershey has $.96 for every
Hershey: Ratio Analysis - 2017
Current Ratio: Hershey has $.96 for every
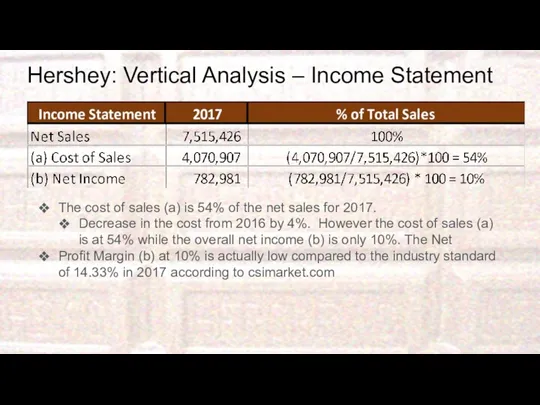
Hershey: Vertical Analysis – Income Statement
The cost of sales (a) is
Hershey: Vertical Analysis – Income Statement
The cost of sales (a) is
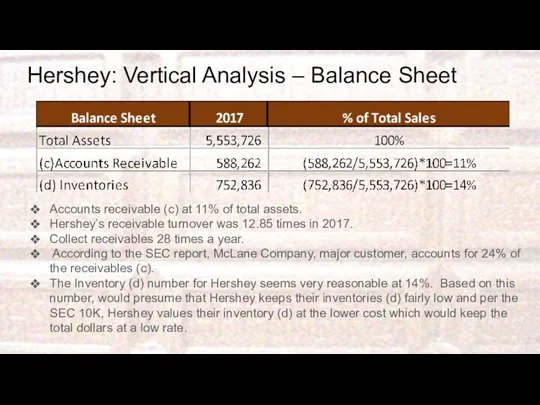
Hershey: Vertical Analysis – Balance Sheet
Accounts receivable (c) at 11% of
Hershey: Vertical Analysis – Balance Sheet
Accounts receivable (c) at 11% of
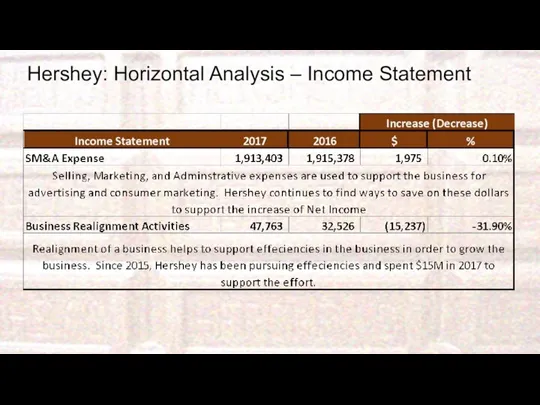
Hershey: Horizontal Analysis – Income Statement
Hershey: Horizontal Analysis – Income Statement
 Бюджет для граждан
 Задачі Заповнення чека на одержання готівки
 Задачі Заповнення видаткових касових ордерів
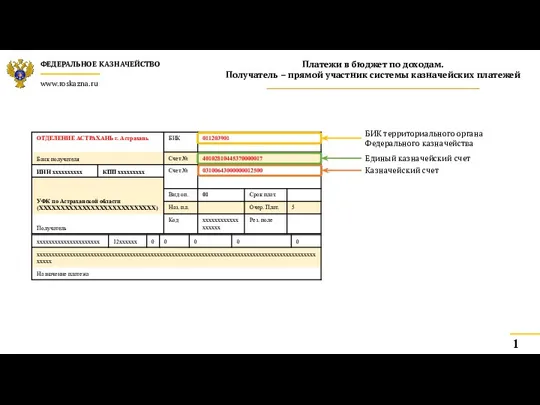 Платежи в бюджет по доходам. Пример заполнения платежных поручений. Федеральное казначейство г. Астрахань
 Kako v 5 minutah rešiti davčni vidik kriptovalut
 Методология информационного моделирования IDEF1X
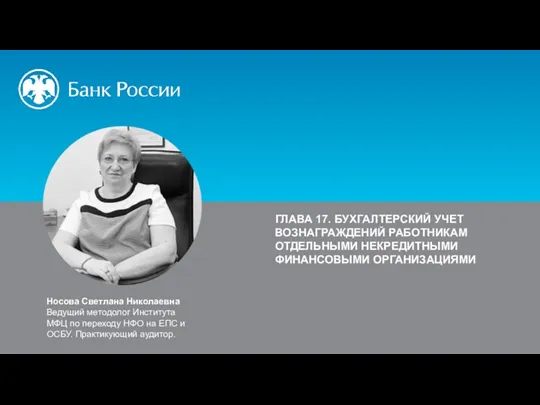 Учет вознаграждений работникам отдельными некредитными финансовыми организациями. Глава 17
 Introduction to business. Lecture 3
 Характеристика основных методов снижения экономического риска. Системаа методов управления рисками предприятия
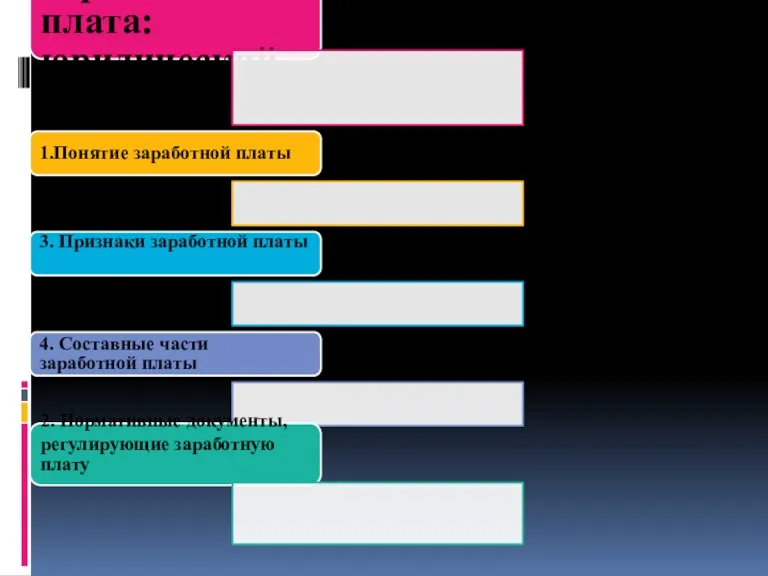 Заработная плата: юридический аспект
 Как приобрести и хранить биткоин и все остальные криптовалюты
 Организация оплаты труда на предприятии
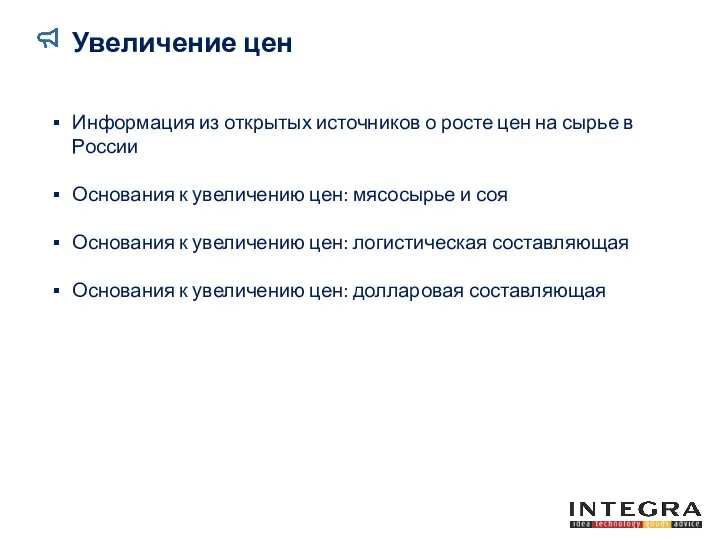 Увеличение цен. Основания к увеличению цен
 Фигуры технического анализа
 Insurance and risk
 Децентрализованная финансовая экосистема на платформе BitShares 2.0 (Graphene)
 Карта KPI РБ 2.0
 Финансовый анализ положения компании Вимм-БильДанн
 Анализ портфеля акций
 Інвестування (семінар 2)
 Организация налично –денежного обращения
 Методика расчета и уплаты налогов НДС: порядок исчисления и уплаты, налоговые вычеты
 Анализ развития банковских услуг на примере ОАО АК Сберегательного банка РФ и совершенствование их в современных условиях
 Инициативное предложение члена бюджетной комиссии Михайловой Валентины Викторовны в рамках проекта Народный бюджет
 Учет материально-производственных запасов
 Международное налоговое планирование: от выбора юрисдикции до оспаривания в суде
 Налоговая система РФ
 Бюджет для граждан