- Money Demand, Money Supply, Liquidity Trap

Содержание
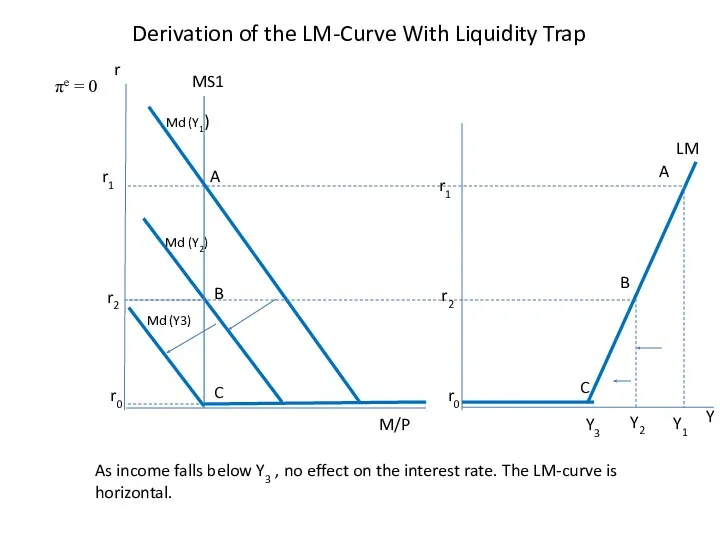
Derivation of the LM-Curve With Liquidity Trap
r
M/P
MS1
Md
Derivation of the LM-Curve With Liquidity Trap
r
M/P
MS1
Md
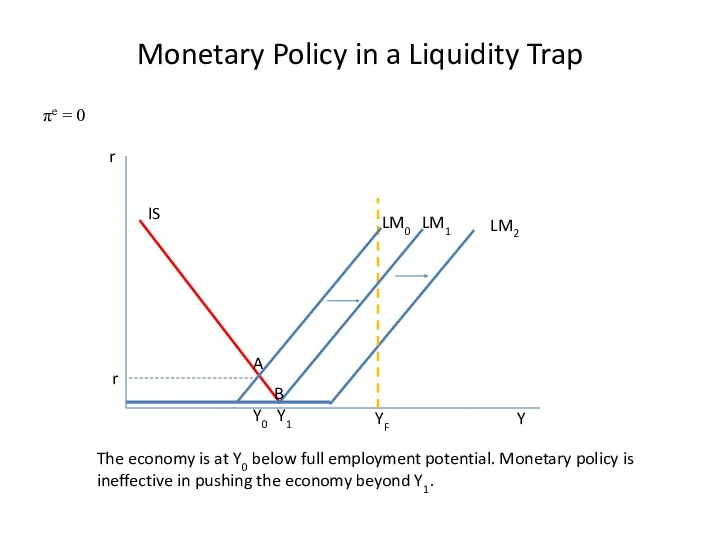
Monetary Policy in a Liquidity Trap
r
Y
Y0
YF
LM1
Monetary Policy in a Liquidity Trap
r
Y
Y0
YF
LM1
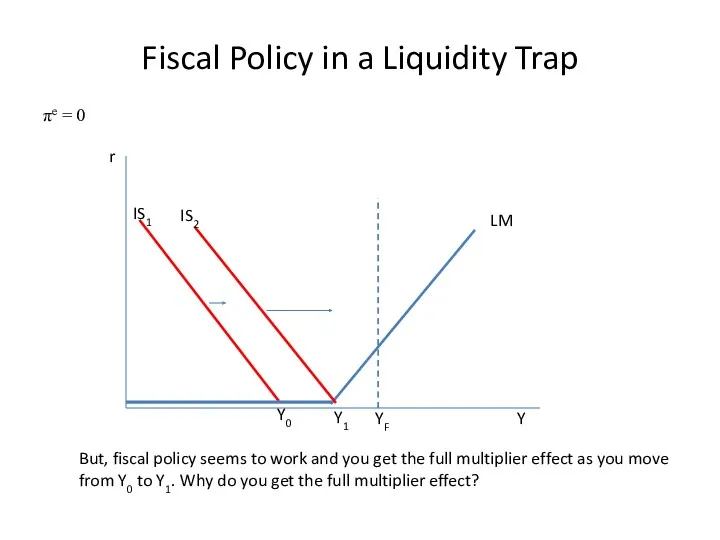
Fiscal Policy in a Liquidity Trap
r
Y
Y0
YF
LM
Fiscal Policy in a Liquidity Trap
r
Y
Y0
YF
LM
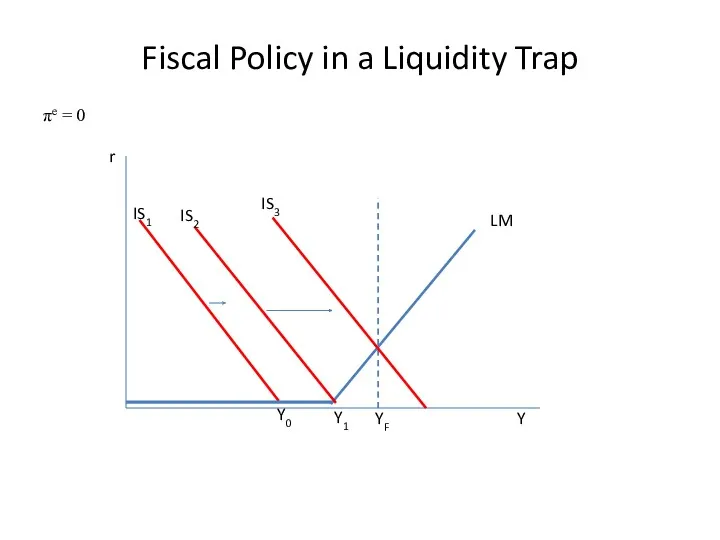
Fiscal Policy in a Liquidity Trap
r
Y
Y0
YF
LM
Fiscal Policy in a Liquidity Trap
r
Y
Y0
YF
LM
 Стипендиальное обеспечение в науке и учёбе
 Облік процесу виробництва продукції, виконання робіт та послуг
 Понятие коммерческого банка, основные функции и операции коммерческих банков
 Управление личными финансами. Доходы семьи
 Управление личными финансами. Сбережения и инвестиции семьи
 Финансовая грамотность. 10 класс
 Финансовое состояние предприятия
 Управление дебиторской и кредиторской задолженностью организации АО Компания Росинка, г. Липецк
 Казначейское сопровождение как элемент государственного финансового контроля
 Оценка кредитоспособности ПАО Аэрофлот
 Анализ эффективности деятельности организации на основании данных бухгалтерской (финансовой) отчетности ООО РусснабгруппНН
 Оздоровление и отдых членов профсоюза
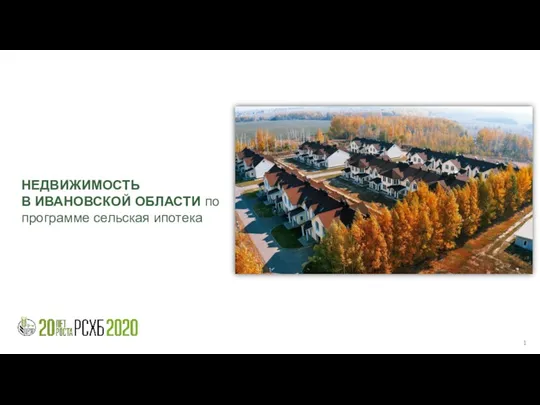 Недвижимость в Ивановской области по программе сельская ипотека
 Задачи по корпоративным финансам
 Анализ финансового состояния предприятия
 Суть, мета і завдання управлінського обліку (тема 1)
 Охрана труда. Финансирование
 Banking
 Российский сельскохозяйственный банк АО Россельхозбанк
 Фонд по содействию кредитованию субъектов малого и среднего предпринимательства Республики Карелия
 Ключевые направления деятельности ФНС России по созданию благоприятной налоговой среды
 Понятие финансового права. Предмет и метод финансового права. Место финансового права в единой системе российского права
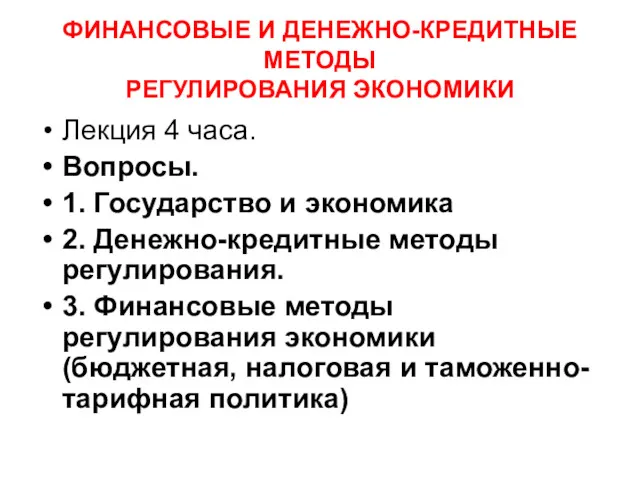 Финансовые и денежно-кредитные методы регулирования экономики
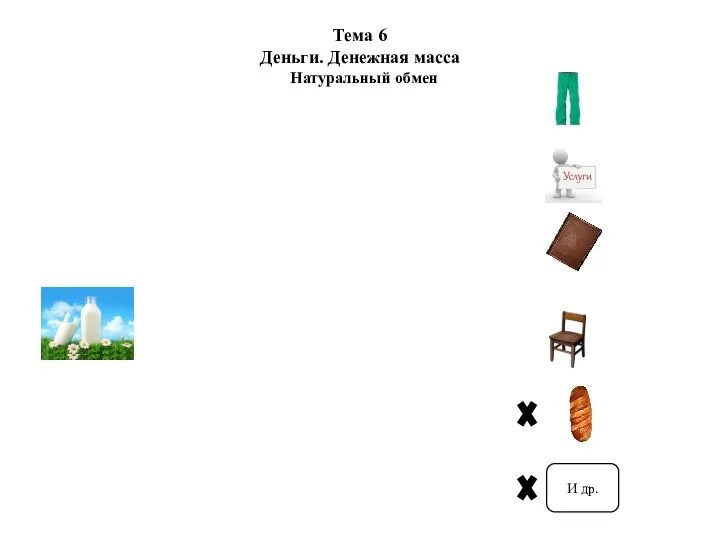 Деньги. Денежная масса. Натуральный обмен
 Раздел 4. Ревизия бухгалтерского учёта. Тема 4.4. Ревизия денежных средств
 Тест по бухгалтерскому учету
 Ценовая политика
 Виды ценных бумаг. Их особенности и различия, права владельцев акций и облигаций