- The Financial Sector

Содержание
- 2. Saving, Investment, and the Financial System Savings-investment spending identity: savings and investment spending are always equal
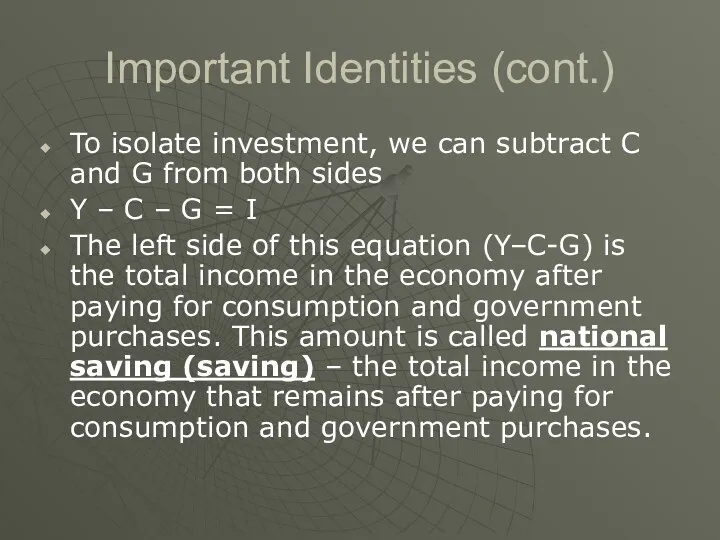
- 3. Important Identities (cont.) To isolate investment, we can subtract C and G from both sides Y
- 4. Important Identities (cont.) Substitute saving (S) into our identity gives us: S=I This equation tells us
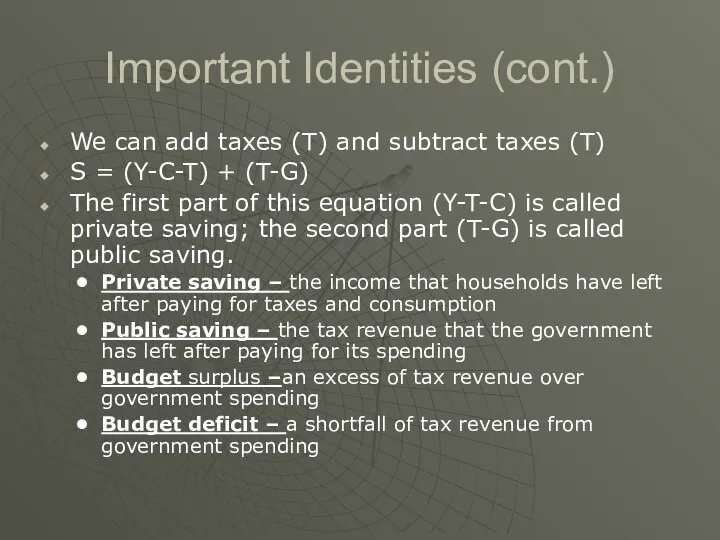
- 5. Important Identities (cont.) We can add taxes (T) and subtract taxes (T) S = (Y-C-T) +
- 6. Important Identities (cont.) The fact that S=I means that for the economy as a whole saving
- 7. Open Economy: Savings and Investments Savings of people in one country can be used to finance
- 8. The Meaning of Saving and Investment In macroeconomics, investment refers to the purchase of new capital,
- 9. The Meaning of Saving and Investment Private saving is the income remaining after households pay their
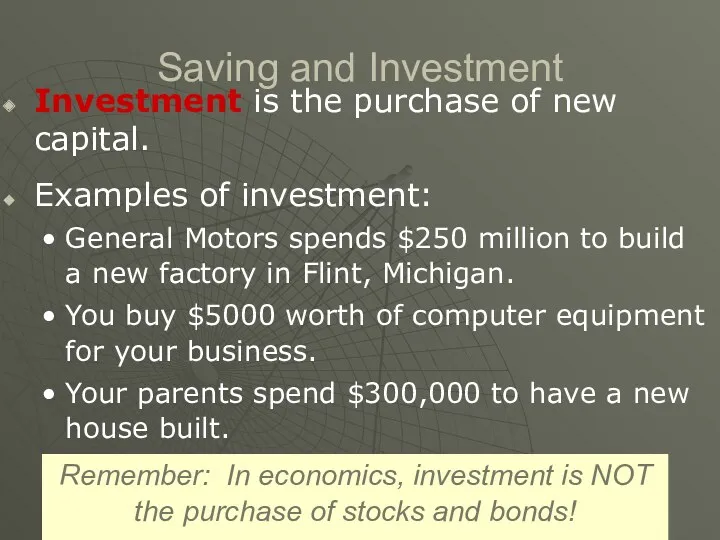
- 10. Saving and Investment Investment is the purchase of new capital. Examples of investment: General Motors spends
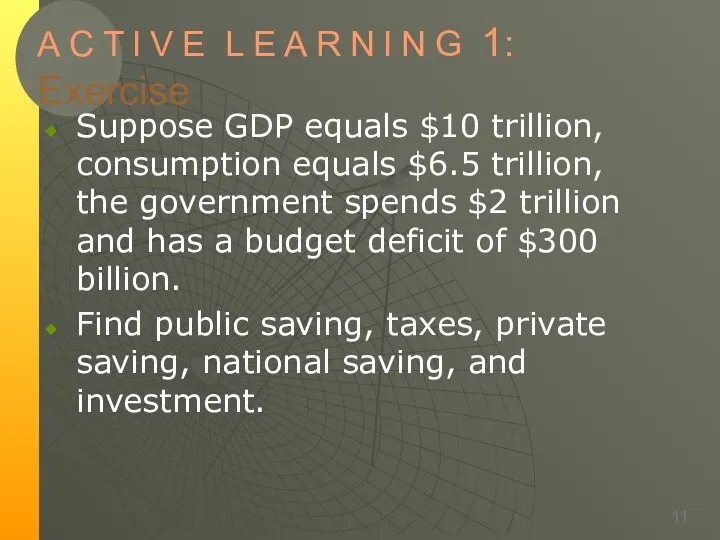
- 11. A C T I V E L E A R N I N G 1: Exercise
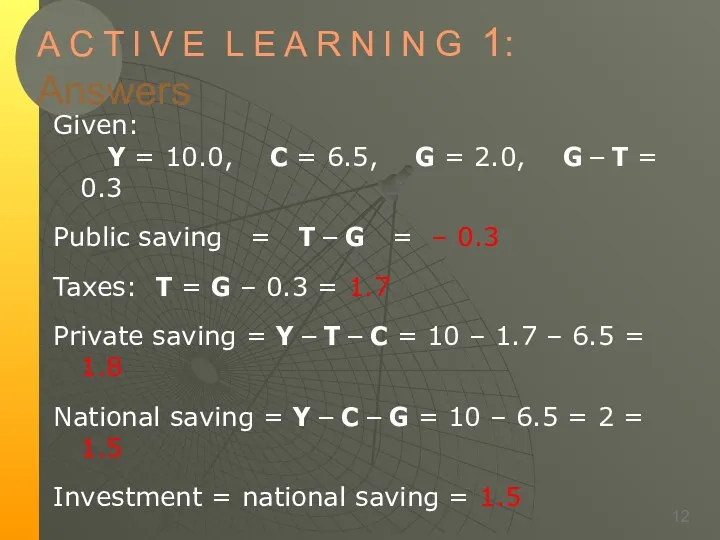
- 12. A C T I V E L E A R N I N G 1: Answers
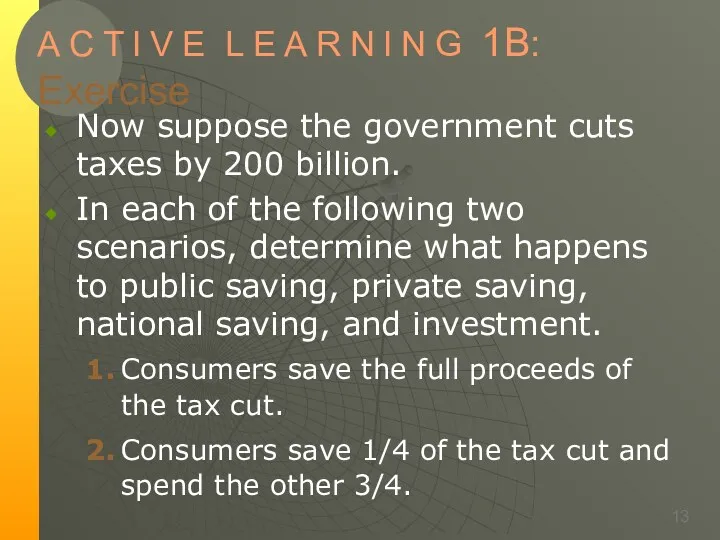
- 13. A C T I V E L E A R N I N G 1B: Exercise
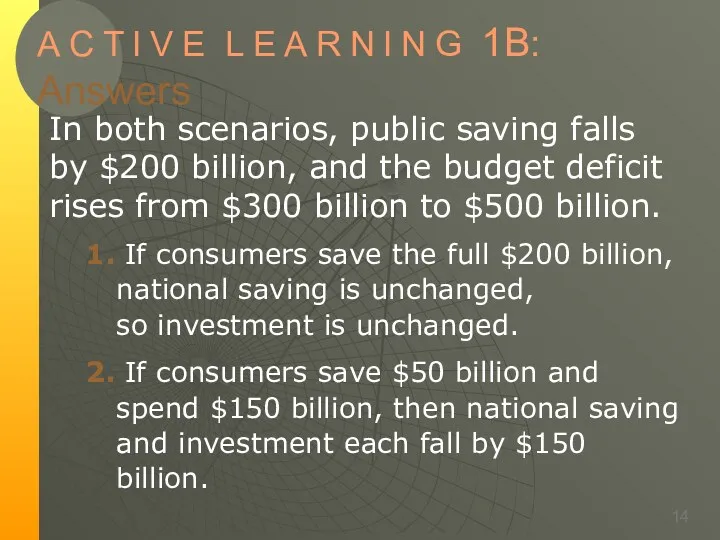
- 14. A C T I V E L E A R N I N G 1B: Answers
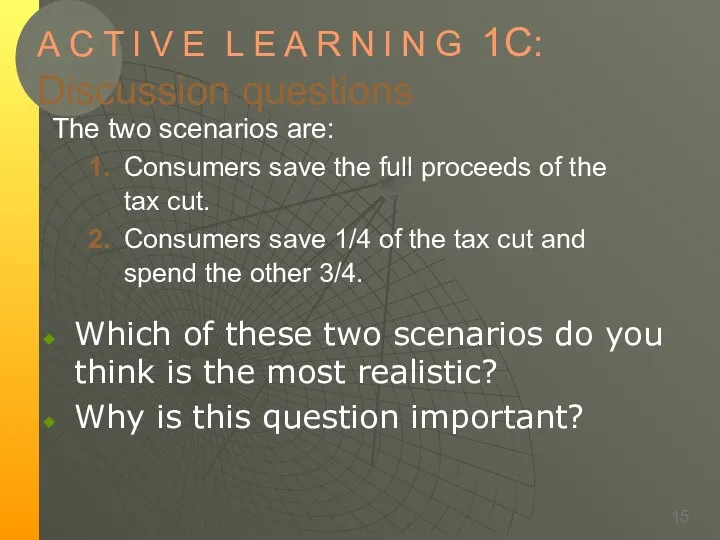
- 15. A C T I V E L E A R N I N G 1C: Discussion
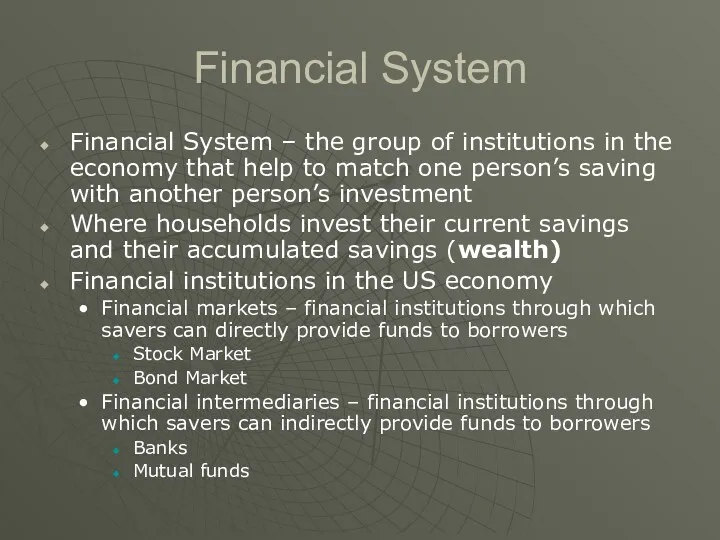
- 16. Financial System Financial System – the group of institutions in the economy that help to match
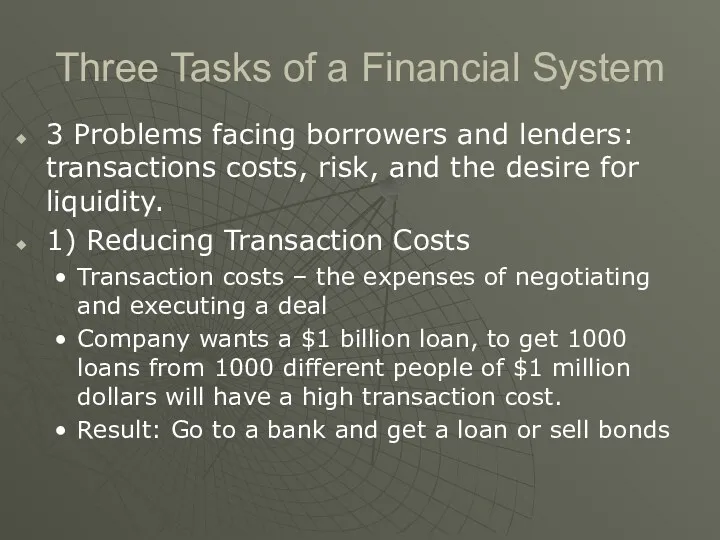
- 17. Three Tasks of a Financial System 3 Problems facing borrowers and lenders: transactions costs, risk, and
- 18. Three Tasks of a Financial System 2) Reducing Risk Financial risk – uncertainty about future outcomes
- 19. Risk Aversion Most people are risk averse – they dislike uncertainty. Example: You are offered the
- 20. The Utility Function Utility is a subjective measure of well-being that depends on wealth. As wealth
- 21. The Utility Function and Risk Aversion Because of diminishing marginal utility, a $1000 loss reduces utility
- 22. Three Tasks of a Financial System 3) Providing Liquidity Liquid asset is an asset that can
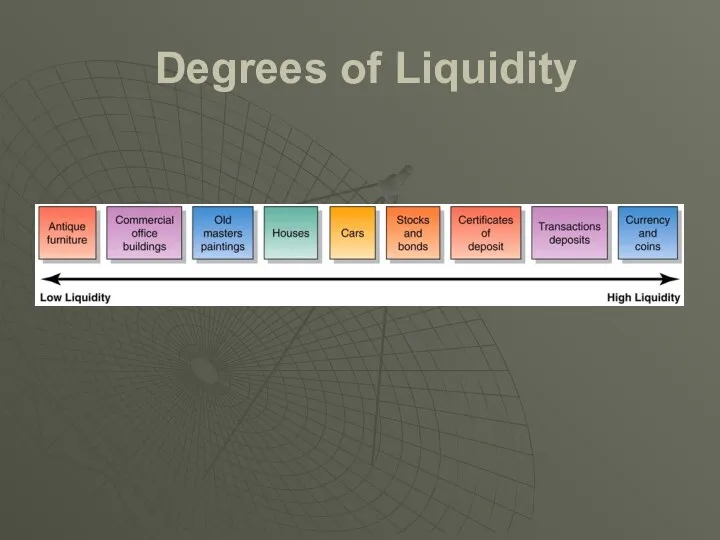
- 23. Degrees of Liquidity
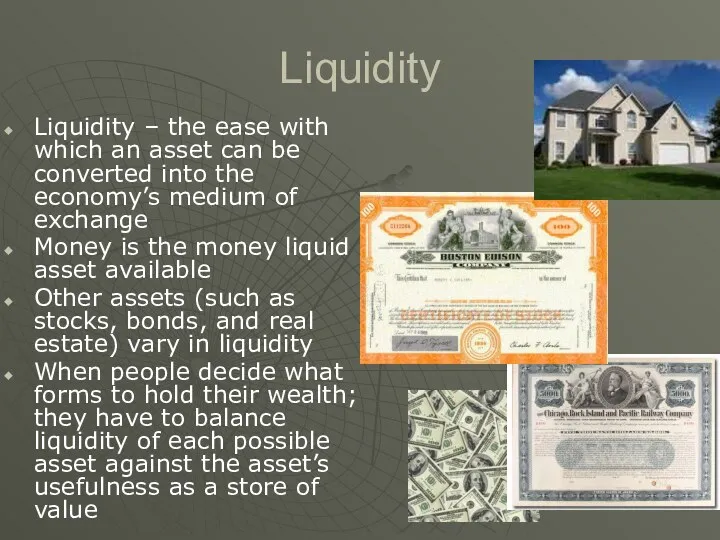
- 24. Liquidity Liquidity – the ease with which an asset can be converted into the economy’s medium
- 25. Financial markets The Bond Market Bond – a certificate of indebtedness A bond identifies the date
- 26. Characteristics of a Bond One characteristic that determines a bond’s value is its term. The term
- 27. Financial Markets Stock Market Stock – a claim to partial ownership in a firm The sale
- 28. Financial Assets Stock Bond Loan – a lending agreement between an individual lender and an individual
- 29. Financial Intermediaries Banks The primary role of banks is to take in deposits from people who
- 30. Financial Intermediaries Mutual funds – an institution that sells shares to the public and uses the
- 31. Financial Intermediaries Pension fund: a type of mutual fund that holds assets in order to provide
- 32. Definition and Measurement of Money Money: the set of assets in an economy that people regularly
- 33. Types of Money
- 34. The Functions of Money Medium of exchange – an item that buyers give to sellers when
- 35. Kinds of Money Commodity money: takes the form of a commodity with intrinsic value Examples: gold
- 36. Money is the U.S. Economy The quantity of money circulating in the United States is sometimes
- 37. Credit Cards, Debit Cards, and Money Credit cards are not a form of money; when a
- 38. Measures of the U.S. Money Supply M1: currency, demand deposits, traveler’s checks, and other checkable deposits.
- 39. Composition of the U.S. M1 and M2 Money Supply, 2011
- 40. Financial markets coordinate saving and investment Financial decisions involve two elements – time and risk. For
- 41. Present Value: Measuring the Time Value of Money The present value of any future value is
- 42. Present Value: Measuring the Time Value of Money r = the interest rate expressed in decimal
- 43. EXAMPLE 1: A simple deposit Deposit $100 in the bank at 5% interest. What is the
- 44. EXAMPLE 1: A Simple Deposit Deposit $100 in the bank at 5% interest. What is the
- 45. EXAMPLE 2: Investment Decision Suppose r = 0.06. Should General Motors spend $100 million to build
- 46. EXAMPLE 2: Investment Decision Instead, suppose r = 0.09. Should General Motors spend $100 million to
- 47. A C T I V E L E A R N I N G 1: Present
- 48. A C T I V E L E A R N I N G 1: Answers
- 49. Compounding Compounding: the accumulation of a sum of money where the interest earned on the sum
- 50. The Rule of 70 The Rule of 70: If a variable grows at a rate of
- 51. Banks and the Money Supply The simple case of 100 percent reserve banking A bank is
- 52. Banks and the Money Supply The money supply in this economy is unchanged by the creation
- 53. Money Creation with Fractional-Reserve Banking Fractional-reserve banking – a banking system in which banks hold only
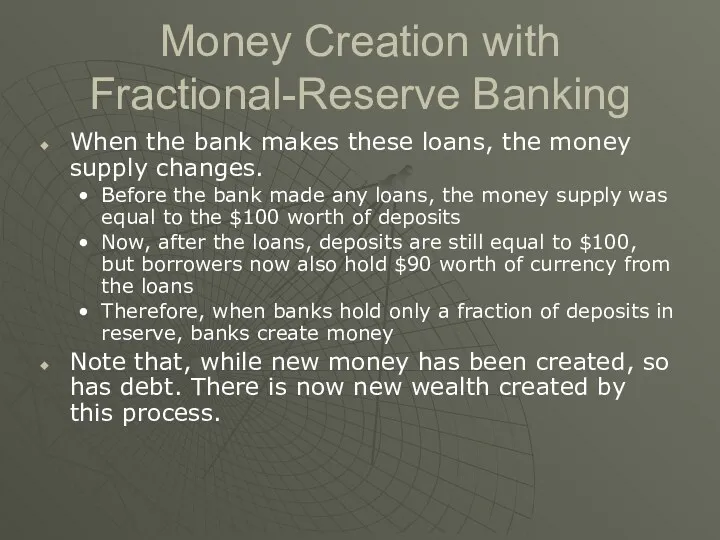
- 54. Money Creation with Fractional-Reserve Banking When the bank makes these loans, the money supply changes. Before
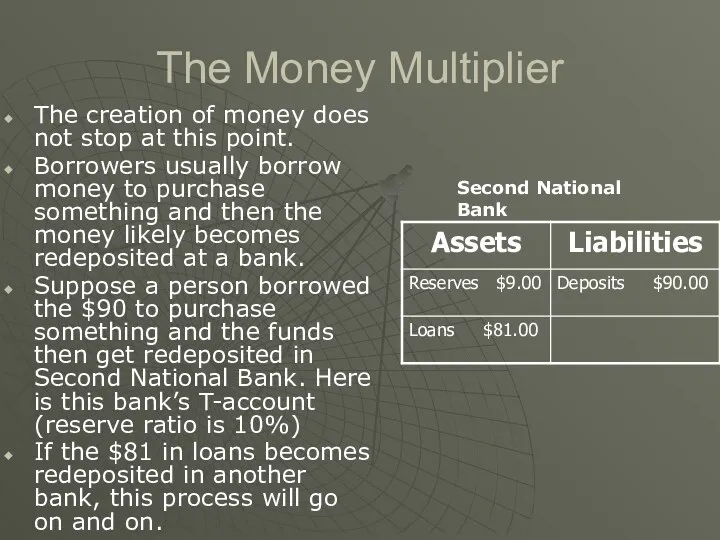
- 55. The Money Multiplier The creation of money does not stop at this point. Borrowers usually borrow
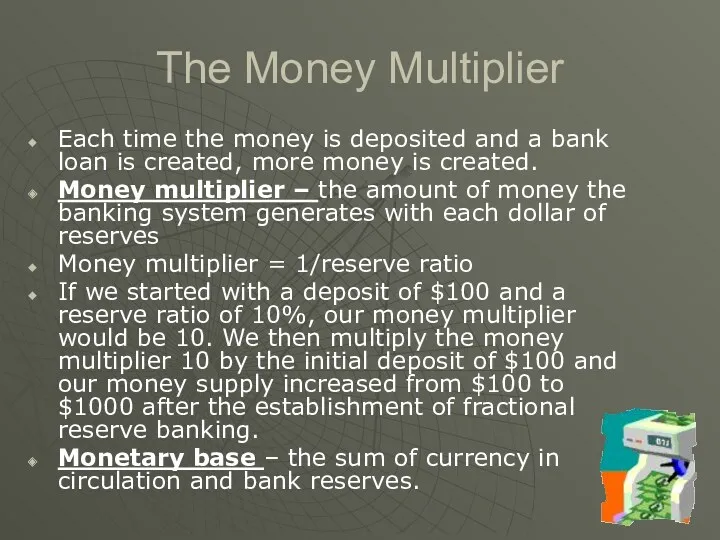
- 56. The Money Multiplier Each time the money is deposited and a bank loan is created, more
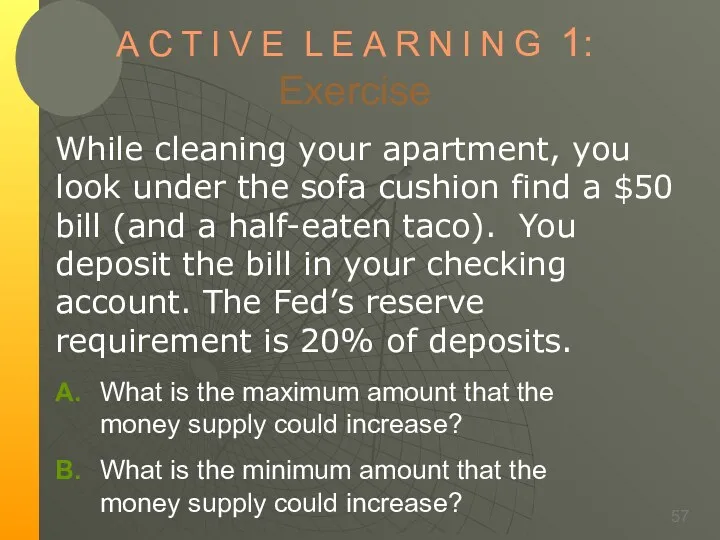
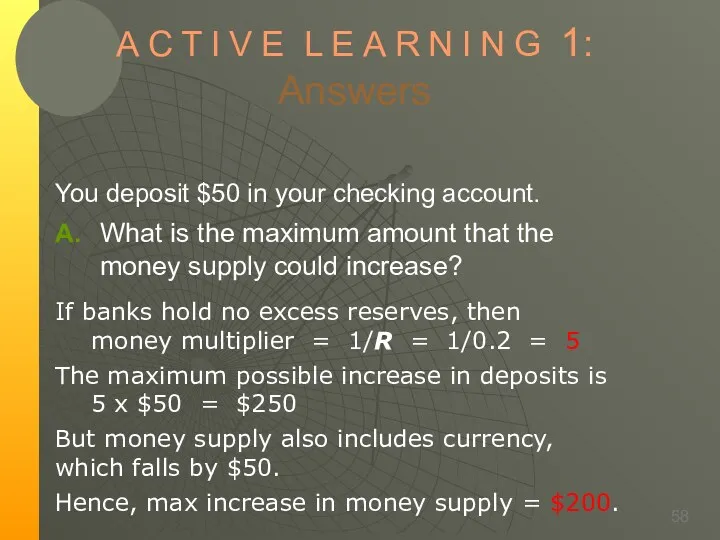
- 57. A C T I V E L E A R N I N G 1: Exercise
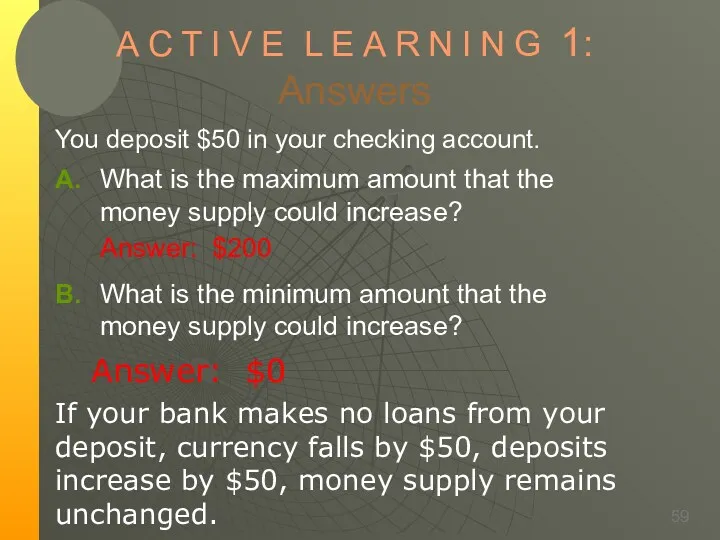
- 58. A C T I V E L E A R N I N G 1: Answers
- 59. A C T I V E L E A R N I N G 1: Answers
- 60. Bank Runs and the Money Supply Bank run – a phenomenon in which many of a
- 61. Bank Regulation Today depositors are guaranteed through the Federal Depository Insurance Corporation (FDIC). Deposit Insurance –
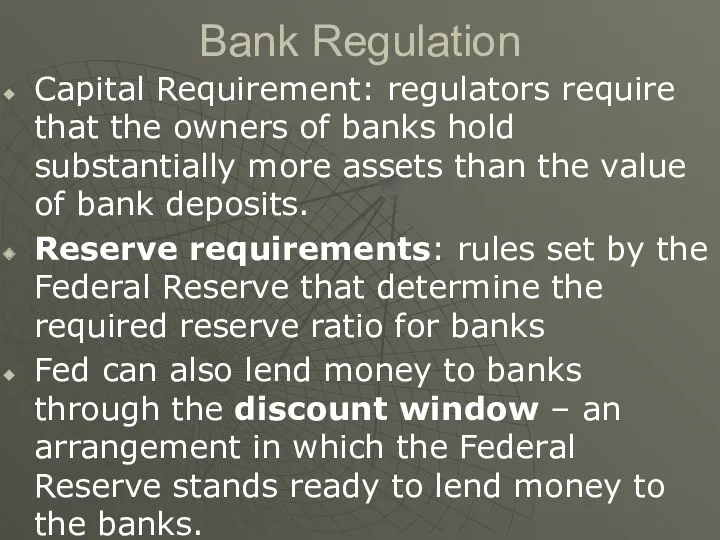
- 62. Bank Regulation Capital Requirement: regulators require that the owners of banks hold substantially more assets than
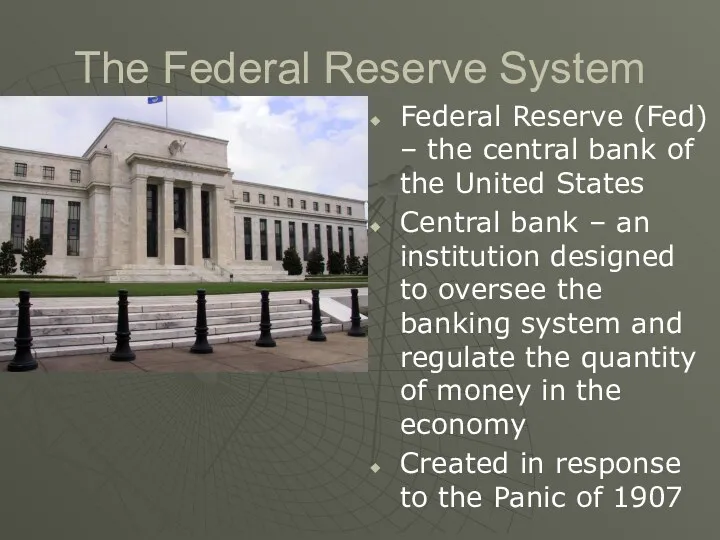
- 63. The Federal Reserve System Federal Reserve (Fed) – the central bank of the United States Central
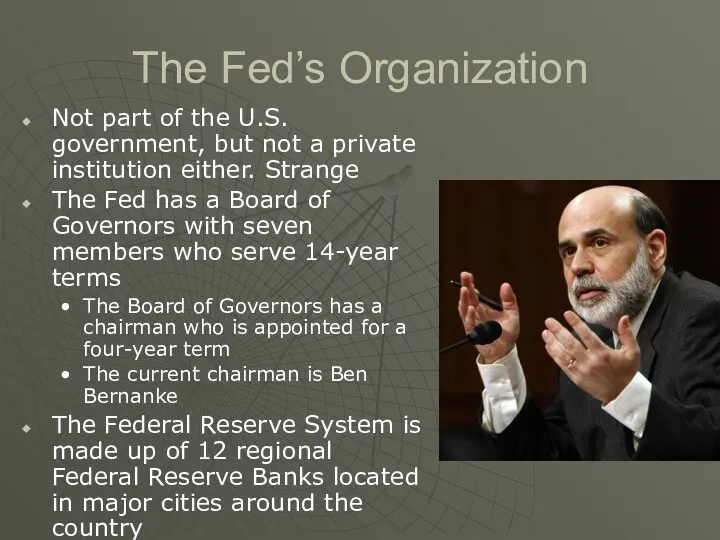
- 64. The Fed’s Organization Not part of the U.S. government, but not a private institution either. Strange
- 65. The Federal Reserve System
- 66. The Federal Open Market Committee The Federal Open Market Committee (FOMC) consists of the 7 members
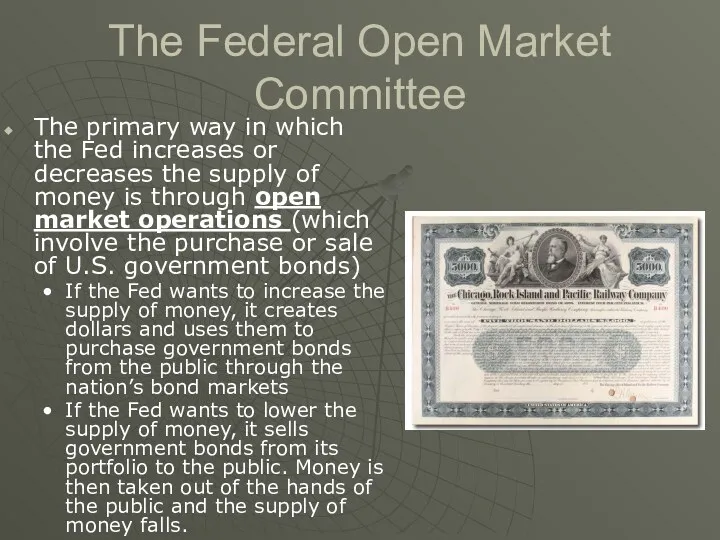
- 67. The Federal Open Market Committee The primary way in which the Fed increases or decreases the
- 68. Open-Market Operations
- 69. Glass-Steagall Act of 1933 Glass-Steagall Act of 1933 – separated banks into two catergories commercial banks
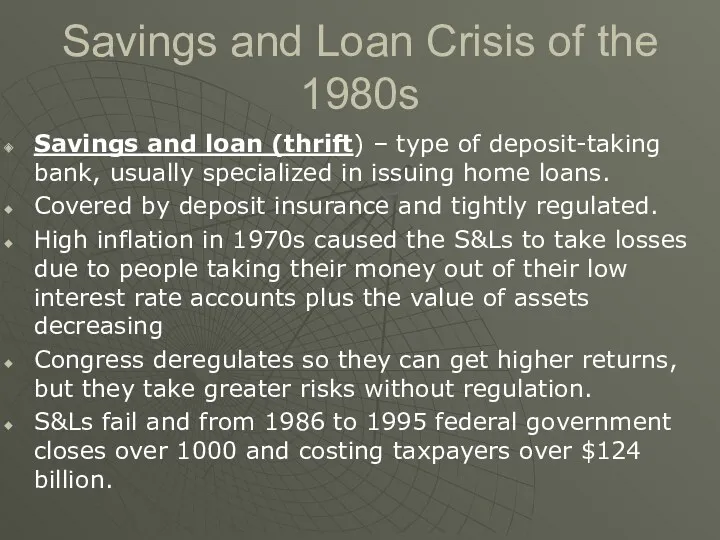
- 70. Savings and Loan Crisis of the 1980s Savings and loan (thrift) – type of deposit-taking bank,
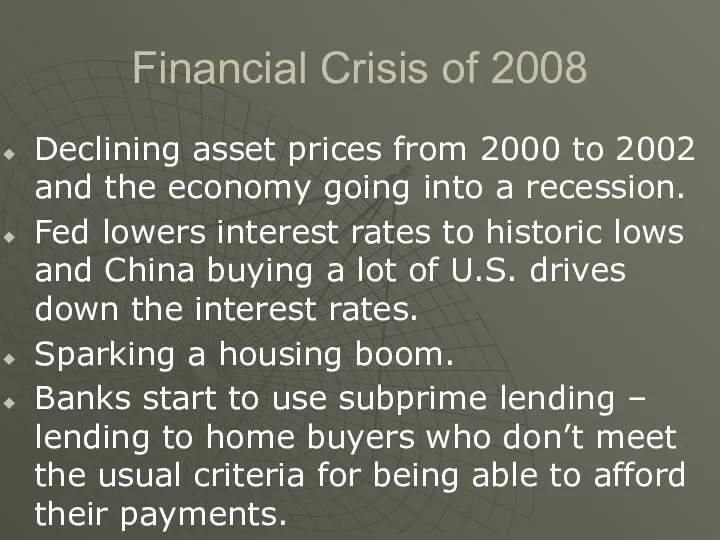
- 71. Financial Crisis of 2008 Declining asset prices from 2000 to 2002 and the economy going into
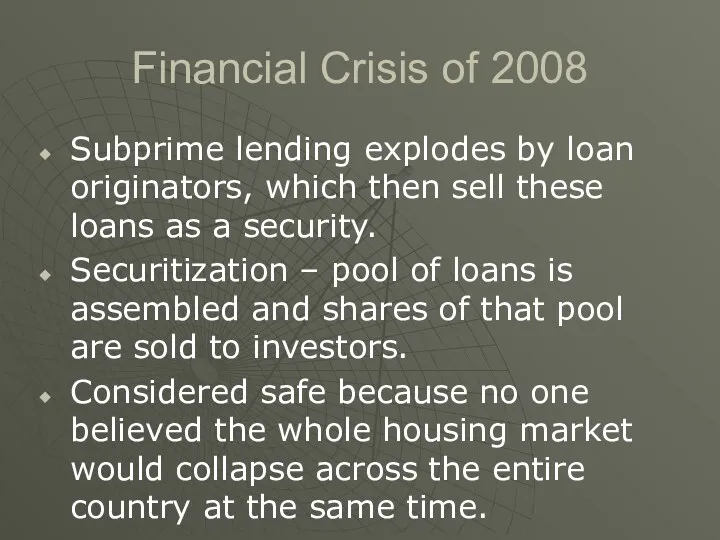
- 72. Financial Crisis of 2008 Subprime lending explodes by loan originators, which then sell these loans as
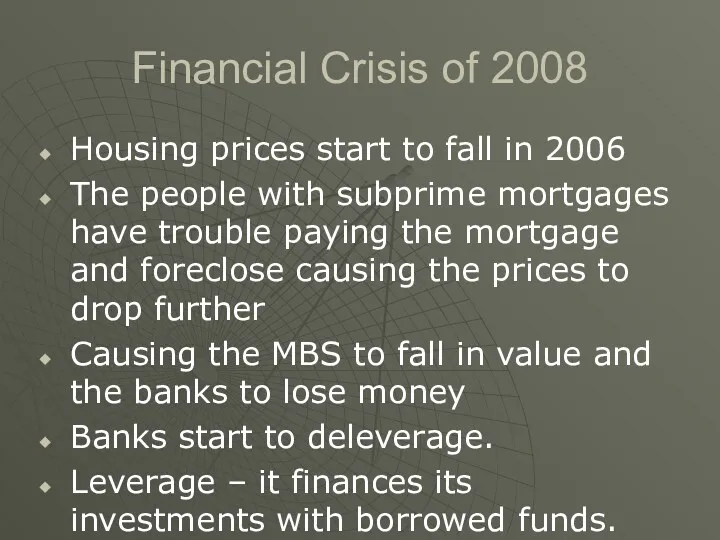
- 73. Financial Crisis of 2008 Housing prices start to fall in 2006 The people with subprime mortgages
- 74. Financial Crisis of 2008 Vicious cycle of deleveraging – takes place when asset sales to cover
- 75. Functions of the Fed One function performed by the Fed is the regulation of banks to
- 76. Functions of the Fed The second function of the Fed is to control the quantity of
- 77. The Federal Reserve System: The U.S. Central Bank (cont’d) Functions of the Fed Supplies the economy
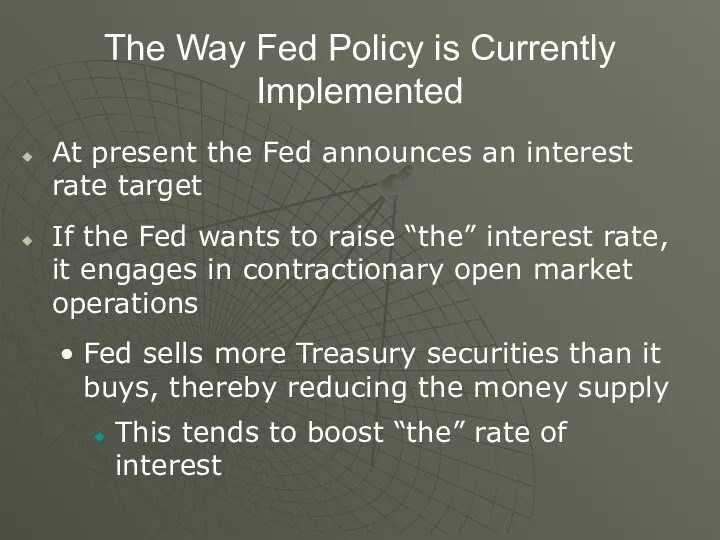
- 78. The Way Fed Policy is Currently Implemented At present the Fed announces an interest rate target
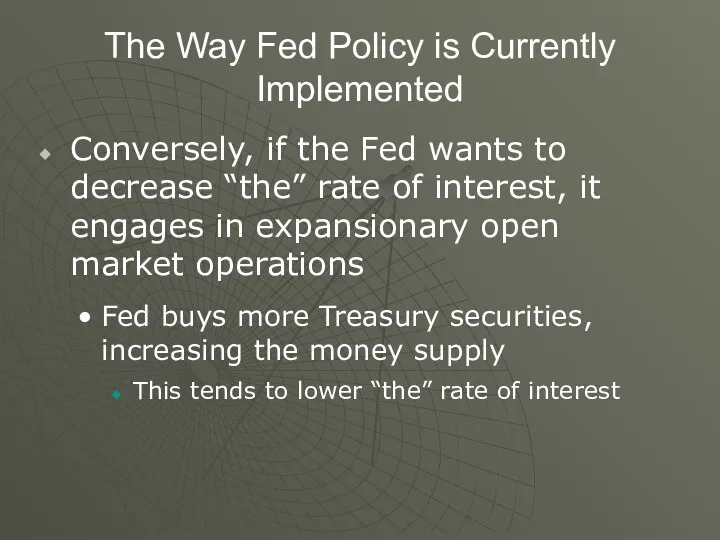
- 79. The Way Fed Policy is Currently Implemented Conversely, if the Fed wants to decrease “the” rate
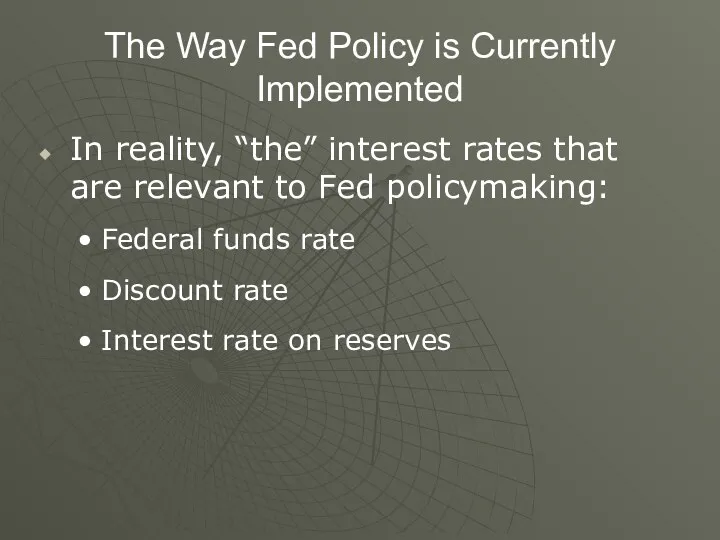
- 80. The Way Fed Policy is Currently Implemented In reality, “the” interest rates that are relevant to
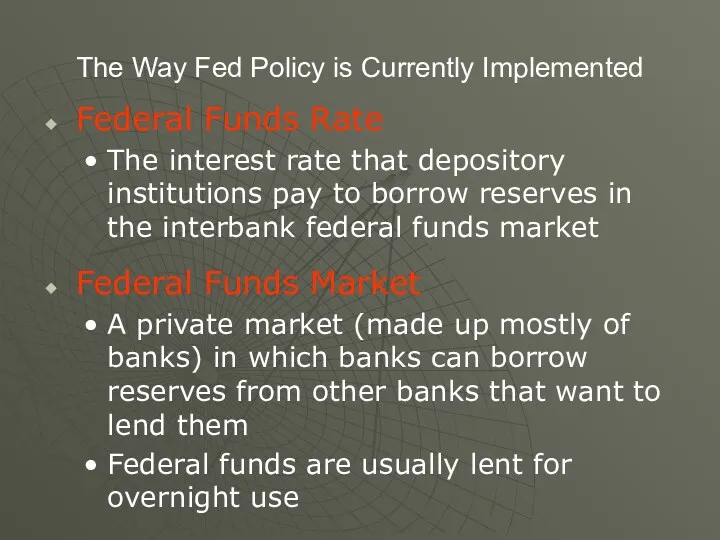
- 81. The Way Fed Policy is Currently Implemented Federal Funds Rate The interest rate that depository institutions
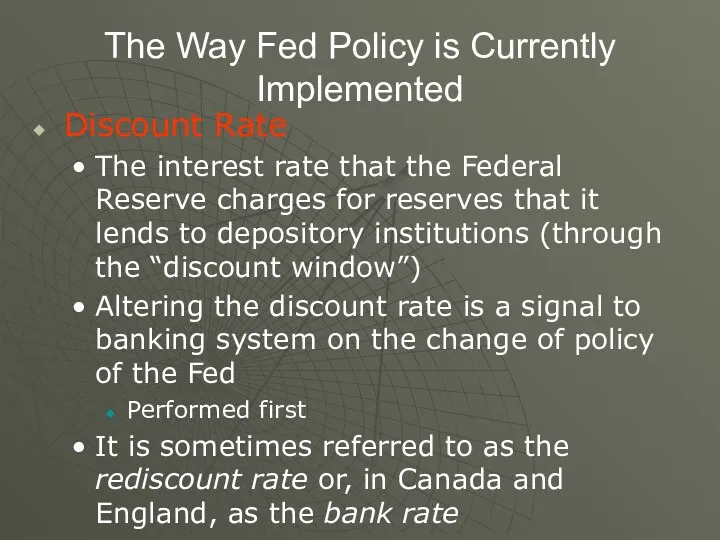
- 82. The Way Fed Policy is Currently Implemented Discount Rate The interest rate that the Federal Reserve
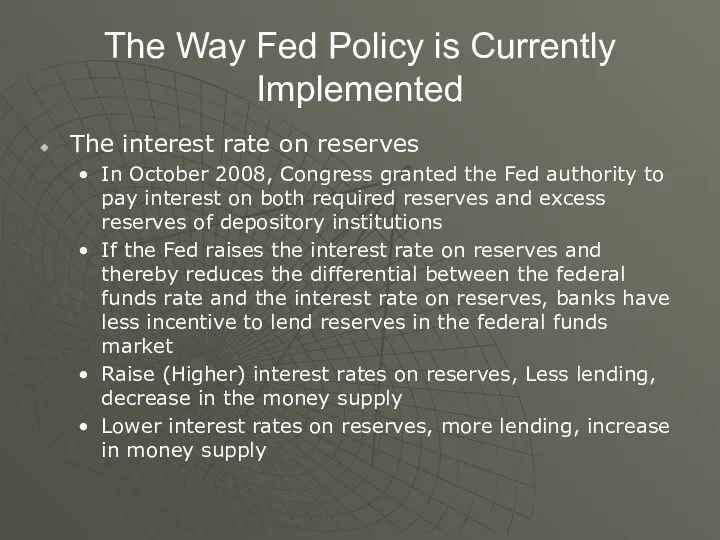
- 83. The Way Fed Policy is Currently Implemented The interest rate on reserves In October 2008, Congress
- 84. The Market for Bank Reserves and the Federal Funds Rate, Panel (a)
- 85. The Market for Bank Reserves and the Federal Funds Rate, Panel (b) An open market purchase
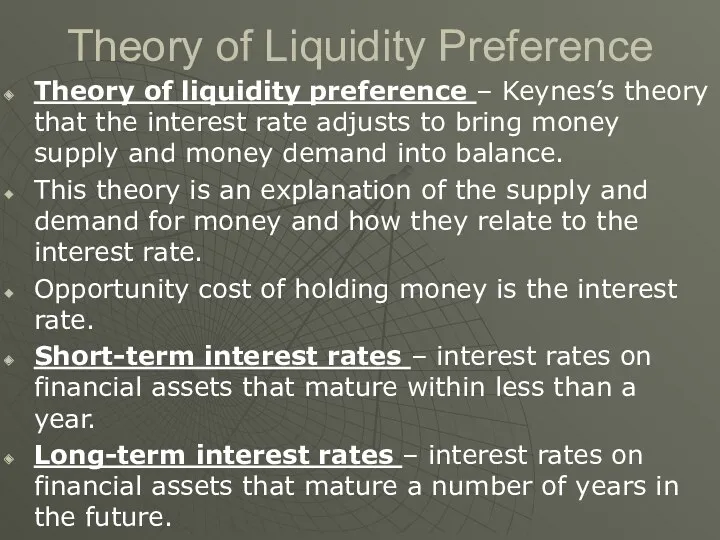
- 86. Theory of Liquidity Preference Theory of liquidity preference – Keynes’s theory that the interest rate adjusts
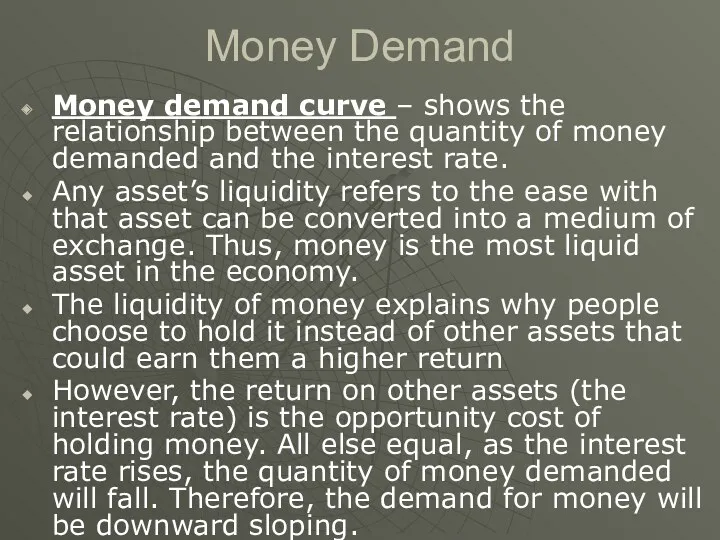
- 87. Money Demand Money demand curve – shows the relationship between the quantity of money demanded and
- 88. Three Main Motives behind the Demand for Money Transactions Motive Speculative Motive Precautionary Motive
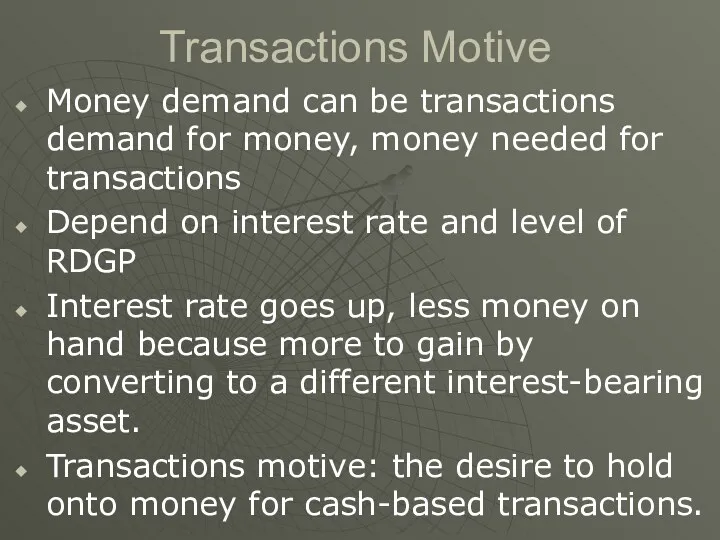
- 89. Transactions Motive Money demand can be transactions demand for money, money needed for transactions Depend on
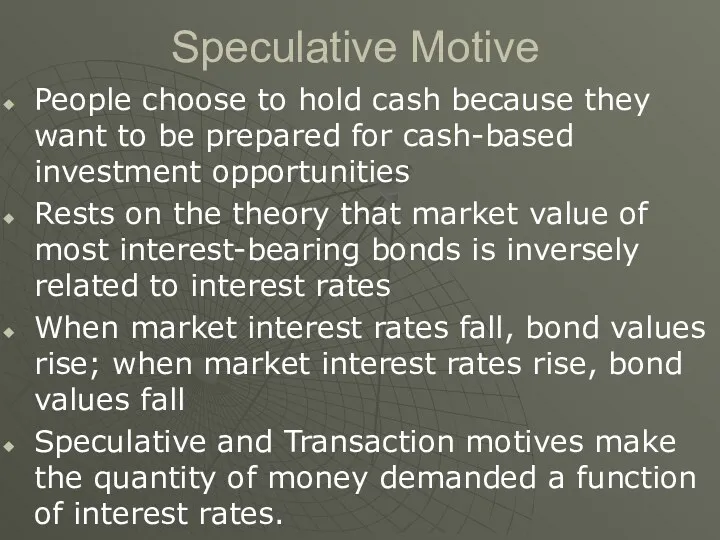
- 90. Speculative Motive People choose to hold cash because they want to be prepared for cash-based investment
- 91. Precautionary Motive Describes people’s inclination to hold onto money for unexpected cash expenses, such as medical
- 92. Money Demand Suppose real income (Y) rises. Other things equal, what happens to money demand? If
- 93. The Downward Slope of the Aggregate-Demand Curve When the price level increases, the quantity of money
- 94. Shifts of the Money Demand Curve Changes in the Aggregate Price Level Price level rises, MD
- 95. A C T I V E L E A R N I N G 1: The
- 96. A C T I V E L E A R N I N G 1: Answers
- 97. A C T I V E L E A R N I N G 1: Answers
- 98. Money Supply The money supply in the economy is controlled by the Federal Reserve. The Fed
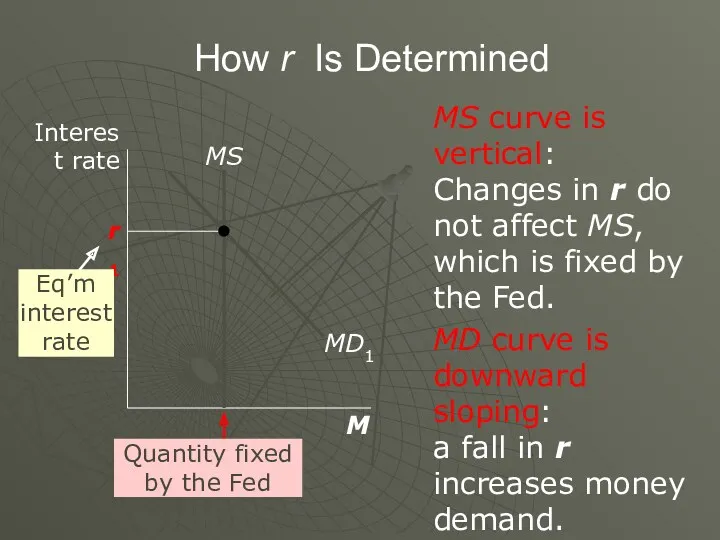
- 99. How r Is Determined MS curve is vertical: Changes in r do not affect MS, which
- 100. Equilibrium in the Money Market The interest rate adjusts to bring money demand and money supply
- 101. How the Interest-Rate Effect Works P2 A fall in P reduces money demand, which lowers r.
- 102. Monetary Policy and Aggregate Demand To achieve macroeconomic goals, the Fed can use monetary policy to
- 103. Changes in the Money Supply Example: The Fed buys government bonds in open-market operations. This will
- 104. The Role of Interest-Rate Targets in Fed Policy In recent years, the Fed has conducted policy
- 105. The Effects of Reducing the Money Supply The Fed can raise r by reducing the money
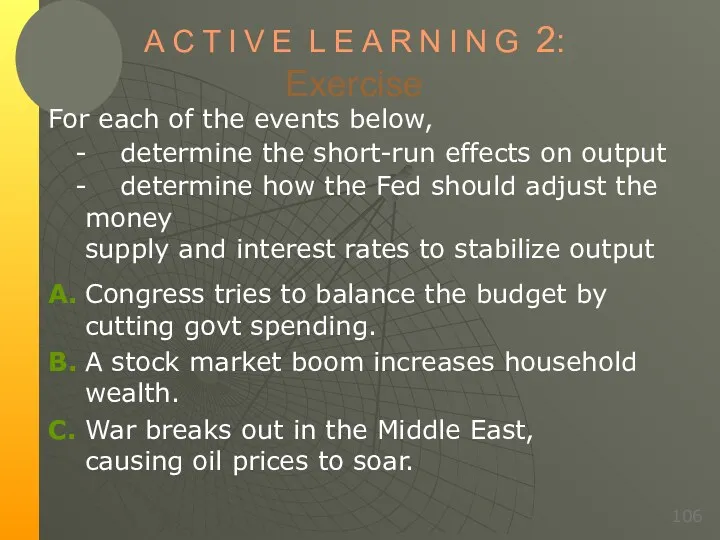
- 106. A C T I V E L E A R N I N G 2: Exercise
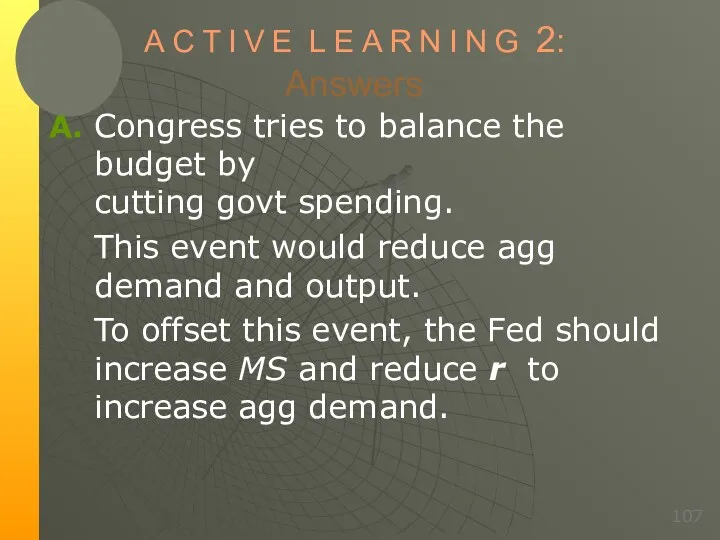
- 107. A C T I V E L E A R N I N G 2: Answers
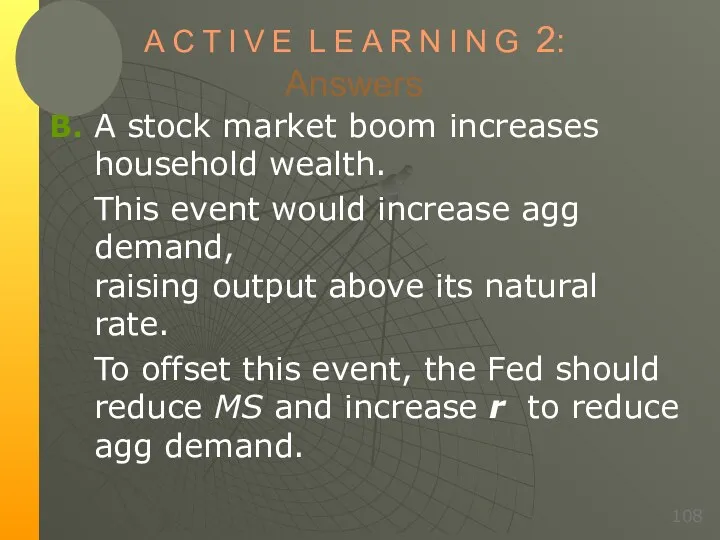
- 108. A C T I V E L E A R N I N G 2: Answers
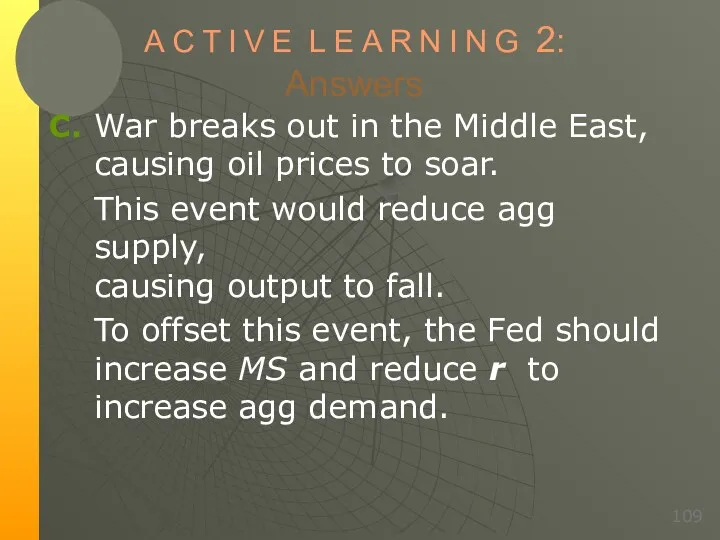
- 109. A C T I V E L E A R N I N G 2: Answers
- 110. Interest Rates and Bond Prices Inverse Relationship Bond prices increase the interest rate decreases If the
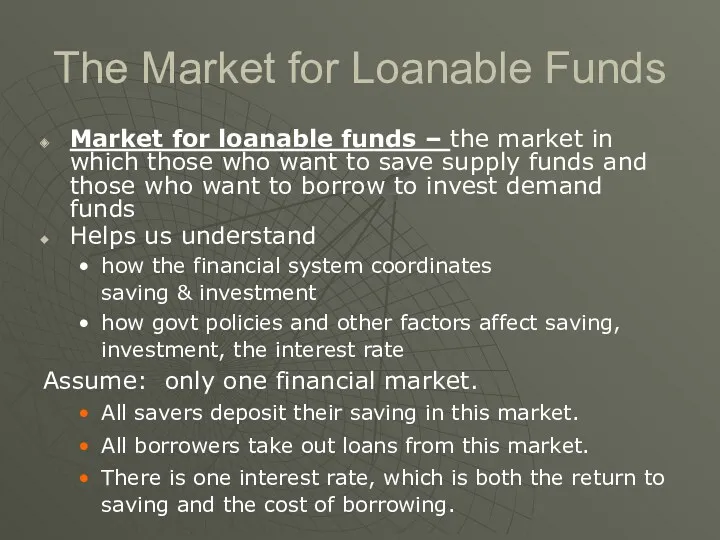
- 111. The Market for Loanable Funds Market for loanable funds – the market in which those who
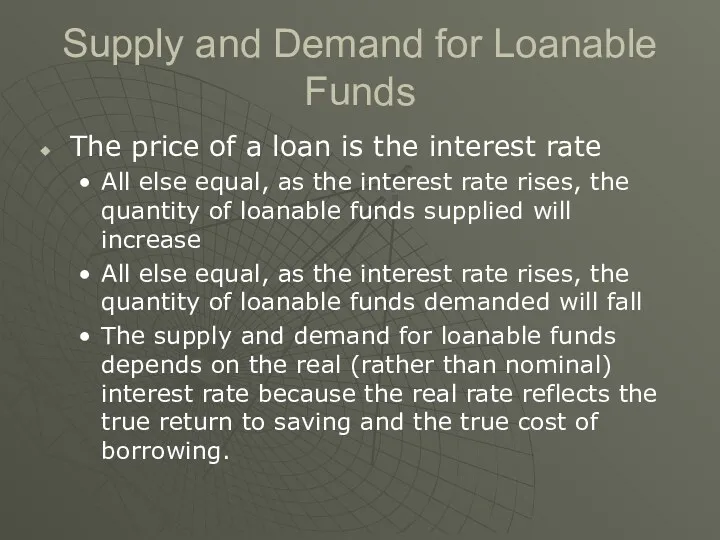
- 112. Supply and Demand for Loanable Funds The supply of loanable funds comes from those who spend
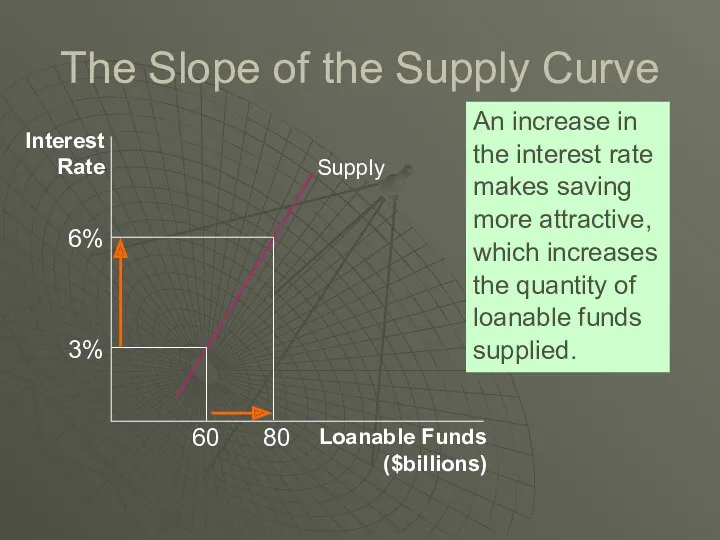
- 113. The Slope of the Supply Curve An increase in the interest rate makes saving more attractive,
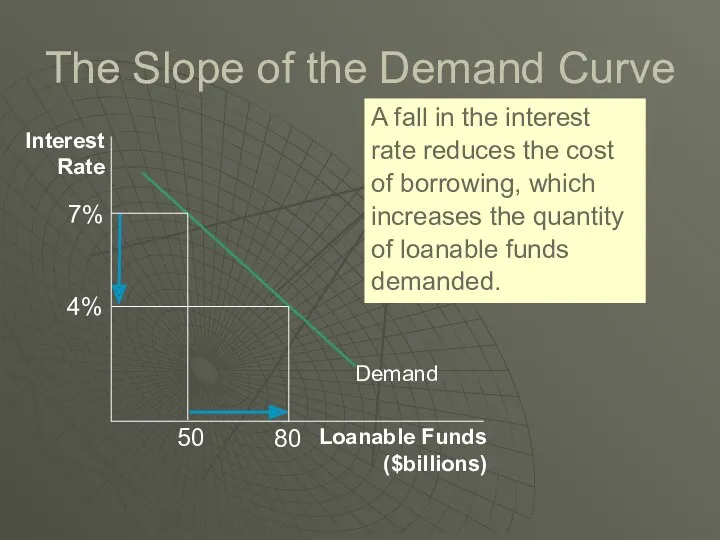
- 114. The Slope of the Demand Curve A fall in the interest rate reduces the cost of
- 115. Supply and Demand for Loanable Funds The price of a loan is the interest rate All
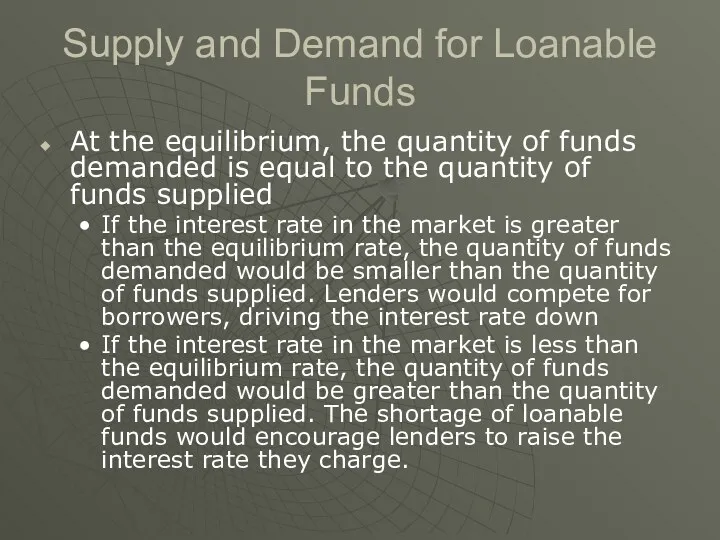
- 116. Supply and Demand for Loanable Funds At the equilibrium, the quantity of funds demanded is equal
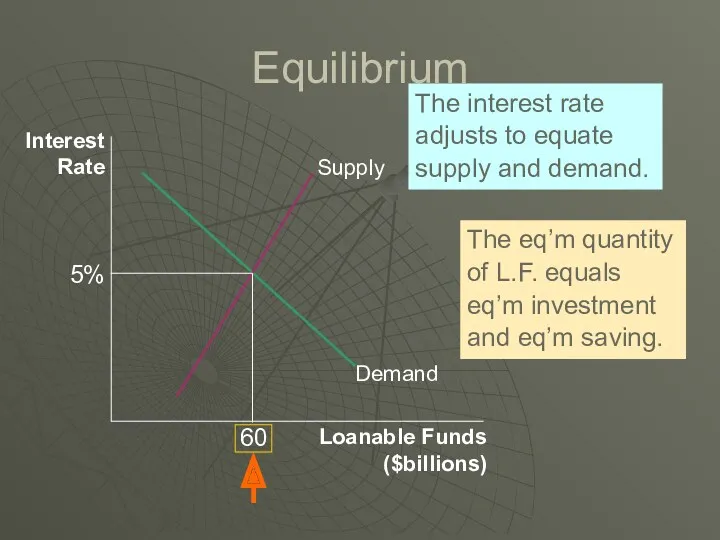
- 117. Equilibrium The interest rate adjusts to equate supply and demand. The eq’m quantity of L.F. equals
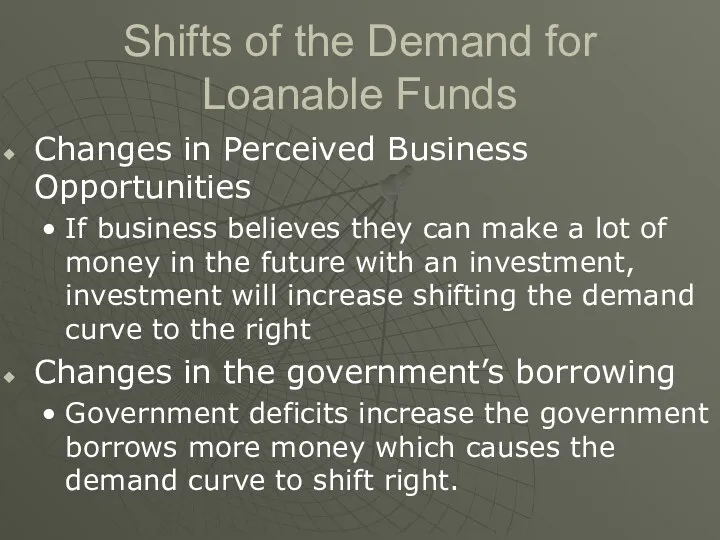
- 118. Shifts of the Demand for Loanable Funds Changes in Perceived Business Opportunities If business believes they
- 119. The Crowding-Out Effect The crowding out effect works in the opposite direction. Crowding out effect –
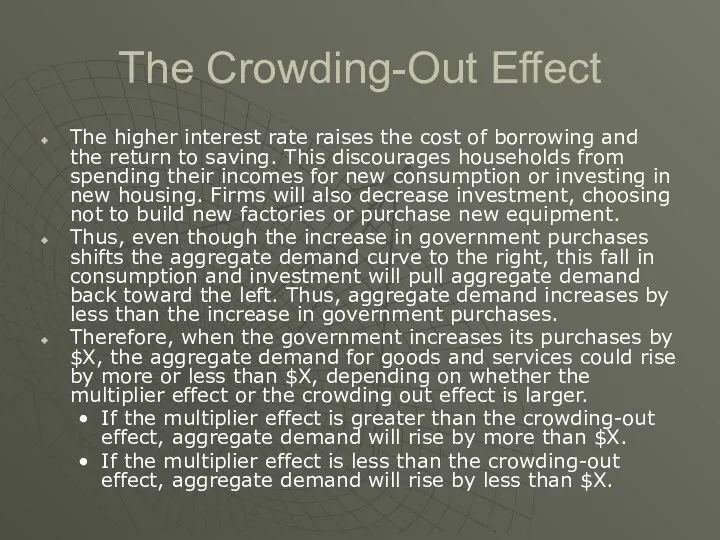
- 120. The Crowding-Out Effect The higher interest rate raises the cost of borrowing and the return to
- 121. Shifts of the Supply of Loanable Funds Changes in private savings behavior Save less supply shifts
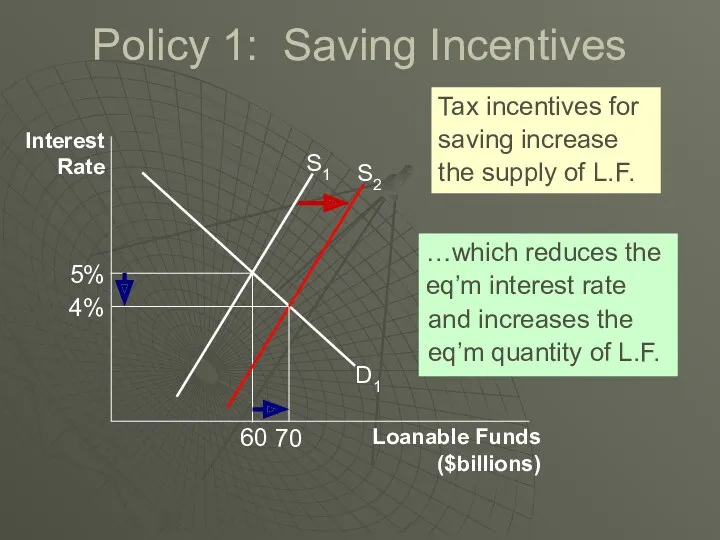
- 122. Policy 1: Saving Incentives Savings rates in the United States are relatively low when compared with
- 123. Policy 1: Saving Incentives Interest Rate Loanable Funds ($billions) D1 Tax incentives for saving increase the
- 124. Policy 2: Investment Incentive Suppose instead that the government passed a new law lowering taxes for
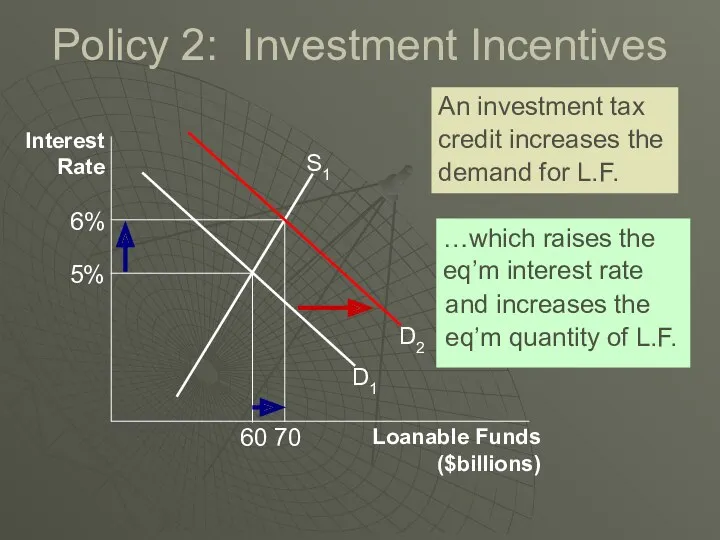
- 125. Policy 2: Investment Incentives Interest Rate Loanable Funds ($billions) D1 An investment tax credit increases the
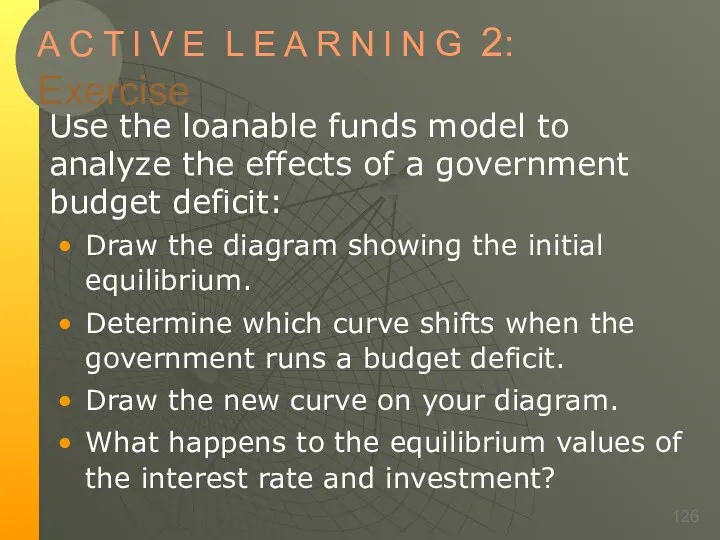
- 126. A C T I V E L E A R N I N G 2: Exercise
- 127. A C T I V E L E A R N I N G 2: Answers
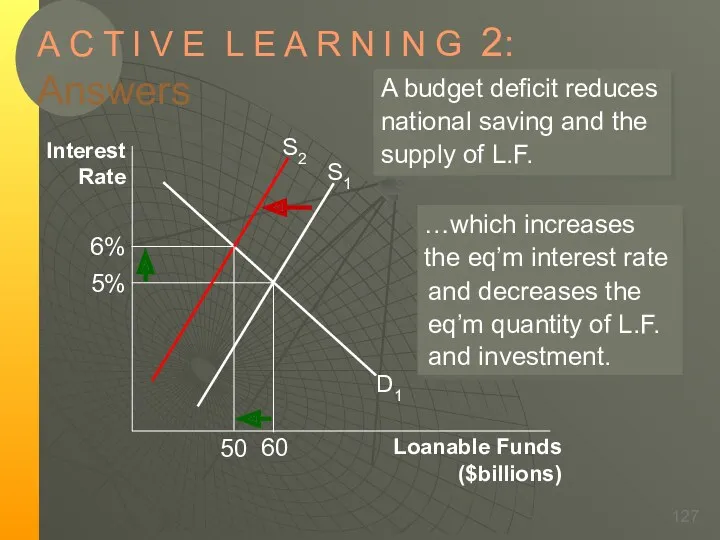
- 128. Policy 3: Government Budget Deficits and Surpluses A budget deficit occurs if the government spends more
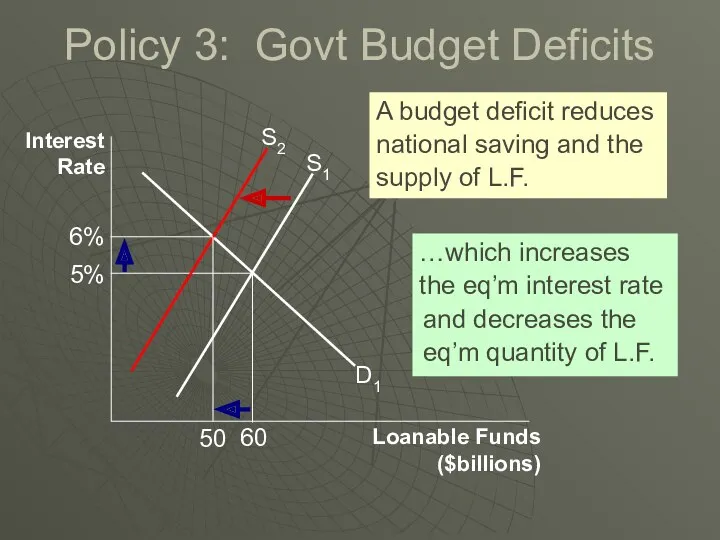
- 129. Policy 3: Govt Budget Deficits Interest Rate Loanable Funds ($billions) D1 A budget deficit reduces national
- 130. Policy 3: Government Budget Deficits and Surpluses When the interest rate rises, the quantity of funds
- 131. The U.S. Government Debt The government finances deficits by borrowing (selling government bonds). Persistent deficits lead
- 132. The Fisher Effect Real interest rate is equal to the nominal interest rate minus inflation rate.
- 133. The Fisher Effect Fisher Effect – the one-for-one adjustment of the nominal interest rate to the
- 134. Interest Rates in the Long Run and the Short Run It may appear we have two
- 135. Interest Rates in the Long Run and the Short Run In the long run, the economy’s
- 136. Reconciling the Two Interest Rate Models: The Interest Rate in the Short Run
- 138. Скачать презентацию
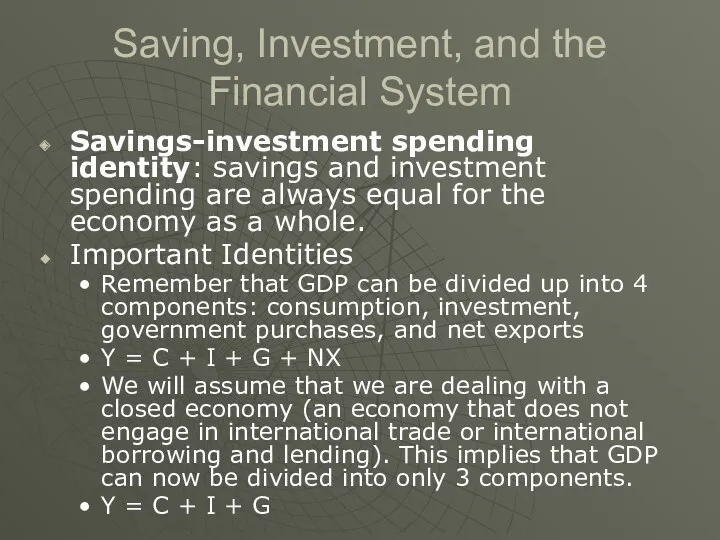
Saving, Investment, and the Financial System
Savings-investment spending identity: savings and investment
Saving, Investment, and the Financial System
Savings-investment spending identity: savings and investment
Important Identities (cont.)
To isolate investment, we can subtract C and G
Important Identities (cont.)
To isolate investment, we can subtract C and G
Important Identities (cont.)
Substitute saving (S) into our identity gives us: S=I
This
Important Identities (cont.)
Substitute saving (S) into our identity gives us: S=I
This
Important Identities (cont.)
We can add taxes (T) and subtract taxes (T)
S
Important Identities (cont.)
We can add taxes (T) and subtract taxes (T)
S
Important Identities (cont.)
The fact that S=I means that for the economy
Important Identities (cont.)
The fact that S=I means that for the economy
Open Economy: Savings and Investments
Savings of people in one country can
Open Economy: Savings and Investments
Savings of people in one country can
The Meaning of Saving and Investment
In macroeconomics, investment refers to the
The Meaning of Saving and Investment
In macroeconomics, investment refers to the
The Meaning of Saving and Investment
Private saving is the income remaining
The Meaning of Saving and Investment
Private saving is the income remaining
Saving and Investment
Investment is the purchase of new capital.
Examples of
Saving and Investment
Investment is the purchase of new capital.
Examples of
A C T I V E L E A R N
A C T I V E L E A R N
A C T I V E L E A R N
A C T I V E L E A R N
A C T I V E L E A R N
A C T I V E L E A R N
A C T I V E L E A R N
A C T I V E L E A R N
A C T I V E L E A R N
A C T I V E L E A R N
Financial System
Financial System – the group of institutions in the economy
Financial System
Financial System – the group of institutions in the economy
Three Tasks of a Financial System
3 Problems facing borrowers and lenders:
Three Tasks of a Financial System
3 Problems facing borrowers and lenders:
Three Tasks of a Financial System
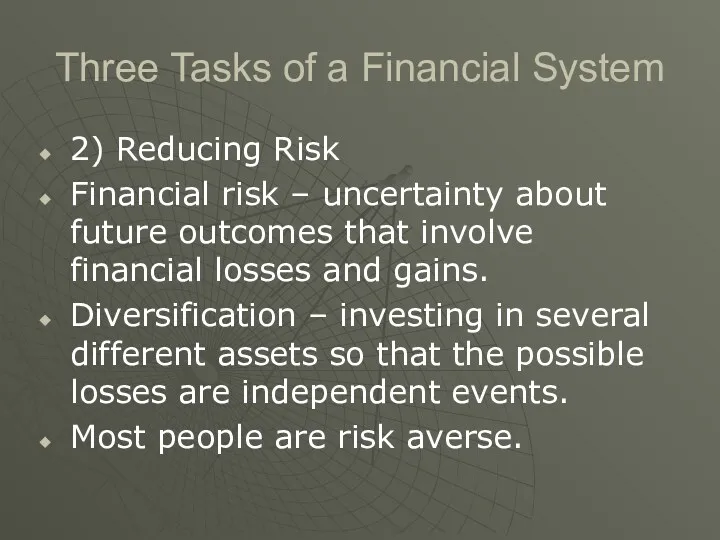
2) Reducing Risk
Financial risk – uncertainty
Three Tasks of a Financial System
2) Reducing Risk
Financial risk – uncertainty
Risk Aversion
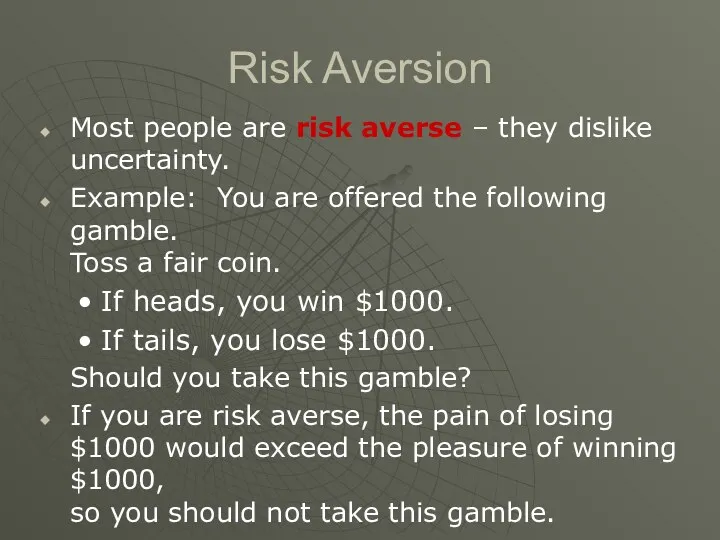
Most people are risk averse – they dislike uncertainty.
Example:
Risk Aversion
Most people are risk averse – they dislike uncertainty.
Example:
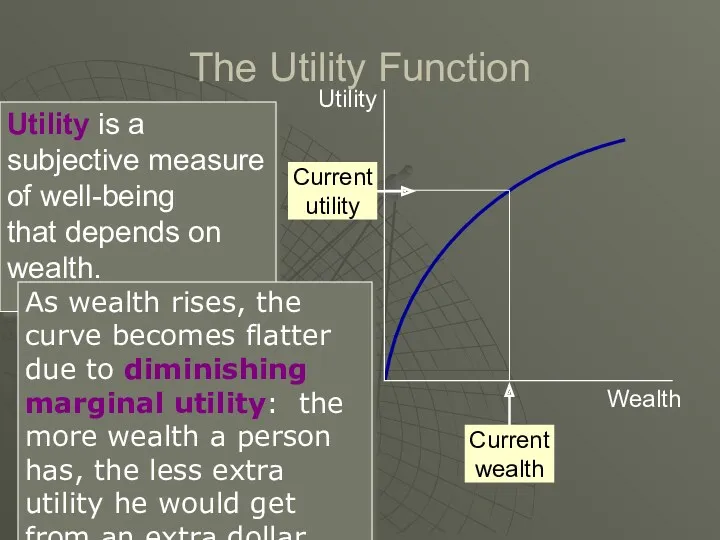
The Utility Function
Utility is a subjective measure of well-being
that depends
The Utility Function
Utility is a subjective measure of well-being that depends
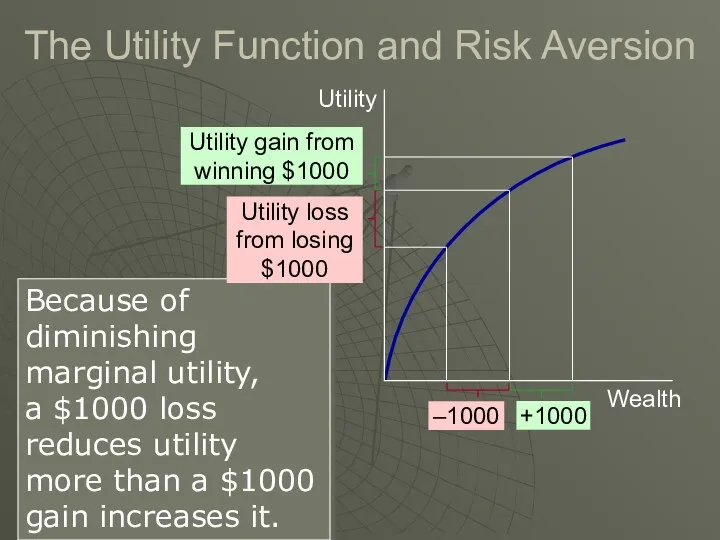
The Utility Function and Risk Aversion
Because of diminishing marginal utility,
a
The Utility Function and Risk Aversion
Because of diminishing marginal utility, a
Three Tasks of a Financial System
3) Providing Liquidity
Liquid asset is an
Three Tasks of a Financial System
3) Providing Liquidity
Liquid asset is an
Degrees of Liquidity
Degrees of Liquidity
Liquidity
Liquidity – the ease with which an asset can be converted
Liquidity
Liquidity – the ease with which an asset can be converted
Financial markets
The Bond Market
Bond – a certificate of indebtedness
A bond identifies
Financial markets
The Bond Market
Bond – a certificate of indebtedness
A bond identifies
Characteristics of a Bond
One characteristic that determines a bond’s value is
Characteristics of a Bond
One characteristic that determines a bond’s value is
Financial Markets
Stock Market
Stock – a claim to partial ownership in a
Financial Markets
Stock Market
Stock – a claim to partial ownership in a
Financial Assets
Stock
Bond
Loan – a lending agreement between an individual lender and
Financial Assets
Stock
Bond
Loan – a lending agreement between an individual lender and
Financial Intermediaries
Banks
The primary role of banks is to take in deposits
Financial Intermediaries
Banks
The primary role of banks is to take in deposits
Financial Intermediaries
Mutual funds – an institution that sells shares to the
Financial Intermediaries
Mutual funds – an institution that sells shares to the
Financial Intermediaries
Pension fund: a type of mutual fund that holds assets
Financial Intermediaries
Pension fund: a type of mutual fund that holds assets
Definition and Measurement of Money
Money: the set of assets in an
Definition and Measurement of Money
Money: the set of assets in an
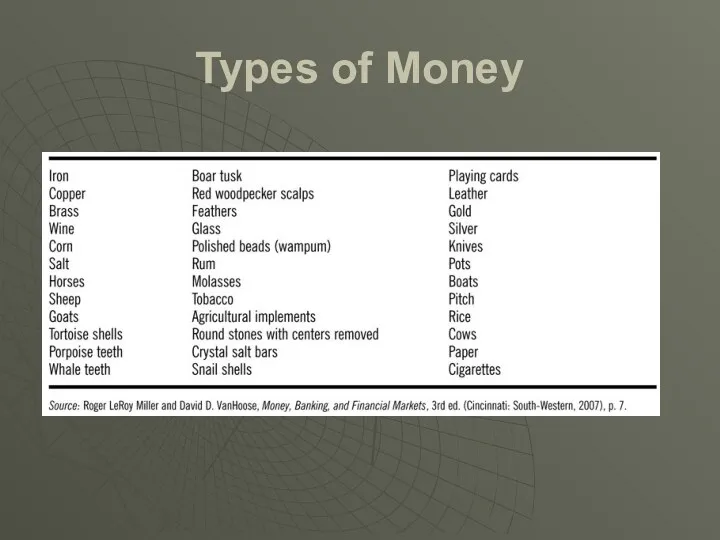
Types of Money
Types of Money
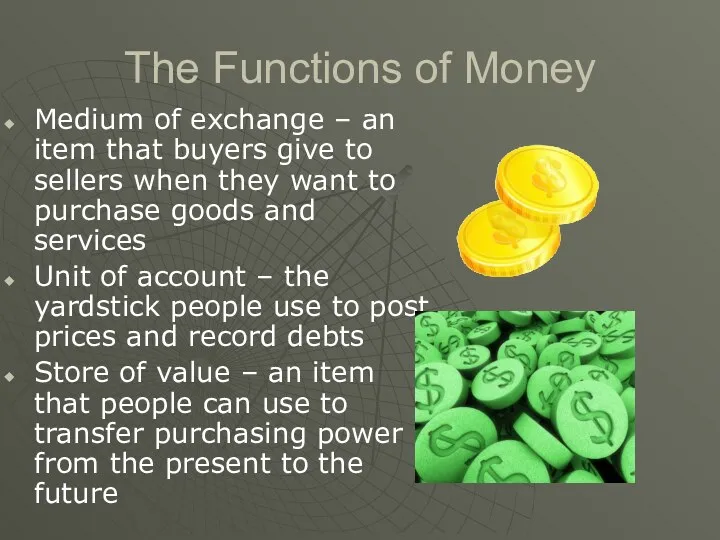
The Functions of Money
Medium of exchange – an item that buyers
The Functions of Money
Medium of exchange – an item that buyers
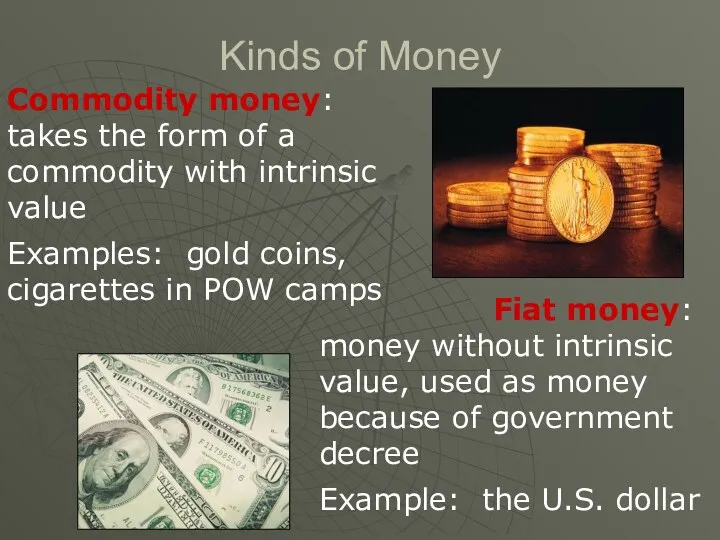
Kinds of Money
Commodity money:
takes the form of a commodity with
Kinds of Money
Commodity money: takes the form of a commodity with
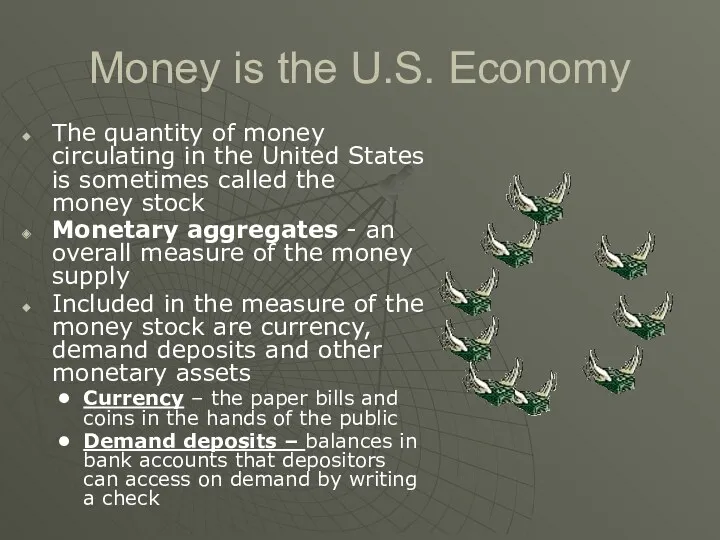
Money is the U.S. Economy
The quantity of money circulating in the
Money is the U.S. Economy
The quantity of money circulating in the
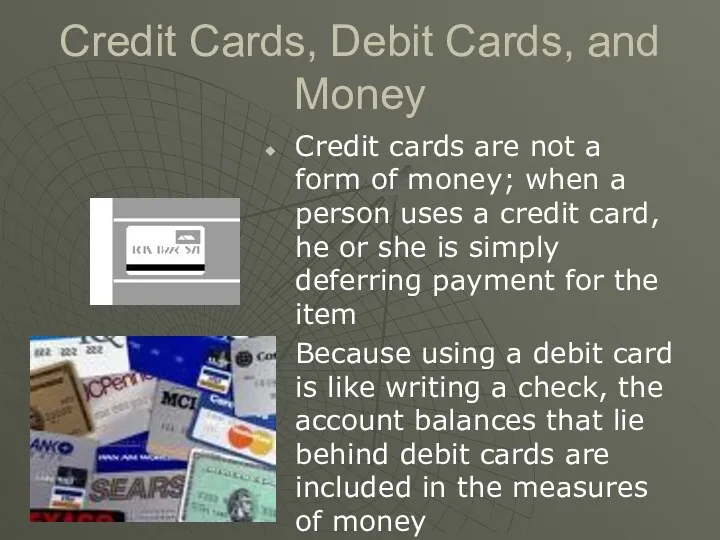
Credit Cards, Debit Cards, and Money
Credit cards are not a form
Credit Cards, Debit Cards, and Money
Credit cards are not a form
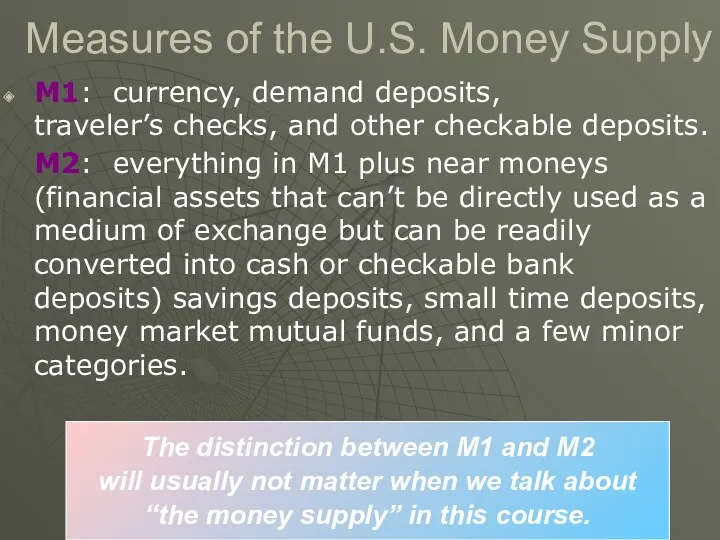
Measures of the U.S. Money Supply
M1: currency, demand deposits,
traveler’s checks,
Measures of the U.S. Money Supply
M1: currency, demand deposits, traveler’s checks,
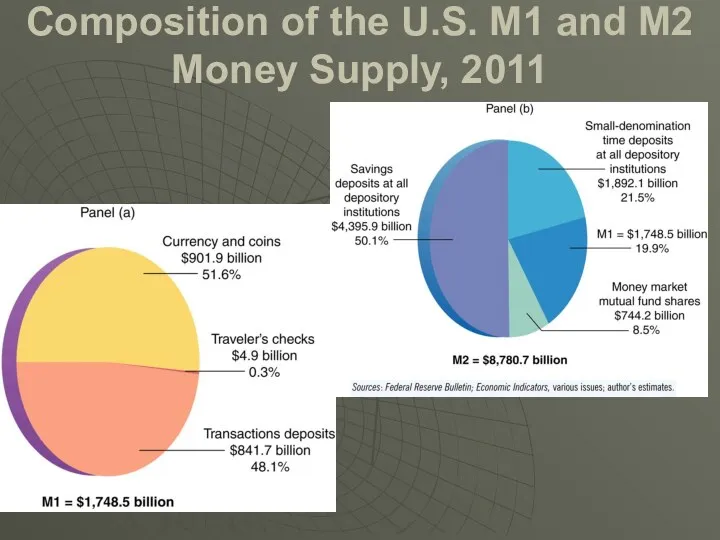
Composition of the U.S. M1 and M2 Money Supply, 2011
Composition of the U.S. M1 and M2 Money Supply, 2011
Financial markets coordinate saving and investment
Financial decisions involve two elements –
Financial markets coordinate saving and investment
Financial decisions involve two elements –
Present Value: Measuring the Time Value of Money
The present value of
Present Value: Measuring the Time Value of Money
The present value of
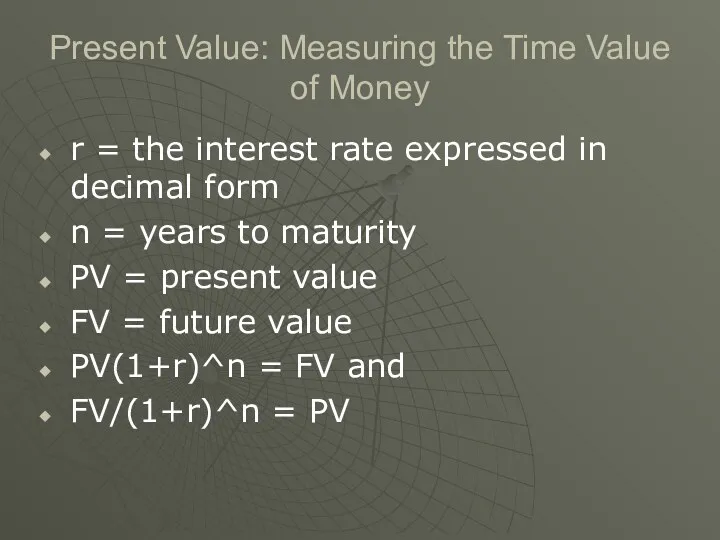
Present Value: Measuring the Time Value of Money
r = the interest
Present Value: Measuring the Time Value of Money
r = the interest
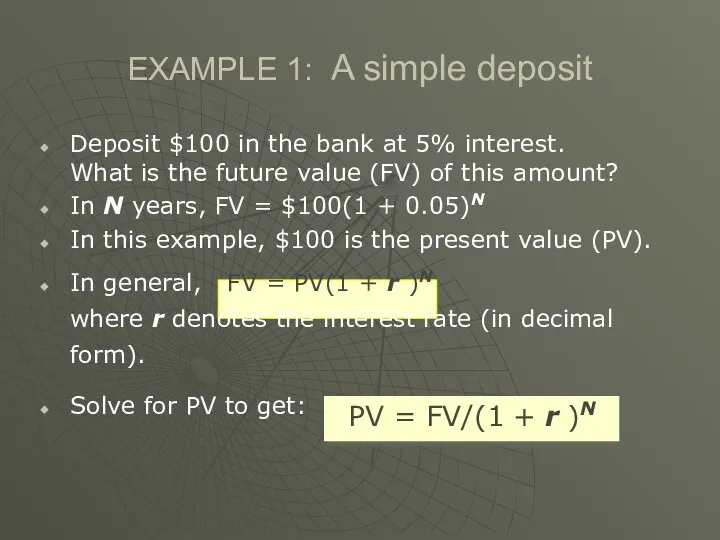
EXAMPLE 1: A simple deposit
Deposit $100 in the bank at 5%
EXAMPLE 1: A simple deposit
Deposit $100 in the bank at 5%
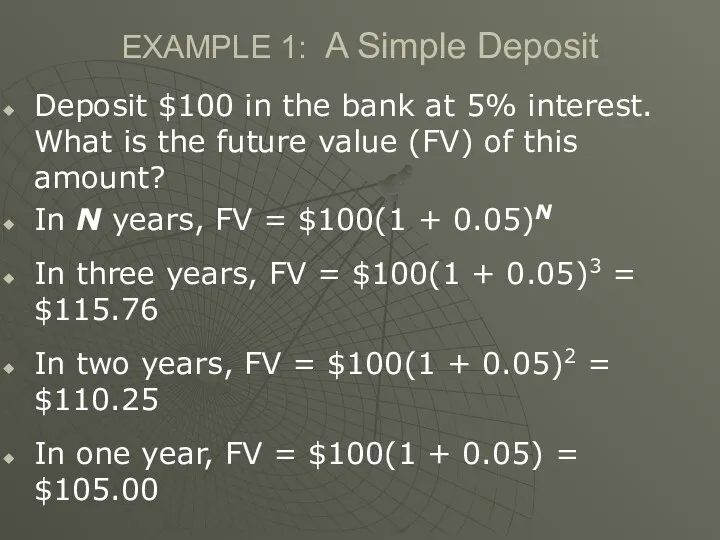
EXAMPLE 1: A Simple Deposit
Deposit $100 in the bank at 5%
EXAMPLE 1: A Simple Deposit
Deposit $100 in the bank at 5%
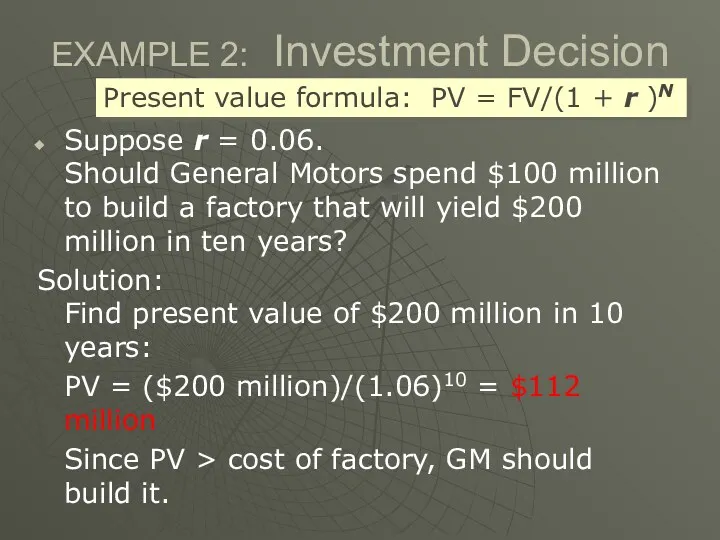
EXAMPLE 2: Investment Decision
Suppose r = 0.06.
Should General Motors spend
EXAMPLE 2: Investment Decision
Suppose r = 0.06. Should General Motors spend
EXAMPLE 2: Investment Decision
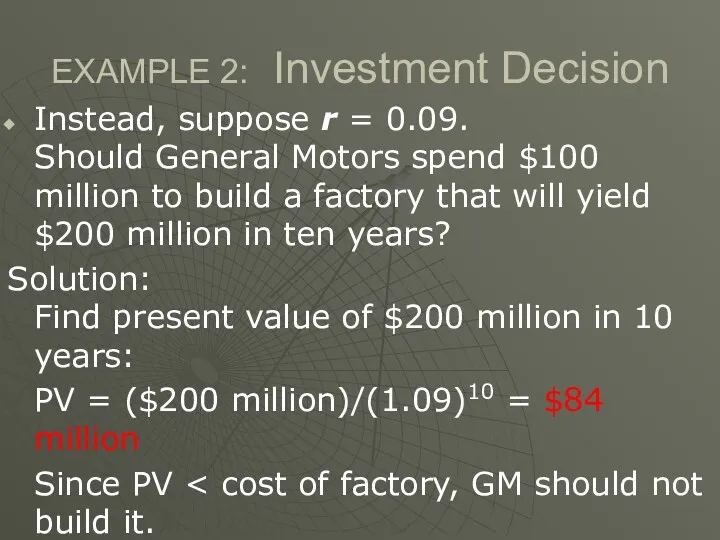
Instead, suppose r = 0.09.
Should General Motors
EXAMPLE 2: Investment Decision
Instead, suppose r = 0.09. Should General Motors
A C T I V E L E A R N
A C T I V E L E A R N
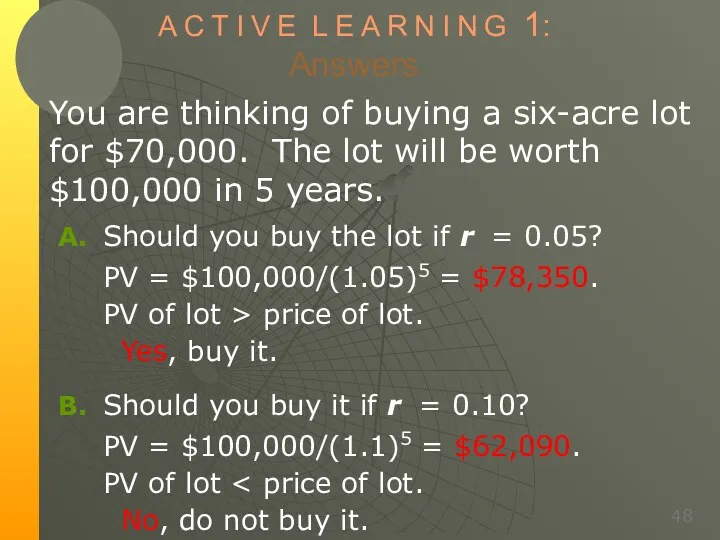
A C T I V E L E A R N
A C T I V E L E A R N
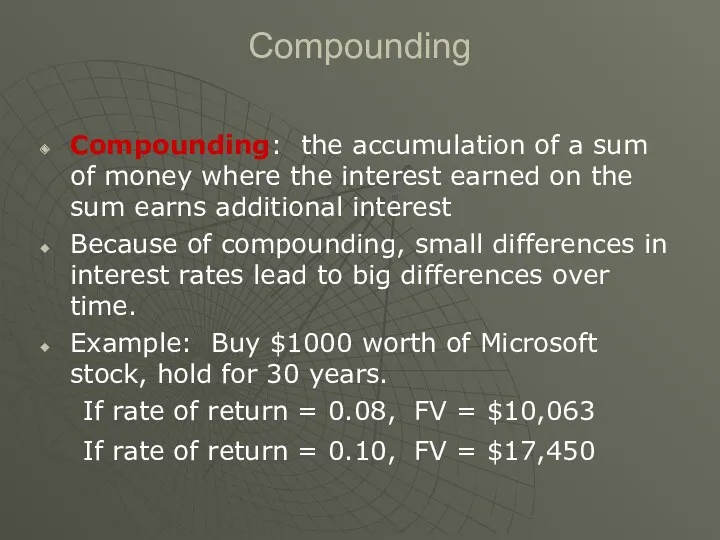
Compounding
Compounding: the accumulation of a sum of money where the interest
Compounding
Compounding: the accumulation of a sum of money where the interest
The Rule of 70
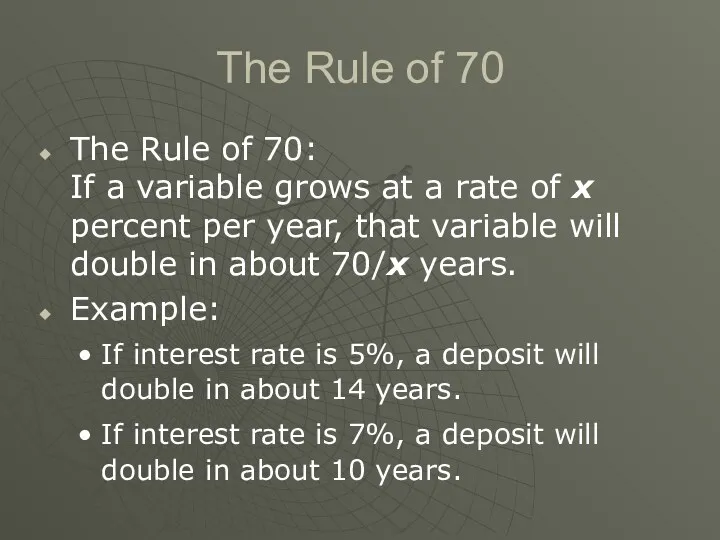
The Rule of 70:
If a variable grows
The Rule of 70
The Rule of 70: If a variable grows
Banks and the Money Supply
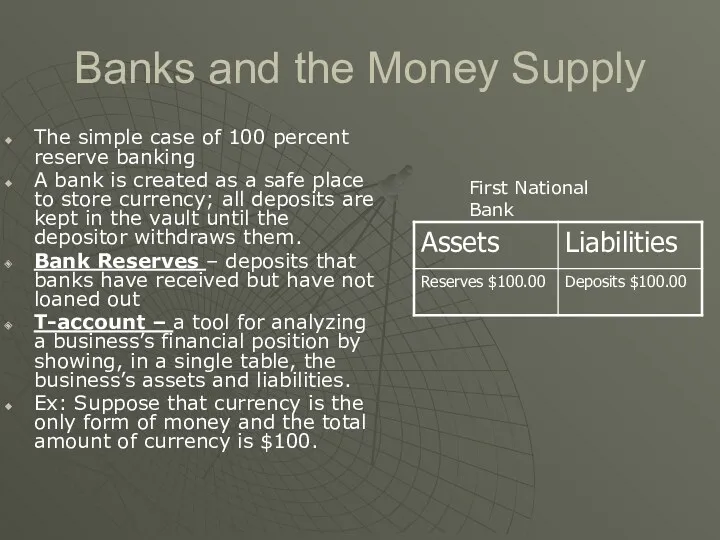
The simple case of 100 percent reserve
Banks and the Money Supply
The simple case of 100 percent reserve
Banks and the Money Supply
The money supply in this economy is
Banks and the Money Supply
The money supply in this economy is
Money Creation with Fractional-Reserve Banking
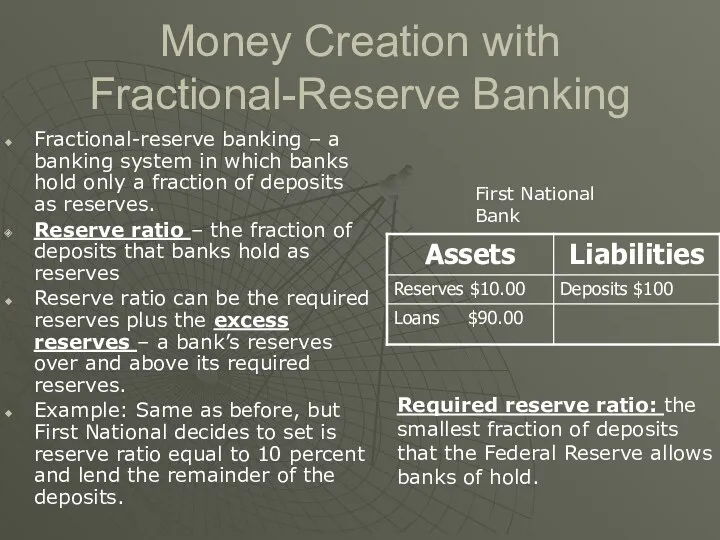
Fractional-reserve banking – a banking system in
Money Creation with Fractional-Reserve Banking
Fractional-reserve banking – a banking system in
Money Creation with Fractional-Reserve Banking
When the bank makes these loans, the
Money Creation with Fractional-Reserve Banking
When the bank makes these loans, the
The Money Multiplier
The creation of money does not stop at this
The Money Multiplier
The creation of money does not stop at this
The Money Multiplier
Each time the money is deposited and a bank
The Money Multiplier
Each time the money is deposited and a bank
A C T I V E L E A R N
A C T I V E L E A R N
A C T I V E L E A R N
A C T I V E L E A R N
A C T I V E L E A R N
A C T I V E L E A R N
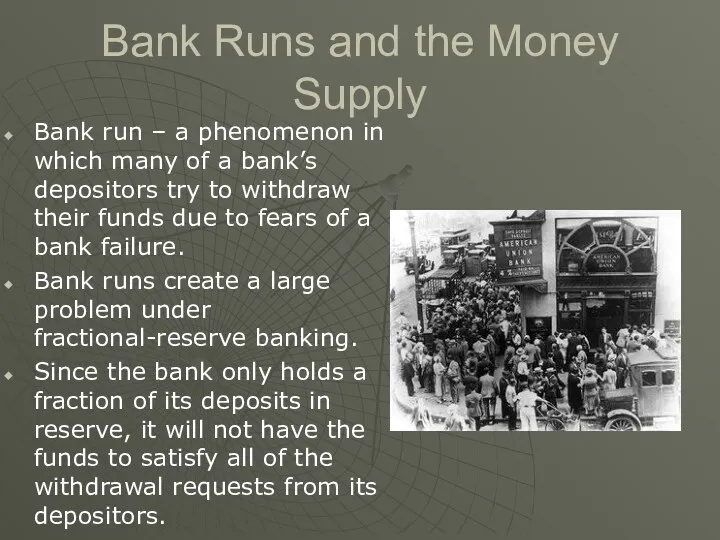
Bank Runs and the Money Supply
Bank run – a phenomenon in
Bank Runs and the Money Supply
Bank run – a phenomenon in
Bank Regulation
Today depositors are guaranteed through the Federal Depository Insurance Corporation
Bank Regulation
Today depositors are guaranteed through the Federal Depository Insurance Corporation
Bank Regulation
Capital Requirement: regulators require that the owners of banks hold
Bank Regulation
Capital Requirement: regulators require that the owners of banks hold
The Federal Reserve System
Federal Reserve (Fed) – the central bank of
The Federal Reserve System
Federal Reserve (Fed) – the central bank of
The Fed’s Organization
Not part of the U.S. government, but not a
The Fed’s Organization
Not part of the U.S. government, but not a
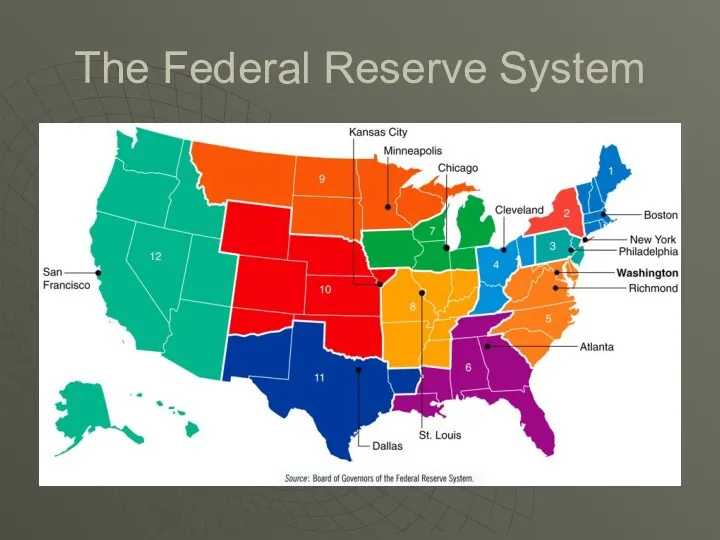
The Federal Reserve System
The Federal Reserve System
The Federal Open Market Committee
The Federal Open Market Committee (FOMC) consists
The Federal Open Market Committee
The Federal Open Market Committee (FOMC) consists
The Federal Open Market Committee
The primary way in which the Fed
The Federal Open Market Committee
The primary way in which the Fed
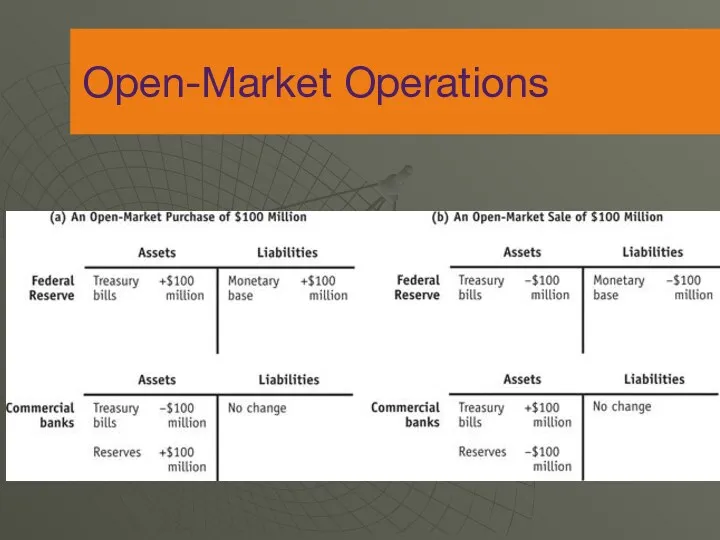
Open-Market Operations
Open-Market Operations
Glass-Steagall Act of 1933
Glass-Steagall Act of 1933 – separated banks into
Glass-Steagall Act of 1933
Glass-Steagall Act of 1933 – separated banks into
Savings and Loan Crisis of the 1980s
Savings and loan (thrift) –
Savings and Loan Crisis of the 1980s
Savings and loan (thrift) –
Financial Crisis of 2008
Declining asset prices from 2000 to 2002 and
Financial Crisis of 2008
Declining asset prices from 2000 to 2002 and
Financial Crisis of 2008
Subprime lending explodes by loan originators, which then
Financial Crisis of 2008
Subprime lending explodes by loan originators, which then
Financial Crisis of 2008
Housing prices start to fall in 2006
The people
Financial Crisis of 2008
Housing prices start to fall in 2006
The people
Financial Crisis of 2008
Vicious cycle of deleveraging – takes place when
Financial Crisis of 2008
Vicious cycle of deleveraging – takes place when
Functions of the Fed
One function performed by the Fed is the
Functions of the Fed
One function performed by the Fed is the
Functions of the Fed
The second function of the Fed is to
Functions of the Fed
The second function of the Fed is to
The Federal Reserve System: The U.S. Central Bank (cont’d)
Functions of the
The Federal Reserve System: The U.S. Central Bank (cont’d)
Functions of the
The Way Fed Policy is Currently Implemented
At present the Fed announces
The Way Fed Policy is Currently Implemented
At present the Fed announces
The Way Fed Policy is Currently Implemented
Conversely, if the Fed wants
The Way Fed Policy is Currently Implemented
Conversely, if the Fed wants
The Way Fed Policy is Currently Implemented
In reality, “the” interest rates
The Way Fed Policy is Currently Implemented
In reality, “the” interest rates
The Way Fed Policy is Currently Implemented
Federal Funds Rate
The interest
The Way Fed Policy is Currently Implemented
Federal Funds Rate
The interest
The Way Fed Policy is Currently Implemented
Discount Rate
The interest rate
The Way Fed Policy is Currently Implemented
Discount Rate
The interest rate
The Way Fed Policy is Currently Implemented
The interest rate on
The Way Fed Policy is Currently Implemented
The interest rate on
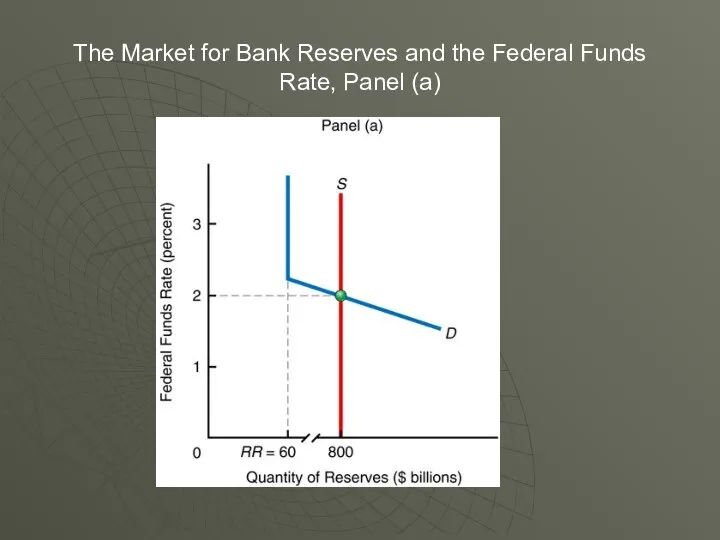
The Market for Bank Reserves and the Federal Funds Rate, Panel
The Market for Bank Reserves and the Federal Funds Rate, Panel
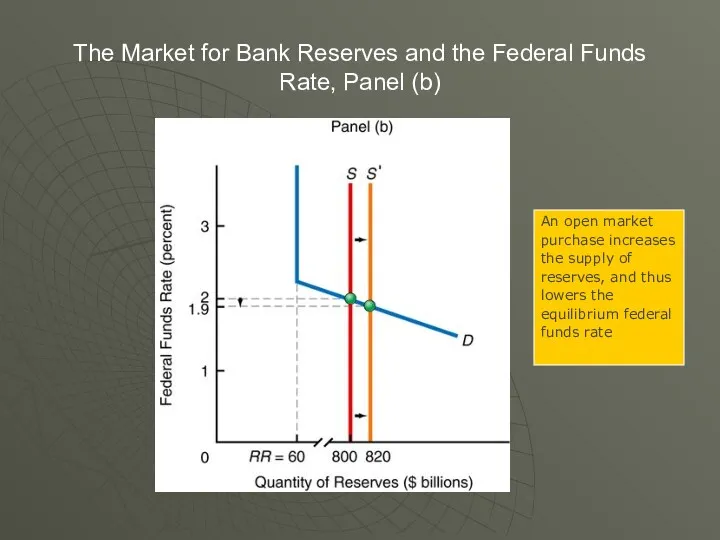
The Market for Bank Reserves and the Federal Funds Rate, Panel
The Market for Bank Reserves and the Federal Funds Rate, Panel
Theory of Liquidity Preference
Theory of liquidity preference – Keynes’s theory that
Theory of Liquidity Preference
Theory of liquidity preference – Keynes’s theory that
Money Demand
Money demand curve – shows the relationship between the quantity
Money Demand
Money demand curve – shows the relationship between the quantity

Three Main Motives behind the Demand for Money
Transactions Motive
Speculative Motive
Precautionary Motive
Three Main Motives behind the Demand for Money
Transactions Motive
Speculative Motive
Precautionary Motive
Transactions Motive
Money demand can be transactions demand for money, money needed
Transactions Motive
Money demand can be transactions demand for money, money needed
Speculative Motive
People choose to hold cash because they want to be
Speculative Motive
People choose to hold cash because they want to be
Precautionary Motive
Describes people’s inclination to hold onto money for unexpected cash
Precautionary Motive
Describes people’s inclination to hold onto money for unexpected cash
Money Demand
Suppose real income (Y) rises. Other things equal, what happens
Money Demand
Suppose real income (Y) rises. Other things equal, what happens
The Downward Slope of the Aggregate-Demand Curve
When the price level increases,
The Downward Slope of the Aggregate-Demand Curve
When the price level increases,
Shifts of the Money Demand Curve
Changes in the Aggregate Price Level
Price
Shifts of the Money Demand Curve
Changes in the Aggregate Price Level
Price
A C T I V E L E A R N
A C T I V E L E A R N
A C T I V E L E A R N
A C T I V E L E A R N
A C T I V E L E A R N
A C T I V E L E A R N
Money Supply
The money supply in the economy is controlled by the
Money Supply
The money supply in the economy is controlled by the
How r Is Determined
MS curve is vertical: Changes in r do
How r Is Determined
MS curve is vertical: Changes in r do
Equilibrium in the Money Market
The interest rate adjusts to bring money
Equilibrium in the Money Market
The interest rate adjusts to bring money
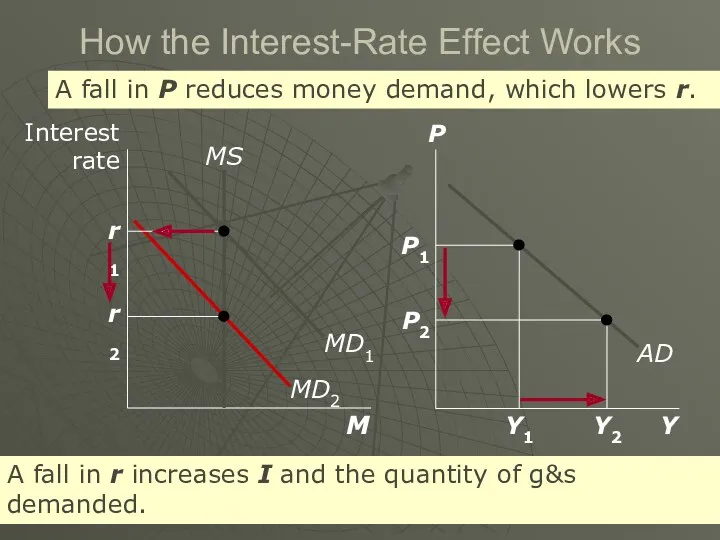
How the Interest-Rate Effect Works
P2
A fall in P reduces money demand,
How the Interest-Rate Effect Works
P2
A fall in P reduces money demand,
Monetary Policy and
Aggregate Demand
To achieve macroeconomic goals, the Fed can
Monetary Policy and
Aggregate Demand
To achieve macroeconomic goals, the Fed can
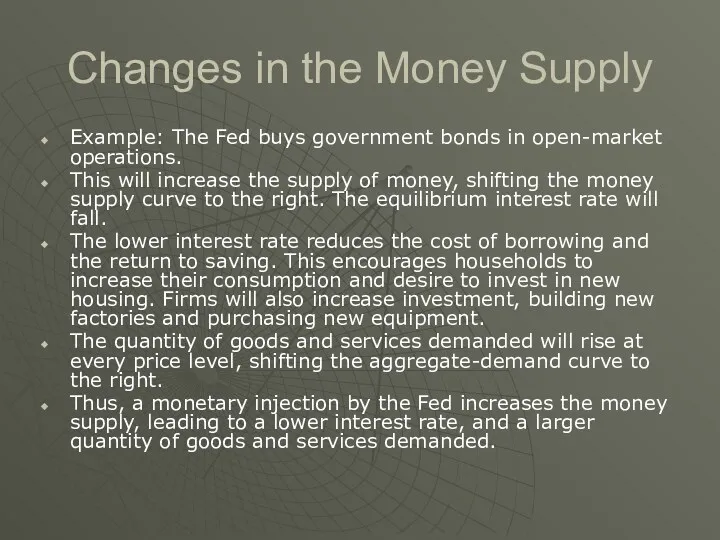
Changes in the Money Supply
Example: The Fed buys government bonds in
Changes in the Money Supply
Example: The Fed buys government bonds in
The Role of Interest-Rate Targets in Fed Policy
In recent years, the
The Role of Interest-Rate Targets in Fed Policy
In recent years, the
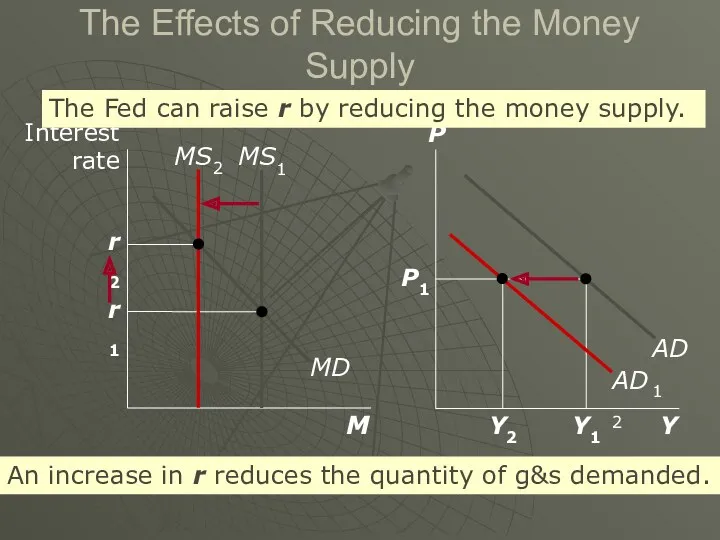
The Effects of Reducing the Money Supply
The Fed can raise r
The Effects of Reducing the Money Supply
The Fed can raise r
A C T I V E L E A R N
A C T I V E L E A R N
A C T I V E L E A R N
A C T I V E L E A R N
A C T I V E L E A R N
A C T I V E L E A R N
A C T I V E L E A R N
A C T I V E L E A R N
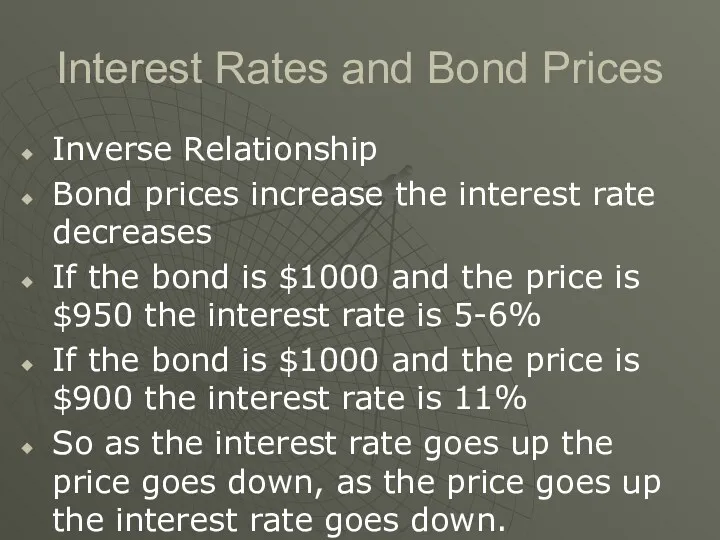
Interest Rates and Bond Prices
Inverse Relationship
Bond prices increase the interest rate
Interest Rates and Bond Prices
Inverse Relationship
Bond prices increase the interest rate
The Market for Loanable Funds
Market for loanable funds – the market
The Market for Loanable Funds
Market for loanable funds – the market
Supply and Demand for Loanable Funds
The supply of loanable funds comes
Supply and Demand for Loanable Funds
The supply of loanable funds comes
The Slope of the Supply Curve
An increase in the interest rate
The Slope of the Supply Curve
An increase in the interest rate
The Slope of the Demand Curve
A fall in the interest rate
The Slope of the Demand Curve
A fall in the interest rate
Supply and Demand for Loanable Funds
The price of a loan is
Supply and Demand for Loanable Funds
The price of a loan is
Supply and Demand for Loanable Funds
At the equilibrium, the quantity of
Supply and Demand for Loanable Funds
At the equilibrium, the quantity of
Equilibrium
The interest rate adjusts to equate supply and demand.
The eq’m
Equilibrium
The interest rate adjusts to equate supply and demand.
The eq’m
Shifts of the Demand for Loanable Funds
Changes in Perceived Business Opportunities
If
Shifts of the Demand for Loanable Funds
Changes in Perceived Business Opportunities
If
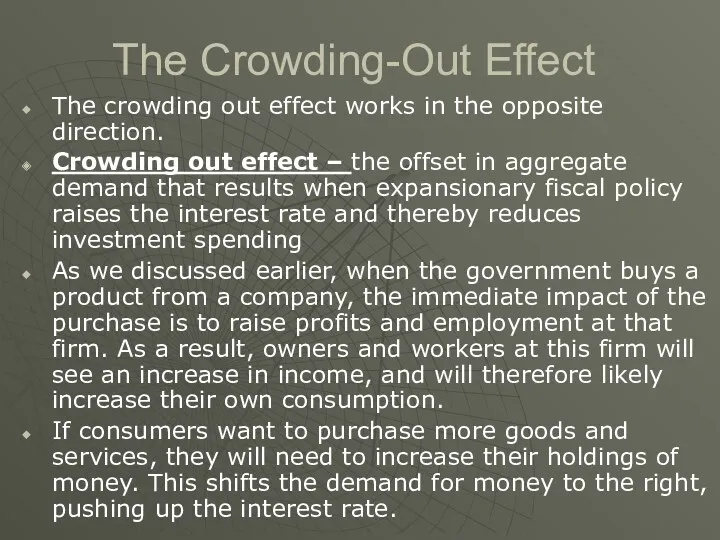
The Crowding-Out Effect
The crowding out effect works in the opposite direction.
Crowding
The Crowding-Out Effect
The crowding out effect works in the opposite direction.
Crowding
The Crowding-Out Effect
The higher interest rate raises the cost of borrowing
The Crowding-Out Effect
The higher interest rate raises the cost of borrowing
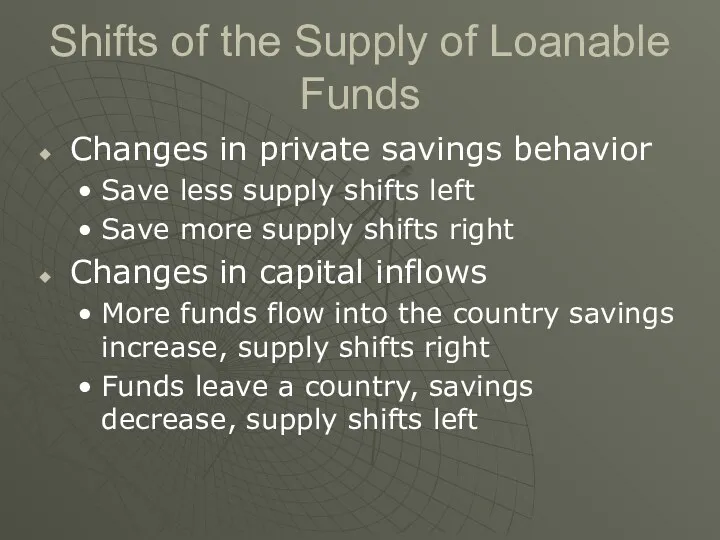
Shifts of the Supply of Loanable Funds
Changes in private savings behavior
Save
Shifts of the Supply of Loanable Funds
Changes in private savings behavior
Save
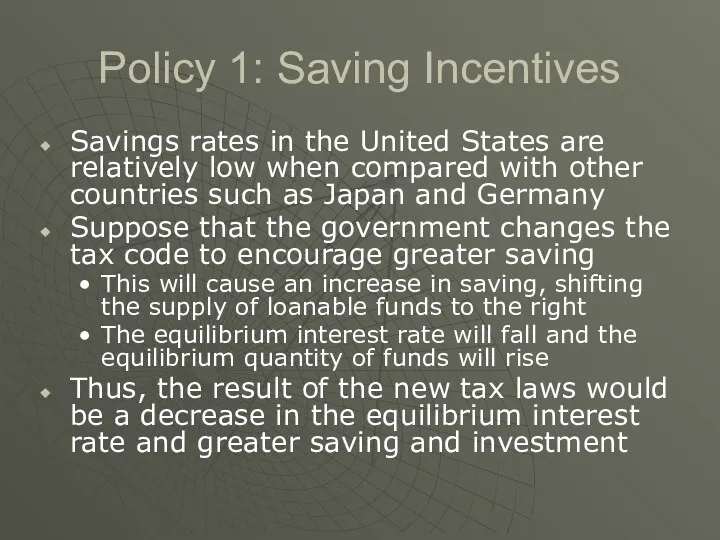
Policy 1: Saving Incentives
Savings rates in the United States are relatively
Policy 1: Saving Incentives
Savings rates in the United States are relatively
Policy 1: Saving Incentives
Interest
Rate
Loanable Funds ($billions)
D1
Tax incentives for saving increase the
Policy 1: Saving Incentives
Interest
Rate
Loanable Funds ($billions)
D1
Tax incentives for saving increase the
Policy 2: Investment Incentive
Suppose instead that the government passed a new
Policy 2: Investment Incentive
Suppose instead that the government passed a new
Policy 2: Investment Incentives
Interest
Rate
Loanable Funds ($billions)
D1
An investment tax credit increases the
Policy 2: Investment Incentives
Interest
Rate
Loanable Funds ($billions)
D1
An investment tax credit increases the
A C T I V E L E A R N
A C T I V E L E A R N
A C T I V E L E A R N
A C T I V E L E A R N
Policy 3: Government Budget Deficits and Surpluses
A budget deficit occurs if
Policy 3: Government Budget Deficits and Surpluses
A budget deficit occurs if
Policy 3: Govt Budget Deficits
Interest
Rate
Loanable Funds ($billions)
D1
A budget deficit reduces national
Policy 3: Govt Budget Deficits
Interest
Rate
Loanable Funds ($billions)
D1
A budget deficit reduces national
Policy 3: Government Budget Deficits and Surpluses
When the interest rate rises,
Policy 3: Government Budget Deficits and Surpluses
When the interest rate rises,
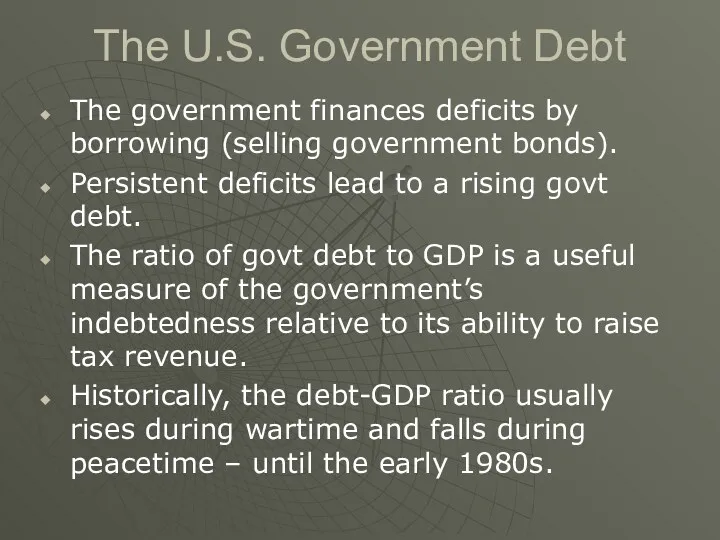
The U.S. Government Debt
The government finances deficits by borrowing (selling government
The U.S. Government Debt
The government finances deficits by borrowing (selling government
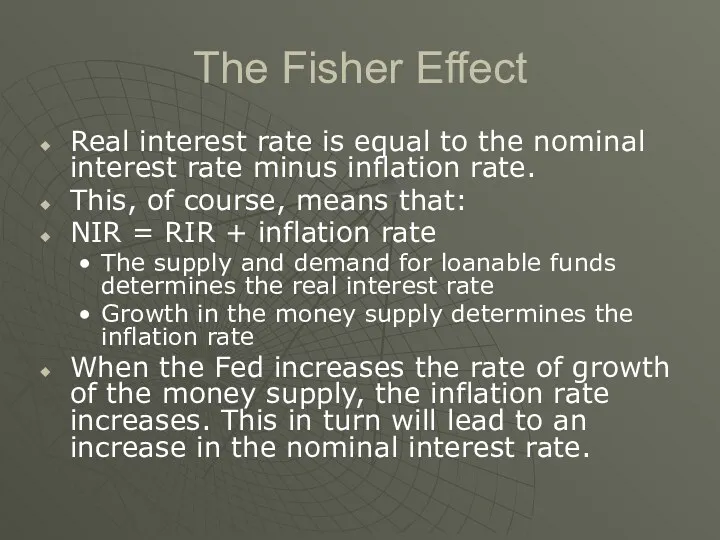
The Fisher Effect
Real interest rate is equal to the nominal interest
The Fisher Effect
Real interest rate is equal to the nominal interest
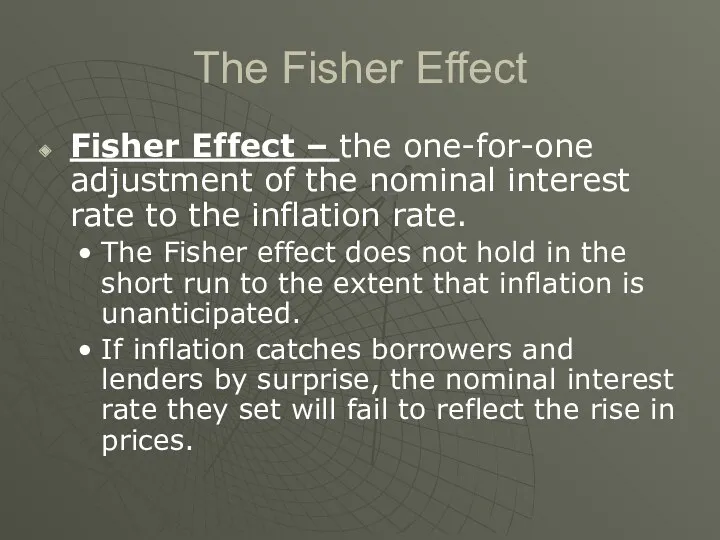
The Fisher Effect
Fisher Effect – the one-for-one adjustment of the nominal
The Fisher Effect
Fisher Effect – the one-for-one adjustment of the nominal
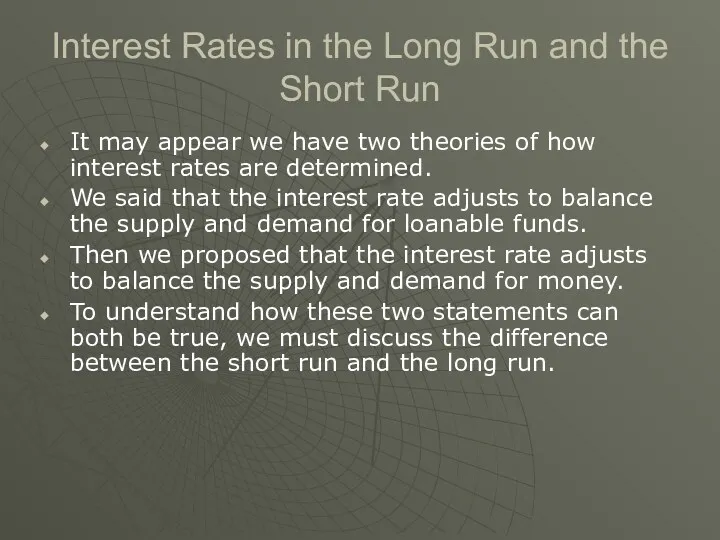
Interest Rates in the Long Run and the Short Run
It may
Interest Rates in the Long Run and the Short Run
It may
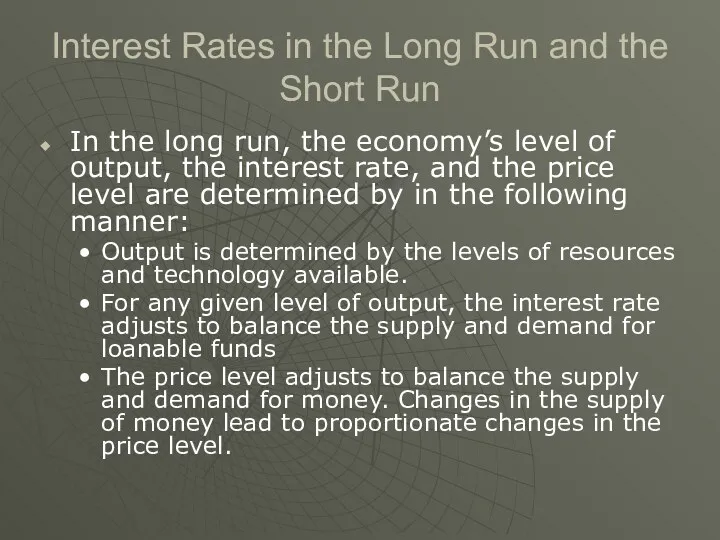
Interest Rates in the Long Run and the Short Run
In the
Interest Rates in the Long Run and the Short Run
In the
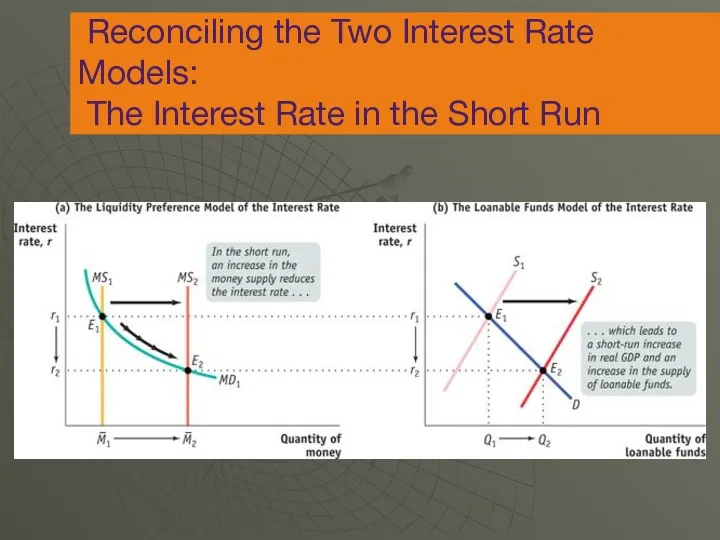
Reconciling the Two Interest Rate Models:
The Interest Rate in
Reconciling the Two Interest Rate Models: The Interest Rate in
 Статистика оплаты труда на предприятии
 Формирование уставного капитала
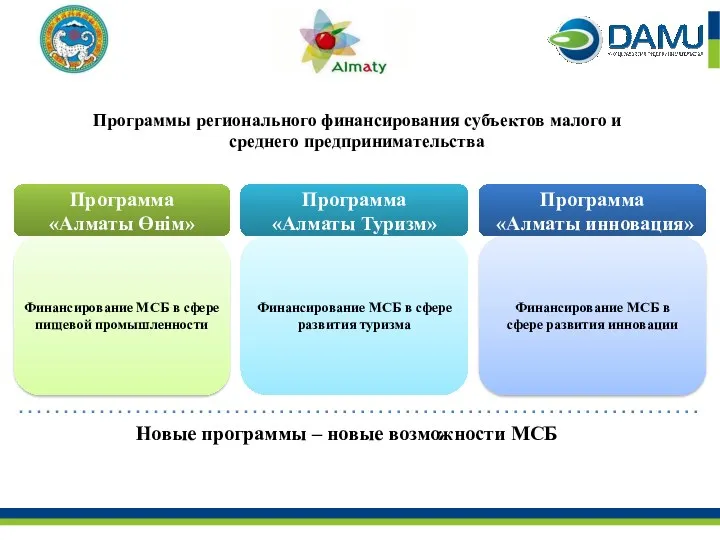 Программы регионального финансирования субъектов малого и среднего предпринимательства
 Бухгалтерский учет. Тесты-тренажер
 Фискальный механизм использования водных биологических ресурсов в Российской Федерации
 Структура модели управления недвижимостью и характеристика ее элементов. Принципы принятия инвестиционных решений
 Banking system
 Корпоративная форма организации бизнеса и управление корпоративными финансами
 Уровень лояльности работников к деятельности предприятия, на основании учёта их социальных потребностей
 Реабилитация бизнеса, если финансовые организации отказывают в проведении операции или в заключении договора банковского счета
 Стратегия и тактика в антикризисном управлении. Тема № 3
 Организация работы бухгалтерской службы кредитной организации
 Внедрение персонифицированного финансирования дополнительного образования детей
 Неделя финансовой грамотности для детей и молодежи. 10-11 класс
 Центральні банки
 МСФО (IFRS) 13. Оценка по справедливой стоимости
 Сутність та значення фондової біржі
 Применения новых ФСБУ при аудите бухгалтерской отчетности
 Учет материально-производственных запасов
 Учет расходов коммерческого банка на примере ПАО Сбербанк России
 Урок финансовой грамотности
 Инициативное бюджетирование в Республике Башкортостан
 Программа по кредитованию дополнительного оборудования и сервисных услуг
 Обязательное страхование вкладов: проблемы и перспективы( на примере ПАО Росгосстрах Банк)
 Налог на имущество организаций
 Налог на добавленную стоимость
 ВЭД услуги. Сложные вопросы НДС
 Topic 1. Introduction to Finance