- Financial and Economic Analysis

Содержание
- 2. Financial analysis is the study of the main indicators of the financial condition and financial performance
- 3. Financial analysis includes analysis of the assets and liabilities of the organization, its solvency, liquidity, financial
- 4. The main components of the financial - economic analysis of the enterprise are accounting analysis; horizontal
- 5. Horizontal analysis is comparing reporting indicators with indicators of previous periods. Vertical analysis is carried out
- 6. Calculation of financial ratios
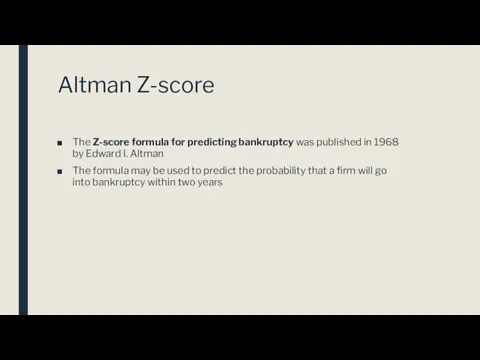
- 7. Altman Z-score The Z-score formula for predicting bankruptcy was published in 1968 by Edward I. Altman
- 8. Z = 1.2X1 + 1.4X2 + 3.3X3 + 0.6X4 + 1.0X5. X1 = working capital /
- 9. Z-score estimated for non-manufacturers & emerging markets Z = 6.56X1 + 3.26X2 + 6.72X3 + 1.05X4
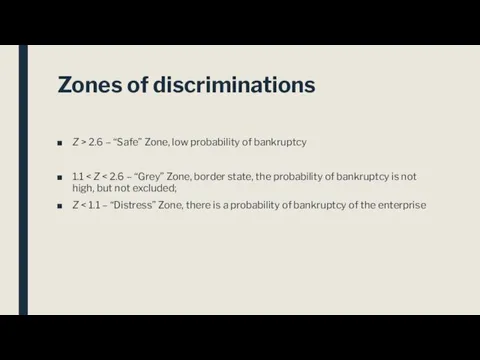
- 10. Zones of discriminations Z > 2.6 – “Safe” Zone, low probability of bankruptcy 1.1 Z
- 11. Z-score estimated for manufacturing enterprises Z′ = 0.717X1 + 0.847X2 + 3.107X3 + 0.420X4 + 0.998X5
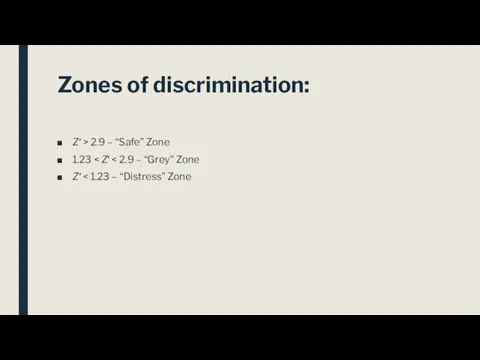
- 12. Zones of discrimination: Z′ > 2.9 – “Safe” Zone 1.23 Z′
- 13. Commonly-used financial ratios can be divided into the following five categories. Liquidity or Solvency Ratios Financial
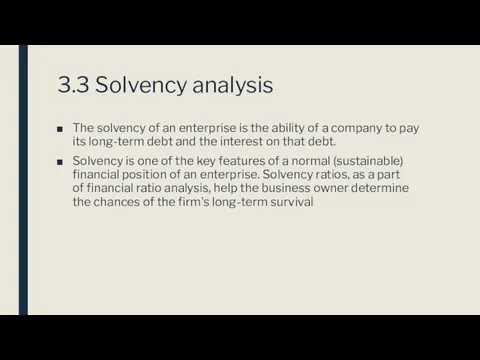
- 14. 3.3 Solvency analysis The solvency of an enterprise is the ability of a company to pay
- 15. The solvency of the company consists of two factors:
- 16. In the analysis of the first factor, the organization has net assets (equity). If the organization
- 17. If an organization has positive net assets, this does not indicate its good solvency. It is
- 18. There are several different solvency ratios, some of them technical and of use primarily to auditors
- 19. 2) The Equity Ratio explains how much of the company is owned by its investors. The
- 20. The Equity Ratio = 100000/150000 = 0,67 As you can see, ratio is .67. This means
- 21. 3) Interest Earned measures a company's ability meet its long-term debt obligations. It's calculated by dividing
- 22. A ratio of less than one indicates that a business may not be in a position
- 23. The solvency of the company in terms of asset liquidity is analyzed by means of special
- 25. Скачать презентацию
Financial analysis is the study of the main indicators of the
Financial analysis is the study of the main indicators of the
Financial analysis includes analysis of the assets and liabilities of the
Financial analysis includes analysis of the assets and liabilities of the
The main components of the financial - economic analysis of the
The main components of the financial - economic analysis of the
Horizontal analysis is comparing reporting indicators with indicators of previous periods.
Vertical
Horizontal analysis is comparing reporting indicators with indicators of previous periods.
Vertical
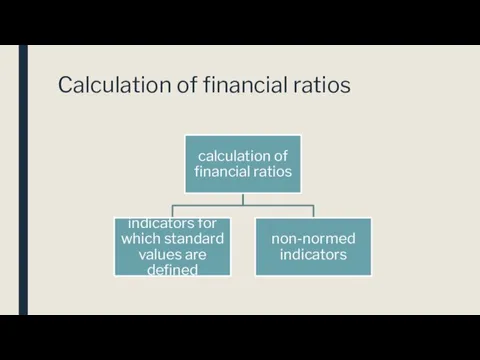
Calculation of financial ratios
Calculation of financial ratios
Altman Z-score
The Z-score formula for predicting bankruptcy was published in 1968 by Edward I.
Altman Z-score
The Z-score formula for predicting bankruptcy was published in 1968 by Edward I.
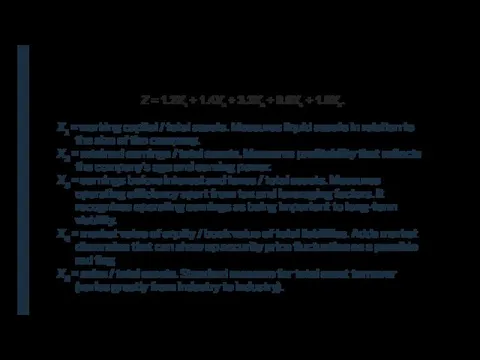
Z = 1.2X1 + 1.4X2 + 3.3X3 + 0.6X4 + 1.0X5.
X1 = working capital / total assets.
Z = 1.2X1 + 1.4X2 + 3.3X3 + 0.6X4 + 1.0X5.
X1 = working capital / total assets.
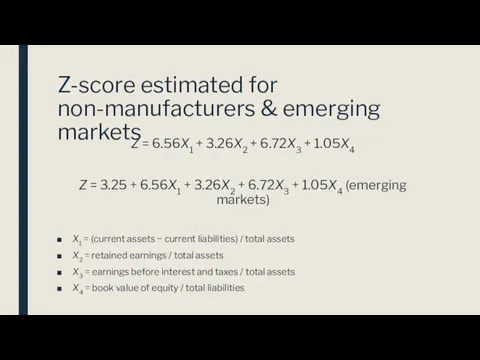
Z-score estimated for non-manufacturers & emerging markets
Z = 6.56X1 + 3.26X2 + 6.72X3 + 1.05X4
Z =
Z-score estimated for non-manufacturers & emerging markets
Z = 6.56X1 + 3.26X2 + 6.72X3 + 1.05X4
Z =
Zones of discriminations
Z > 2.6 – “Safe” Zone, low probability of bankruptcy
1.1
Zones of discriminations
Z > 2.6 – “Safe” Zone, low probability of bankruptcy
1.1
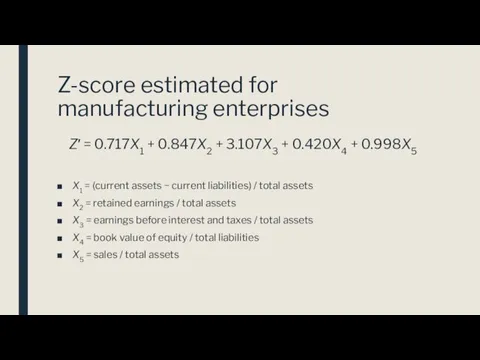
Z-score estimated for manufacturing enterprises
Z′ = 0.717X1 + 0.847X2 + 3.107X3 + 0.420X4 +
Z-score estimated for manufacturing enterprises
Z′ = 0.717X1 + 0.847X2 + 3.107X3 + 0.420X4 +
Zones of discrimination:
Z′ > 2.9 – “Safe” Zone
1.23 < Z′ < 2.9
Zones of discrimination:
Z′ > 2.9 – “Safe” Zone
1.23 < Z′ < 2.9
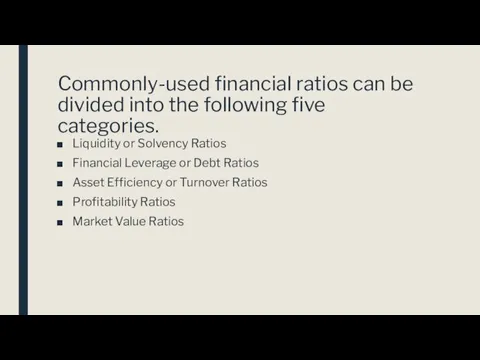
Commonly-used financial ratios can be divided into the following five categories.
Liquidity or
Commonly-used financial ratios can be divided into the following five categories.
Liquidity or
3.3 Solvency analysis
The solvency of an enterprise is the ability of
3.3 Solvency analysis
The solvency of an enterprise is the ability of
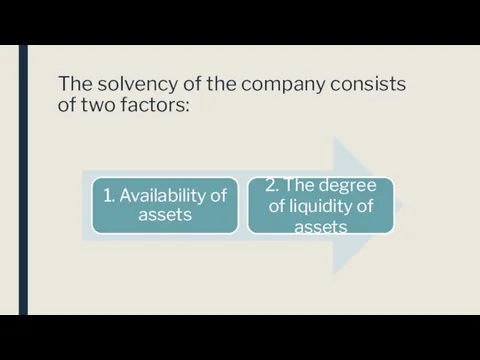
The solvency of the company consists of two factors:
The solvency of the company consists of two factors:
In the analysis of the first factor, the organization has net
In the analysis of the first factor, the organization has net
If an organization has positive net assets, this does not indicate
If an organization has positive net assets, this does not indicate
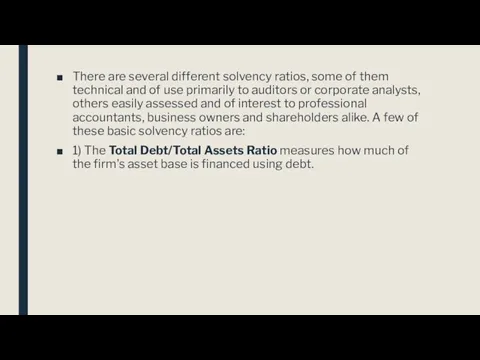
There are several different solvency ratios, some of them technical and
There are several different solvency ratios, some of them technical and
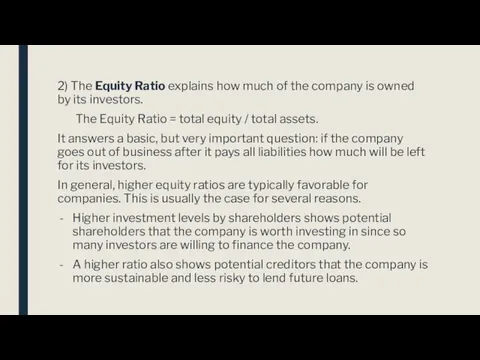
2) The Equity Ratio explains how much of the company is owned by
2) The Equity Ratio explains how much of the company is owned by
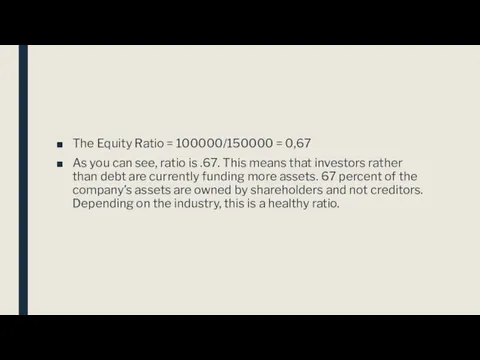
The Equity Ratio = 100000/150000 = 0,67
As you can see, ratio
The Equity Ratio = 100000/150000 = 0,67
As you can see, ratio
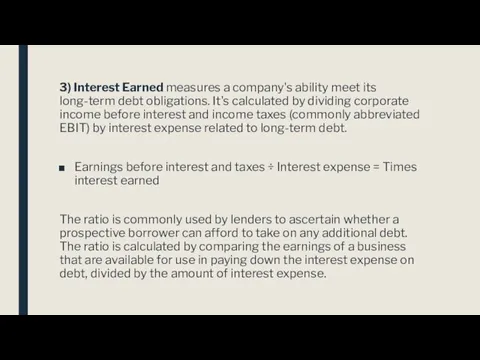
3) Interest Earned measures a company's ability meet its long-term debt obligations.
3) Interest Earned measures a company's ability meet its long-term debt obligations.
A ratio of less than one indicates that a business may
A ratio of less than one indicates that a business may
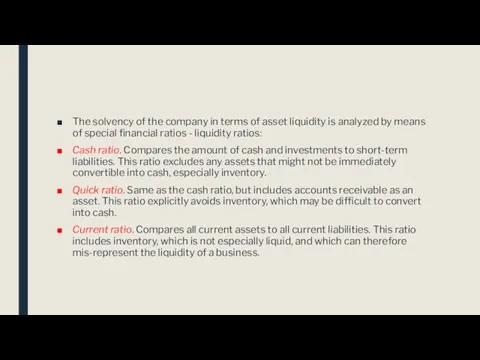
The solvency of the company in terms of asset liquidity is
The solvency of the company in terms of asset liquidity is
 Определение рентабельности аптечной организации
 Школьная карта. Для родителей
 Формирование и учет финансовых результатов деятельности страховых организаций. Тема 6
 Банковская система
 Транспортный налог в Челябинской области на 2016 год
 Учет труда и заработной платы. Тема 8
 Денежные потоки предприятия и управление ими
 Концептуальные модели и факторы создания стоимости предприятия
 Финансово-правовые нормы, их особенности, виды и структура
 Мошенничество на финансовых рынках
 Развитие страхового рынка в зарубежных странах
 ФСБУ 25/2018 Бухгалтерский учёт аренды
 Выпускная квалификационная работа: Оценка и повышение финансовой устойчивости организации
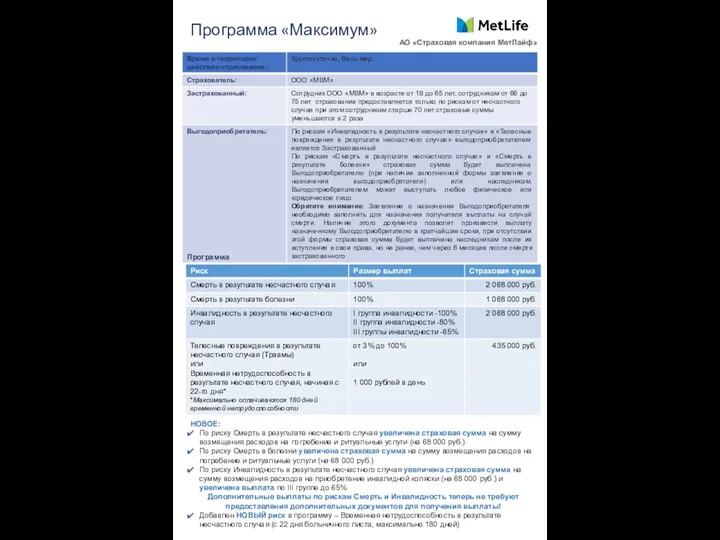 Программа Максимум АО Страховая компания МетЛайф
 Жеке табыс салығы
 Учет денежных средств
 Задачи по корпоративным финансам
 Управління фінансовими ресурсами підприємства аграрного сектору
 Роль и функции Центрального банка Российской Федерации
 Публічні доходи та публічні видатки
 Франциядағы бухгалтерлік есеп
 Источники финансовых ресурсов предприятия
 Need money to grow your business
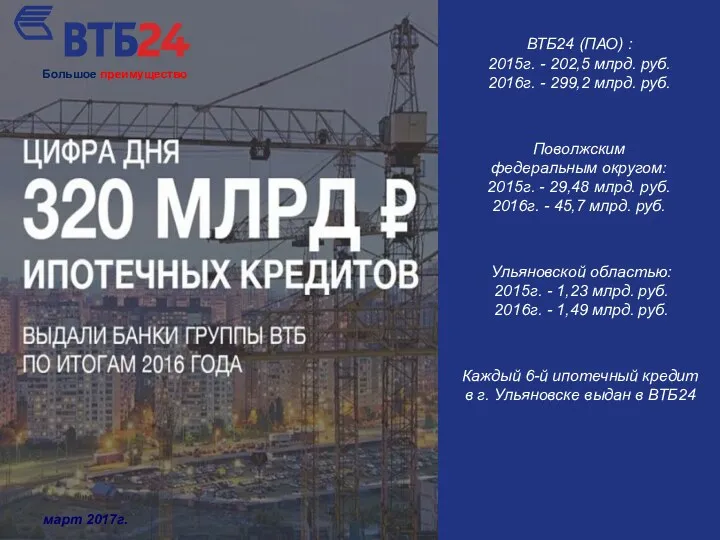 Ипотечное кредитование ВТБ 24
 Ценообразование и ценовая политика
 Оценка готовой продукции: аспект бухгалтерской отчётности
 Росбанк Premium Banking
 Урок финансовой грамотности