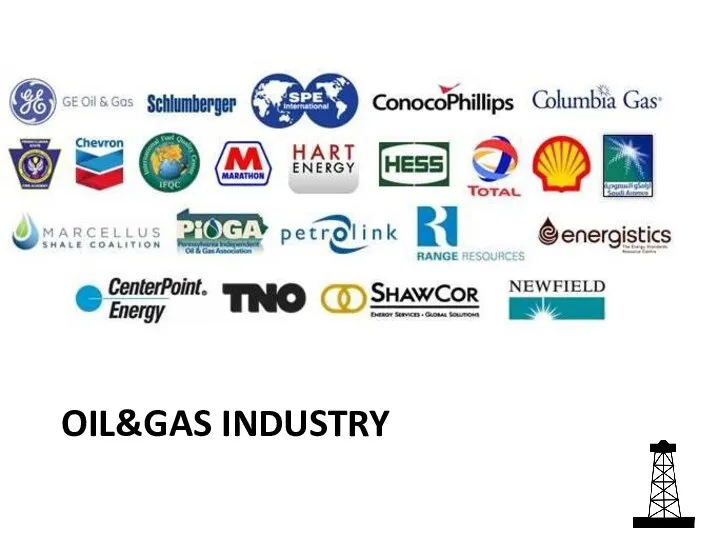
Слайд 2
Intro
Industry analysis is a type of investment research that begins by
focusing on the status of an industry or an industrial sector.
Why is this important? Each industry is different, and using one cookie-cutter approach to analysis is sure to create problems. Imagine, for example, comparing the P/E ratio of a tech company to that of a utility. Because you are, in effect, comparing apples to oranges, the analysis is next to useless.
Слайд 3
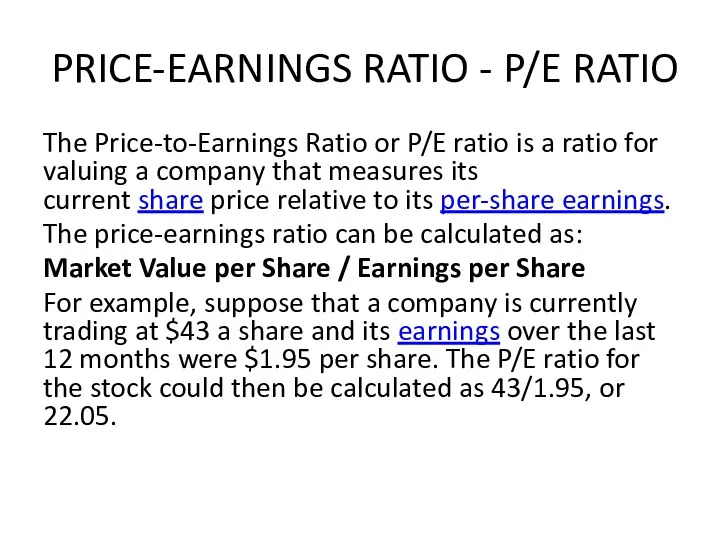
PRICE-EARNINGS RATIO - P/E RATIO
The Price-to-Earnings Ratio or P/E ratio is
a ratio for valuing a company that measures its current share price relative to its per-share earnings.
The price-earnings ratio can be calculated as:
Market Value per Share / Earnings per Share
For example, suppose that a company is currently trading at $43 a share and its earnings over the last 12 months were $1.95 per share. The P/E ratio for the stock could then be calculated as 43/1.95, or 22.05.
Слайд 4
P/E cont’d
EPS is most often derived from the last four quarters. This
form of the price-earnings ratio is called trailing P/E, which may be calculated by subtracting a company’s share value at the beginning of the 12-month period from its value at the period’s end, adjusting for stock splits if there have been any. Sometimes, price-earnings can also be taken from analysts’ estimates of earnings expected during the next four quarters. This form of price-earnings is also called projected or forward P/E. A third, less common variation uses the sum of the last two actual quarters and the estimates of the next two quarters.
The price-earnings ratio is also sometimes known as the price multiple or the earnings multiple.
Слайд 5
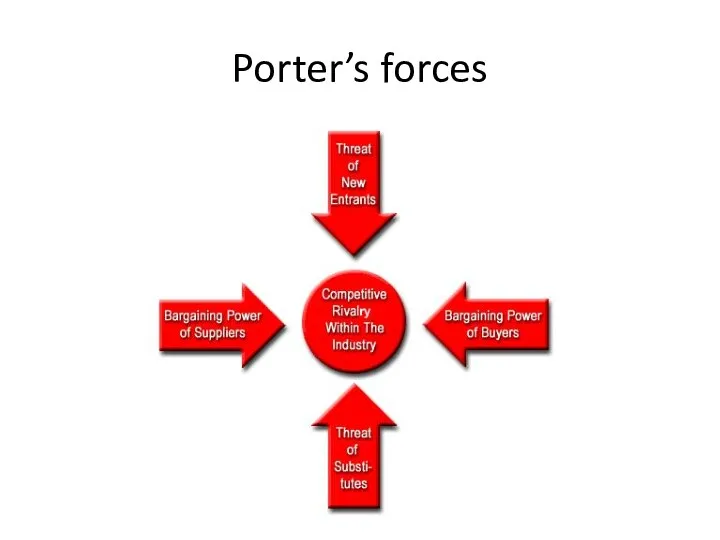
Porter's 5 Forces Analysis
The model originated from Michael E. Porter's 1980
book "Competitive Strategy: Techniques for Analyzing Industries and Competitors." Since then, it has become a frequently used tool for analyzing a company's industry structure and its corporate strategy.
In his book, Porter identified five competitive forces that shape every single industry and market. These forces help us to analyze everything from the intensity of competition to the profitability and attractiveness of an industry.
Слайд 6
Слайд 7
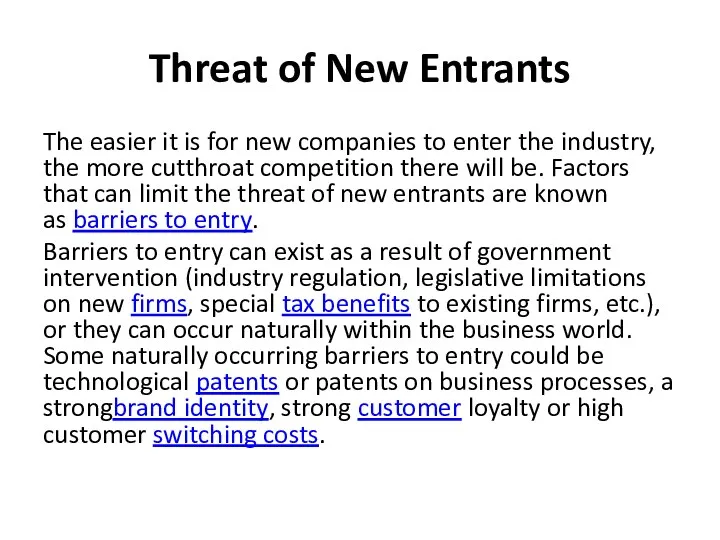
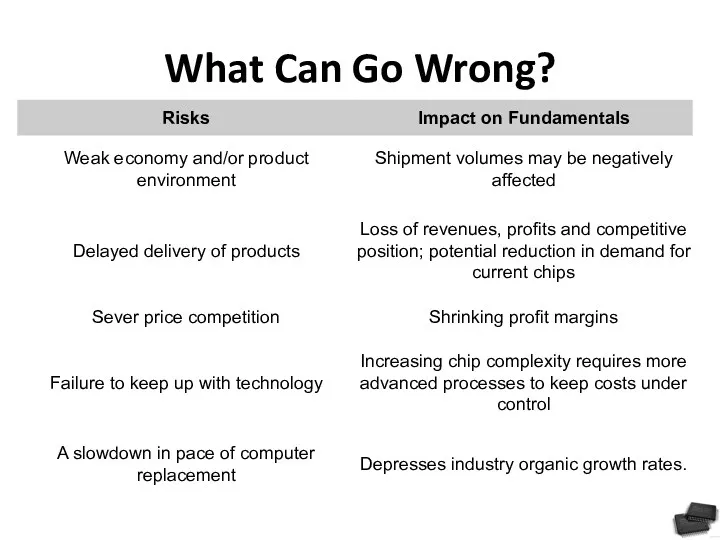
Threat of New Entrants
The easier it is for new companies to
enter the industry, the more cutthroat competition there will be. Factors that can limit the threat of new entrants are known as barriers to entry.
Barriers to entry can exist as a result of government intervention (industry regulation, legislative limitations on new firms, special tax benefits to existing firms, etc.), or they can occur naturally within the business world. Some naturally occurring barriers to entry could be technological patents or patents on business processes, a strongbrand identity, strong customer loyalty or high customer switching costs.
Слайд 8
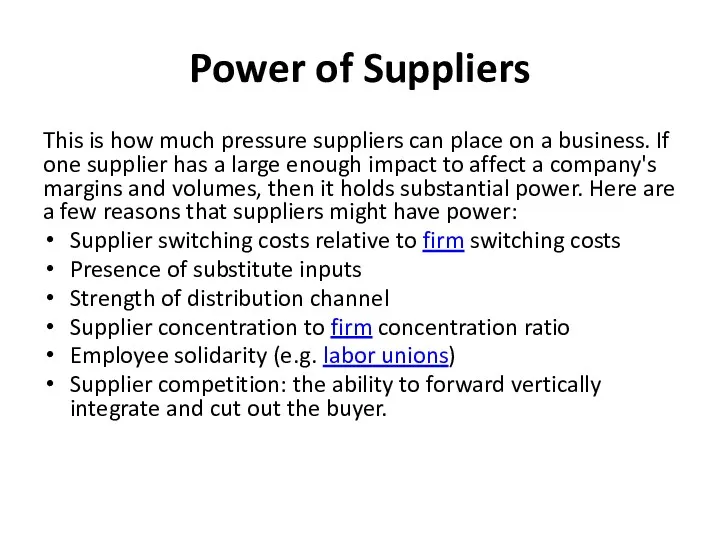
Power of Suppliers
This is how much pressure suppliers can place
on a business. If one supplier has a large enough impact to affect a company's margins and volumes, then it holds substantial power. Here are a few reasons that suppliers might have power:
Supplier switching costs relative to firm switching costs
Presence of substitute inputs
Strength of distribution channel
Supplier concentration to firm concentration ratio
Employee solidarity (e.g. labor unions)
Supplier competition: the ability to forward vertically integrate and cut out the buyer.
Слайд 9
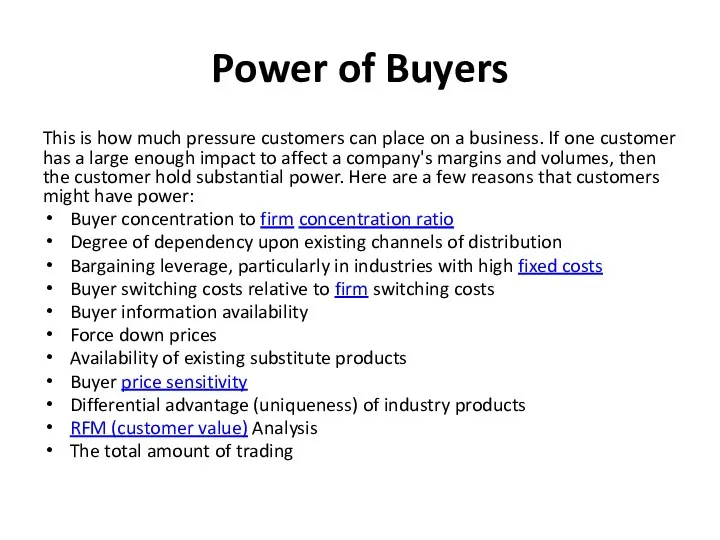
Power of Buyers
This is how much pressure customers can place
on a business. If one customer has a large enough impact to affect a company's margins and volumes, then the customer hold substantial power. Here are a few reasons that customers might have power:
Buyer concentration to firm concentration ratio
Degree of dependency upon existing channels of distribution
Bargaining leverage, particularly in industries with high fixed costs
Buyer switching costs relative to firm switching costs
Buyer information availability
Force down prices
Availability of existing substitute products
Buyer price sensitivity
Differential advantage (uniqueness) of industry products
RFM (customer value) Analysis
The total amount of trading
Слайд 10
Competitive Rivalry
This describes the intensity of competition between existing firms in
an industry. Highly competitive industries generally earn low returns because the cost of competition is high. A highly competitive market might result from:
Sustainable competitive advantage through innovation
Competition between online and offline companies
Level of advertising expense
Powerful competitive strategy
Firm concentration ratio
Degree of transparency
Слайд 11
Availability of Substitutes
What is the likelihood that someone will switch
to a competitive product or service? If the cost of switching is low, then this poses a serious threat. Here are a few factors that can affect the threat of substitutes:
Potential factors:
Buyer propensity to substitute
Relative price performance of substitute
Buyer switching costs
Perceived level of product differentiation
Number of substitute products available in the market
Ease of substitution
Substandard product
Quality depreciation
Availability of close substitute
Слайд 12

Слайд 13
Overview
The airline industry exists in an intensely competitive market. In recent
years, there has been an industry-wide shakedown, which will have far-reaching effects on the industry's trend towards expanding domestic and international services. In the past, the airline industry was at least partly government owned. This is still true in many countries, but in the U.S. all major airlines have come to be privately held.
Слайд 14
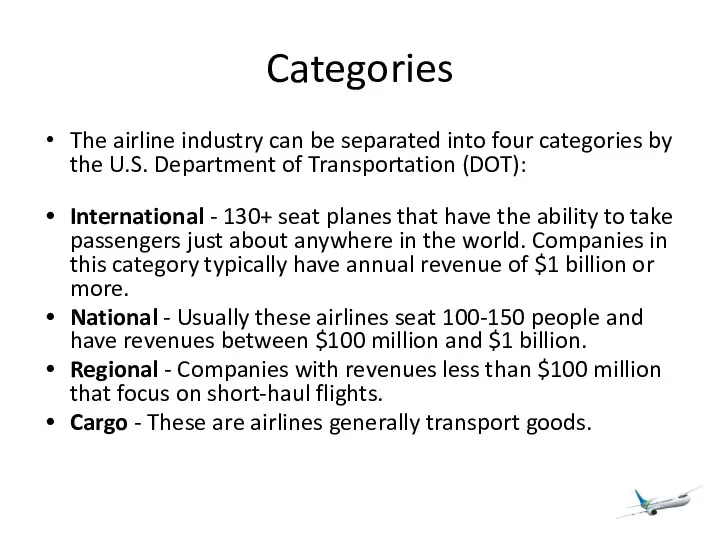
Categories
The airline industry can be separated into four categories by the
U.S. Department of Transportation (DOT):
International - 130+ seat planes that have the ability to take passengers just about anywhere in the world. Companies in this category typically have annual revenue of $1 billion or more.
National - Usually these airlines seat 100-150 people and have revenues between $100 million and $1 billion.
Regional - Companies with revenues less than $100 million that focus on short-haul flights.
Cargo - These are airlines generally transport goods.
Слайд 15
Factors
Airport capacity, route structures, technology and costs to lease or buy
the physical aircraft are significant in the airline industry. Other large issues are:
Weather - Weather is variable and unpredictable. Extreme heat, cold, fog and snow can shut down airports and cancel flights, which costs an airline money.
Fuel Cost - According to the Air Transportation Association (ATA), fuel is an airline's second largest expense. Fuel makes up a significant portion of an airline's total costs, although efficiency among different carriers can vary widely. Short haul airlines typically get lower fuel efficiency because take-offs and landings consume high amounts of jet fuel.
Labor - According to the ATA, labor is the an airline's No.1 cost; airlines must pay pilots, flight attendants, baggage handlers, dispatchers, customer service and others.
Слайд 16
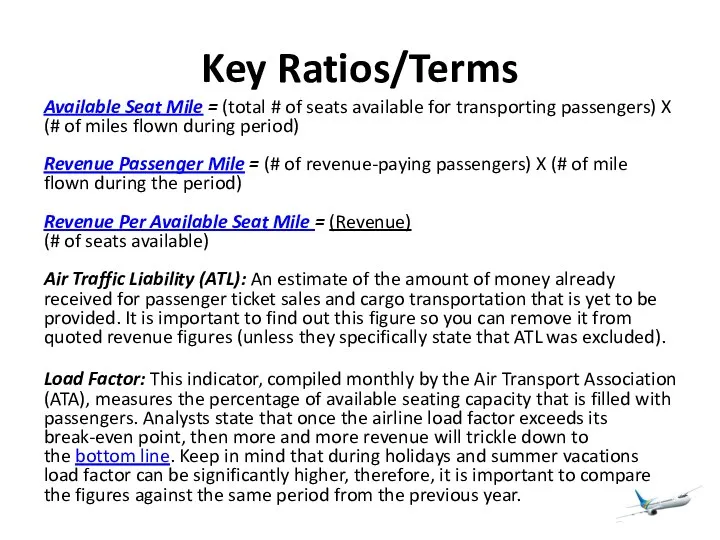
Key Ratios/Terms
Available Seat Mile = (total # of seats available for transporting passengers)
X (# of miles flown during period)
Revenue Passenger Mile = (# of revenue-paying passengers) X (# of mile flown during the period)
Revenue Per Available Seat Mile = (Revenue)
(# of seats available)
Air Traffic Liability (ATL): An estimate of the amount of money already received for passenger ticket sales and cargo transportation that is yet to be provided. It is important to find out this figure so you can remove it from quoted revenue figures (unless they specifically state that ATL was excluded).
Load Factor: This indicator, compiled monthly by the Air Transport Association (ATA), measures the percentage of available seating capacity that is filled with passengers. Analysts state that once the airline load factor exceeds its break-even point, then more and more revenue will trickle down to the bottom line. Keep in mind that during holidays and summer vacations load factor can be significantly higher, therefore, it is important to compare the figures against the same period from the previous year.
Слайд 17
Tips for analysis
Revenue flow. Airlines also earn revenue from transporting cargo,
selling frequent flier miles to other companies and up-selling in flight services. But the largest proportion of revenue is derived from regular and business passengers. For this reason, it is important that you take consumer and business confidence into account on top of the regular factors that one should consider like earnings growth and debt load.
Types of travelers. Business travelers are important to airlines because they are more likely to travel several times throughout the year and they tend to purchase the upgraded services that have higher margins for the airline. On the other hand, leisure travelers are less likely to purchase these premium services and are typically very price sensitive. In times of economic uncertainty or sharp decline in consumer confidence, you can expect the number of leisure travelers to decline.
Geography. Obviously, more market share is better for a particular market, but it is also important to stay diversified. Try to find out the destination to which the majority of an airline's flights are traveling. For example, an airline that sends a high number of flights to the Caribbean might see a dramatic drop in profits if the outlook for leisure travelers looks poor.
Costs. The airline industry is extremely sensitive to costs such as fuel, labor and borrowing costs. If you notice a trend of rising fuel costs, you should factor that into your analysis of a company. Fuel prices tend to fluctuate on a monthly basis, so paying close attention to these costs is crucial.
Слайд 18
Threat of New Entrants.
At first glance, you might think that the
airline industry is pretty tough to break into, but don't be fooled. You'll need to look at whether there are substantial costs to access bank loans and credit. If borrowing is cheap, then the likelihood of more airliners entering the industry is higher. The more new airlines that enter the market, the more saturated it becomes for everyone. Brand name recognition and frequent fliers point also play a role in the airline industry. An airline with a strong brand name and incentives can often lure a customer even if its prices are higher.
Слайд 19
Power of Suppliers.
The airline supply business is mainly dominated by Boeing
and Airbus. For this reason, there isn't a lot of cutthroat competition among suppliers. Also, the likelihood of a supplier integrating vertically isn't very likely. In other words, you probably won't see suppliers starting to offer flight service on top of building airlines.
Слайд 20
Power of Buyers.
The bargaining power of buyers in the airline industry
is quite low. Obviously, there are high costs involved with switching airplanes, but also take a look at the ability to compete on service. Is the seat in one airline more comfortable than another? Probably not unless you are analyzing a luxury liner like the Concord Jet.
Слайд 21
Availability of Substitutes.
What is the likelihood that someone will drive or
take a train to his or her destination? For regional airlines, the threat might be a little higher than international carriers. When determining this you should consider time, money, personal preference and convenience in the air travel industry.
Слайд 22
Competitive Rivalry.
Highly competitive industries generally earn low returns because the cost
of competition is high. This can spell disaster when times get tough in the economy.
Слайд 23
Слайд 24
Drilling
Drilling companies physically drill and pump oil out of the ground.
The drilling industry has always been classified as highly skilled. The people with the skills and expertise to operate drilling equipment are in high demand, which means that for an oil company to have these people on staff all the time can cost a lot. For this reason, most drilling companies are simply contractors who are hired by oil and gas producers for a specified period of time. (For related reading, see Unearth Profits In Oil Exploration And Production.)
In the drilling industry, there are several different types of rigs, each with a specialized purpose. Some of these include:
Land Rigs - Drilling depths ranges from 5,000 to 30,000 feet.
Submersible Rigs - Used for ocean, lake and swamp drilling. The bottom part of these rigs are submerged to the sea's floor and the platform is on top of the water.
Jack-ups - this type of rig has three legs and a triangular platform which is jacked-up above the highest anticipated waves.
Drill Ships - These look like tankers/ships, but they travel the oceans in search of oil in extremely deep water.
Слайд 25
Oilfield Services
Oilfield service companies assist the drilling companies in setting up
oil and gas wells. In general these companies manufacture, repair and maintain equipment used in oil extraction and transport. More specifically, these services can include:
Seismic Testing - This involves mapping the geological structure beneath the surface.
Transport Services - Both land and water rigs need to be moved around at some point in time.
Directional Services - Believe it or not, all oil wells are not drilled straight down, some oil services companies specialize in drilling angled or horizontal holes.
R&D Services
Слайд 26
Oil and gas transportation, storage, processing and sales
Pipelines
Railroad transportation
Oil and gas
terminals
Chemical processing factories
Wholesale
Retail (gas filling stations, stividor services, etc)
Слайд 27
Drilling vs refining
Drilling and other service firms are highly dependent on
the price and demand for petroleum. These firms are some of the first to feel the effects of increased or decreased spending. If oil prices rise, it takes time for petroleum companies to size up land, setup rigs, take out the oil, transport it and refine it before the oil company sees any profit. On the other hand, oil services and drilling companies are the first on the scene when companies decide to start exploring.
The refining business is not quite as fragmented as the drilling and services industry. This sector is dominated by a small handful of large players. In fact, much of the energy industry is ruled by large, integrated oil companies. Integrated refers to the fact that many of these companies look after all factors of production, refining and marketing.
For the most part, refining is a slow and stable business. The large amounts of capital investment means that very few companies can afford to enter this business.
Слайд 28
Key Ratios/Terms
BTUs: Short for "British Thermal Units." This is the amount of
heat required to increase the temperature of one pound of water by one degree Fahrenheit. Different fuels have different heating values; by quoting the price per BTU it is easier to compare different types of energy.
Dayrates: Oil and gas drillers usually charge oil producers on a daily work rate. These rates vary depending on the location, the type of rig and the market conditions. There are plenty of research firms that publish this information. Higher dayrates are great for drilling companies, but for refiners and distribution companies this means lower margins unless energy prices are rising at the same rate.
Meterage: Another type of contract that differs from dayrates is one based on how deep the rig drills. These are called meterage, or footage, contracts. These are less desirable because the depth of the oil deposits are unpredictable; it's really a gamble on the driller's part.
Downstream: Refers to oil and gas operations after the production phase and through to the point of sale, whether at the gas pump or the home heating oil truck
Upstream: The grass roots of the oil business, upstream refers to the exploration and production of oil and gas. Many analysts look at upstream expenditures from previous quarters to estimate future industry trends. For example, a decline in upstream expenditures usually trickles down to other areas such as transportation and marketing.
OPEC: The Organization of Petroleum Exporting Countries is an intergovernmental organization dedicated to the stability and prosperity of the petroleum market. OPEC membership is open to any country that is a substantial exporter of oil and that shares the ideals of the organization. OPEC has 11 member countries. Output quotas placed by OPEC can send huge shocks throughout the energy markets.
Слайд 29
Analysis insights -1
Economics/Politics
The oil industry is easily influenced by economic and
political conditions. If a country is in a recession, fewer products are being manufactured, not as many people drive to work, take vacations, etc. All of these variables factor into less energy use. The best time to invest in an oil company is when the economy is firing on all cylinders and oil companies are making so much money that using excessive amounts of energy themselves has little effect on their bottom line.
Some analysts believe that rather than analyzing energy companies, you should just predict the trend in energy prices. While more analysis is needed for a prudent investment than simply looking at price trends in oil, it's true that there is a strong correlation between the performance of energy companies and the commodity price for energy.
Supply and Demand
Oil and gas prices fluctuate on a minute by minute basis, taking a look at the historical price range is the first place you should look. Many factors determine the price of oil, but it really all comes down to supply and demand. Demand typically does not fluctuate too much (except in the case of recession), but supply shocks can occur for a number of reasons. When OPEC meets to determine oil supply for the coming months, the price of oil can fluctuate wildly. Day-to-day fluctuations should not influence your investment decision in a particular energy company, but long-term trends should be followed more closely.
Слайд 30
Analysis insights -2
Rig Utilization Rates
Another factor that determines supply is the
rig utilization rates; its close relationship to oil prices is not a coincidence. Higher utilization rates mean more revenue and profits. For drilling companies, it is important to take a close look at the company's rig fleet, because older rigs lack the ability to drill in remote locations or to bore deep holes. Some other factors to consider are the depth of water that the offshore rigs can drill in, hole depth and horsepower. Higher quality rigs will have higher utilization rates, especially during weak periods. This will lead to higher revenue growth. Sometimes this is a double-edged sword; while higher utilization is better, a company that is at its capacity will have difficulty increasing revenues further.
Contracts
The contracts through which an oil services company is paid also play a large role in supply. Pay close attention to the dayrates, as falling dayrates can dramatically decrease revenues. The opposite is true should dayrates rise. This is because many of the drillers' costs are fixed.
Слайд 31
Analysis insights - 3
Financial Statements
After these wide scale factors have been
considered, it's time to get down to the nitty gritty - the financials. And when it comes to the financials, the same old rules apply to oil services companies. Ideally, revenues and profits will be growing consistently, just as they do in any quality company. It's worth digging deeper to see if there are any one-time events that have dramatically increased revenues. Also, the P/E ratio and PEG ratios should be comparable to others within the industry.
On the balance sheet, investors should keep an eye on debt levels. High debt puts a strain on credit ratings, weakening their ability to purchase new equipment or finance other capital expenditures. Poor credit ratings also make it difficult to acquire new business. If customers have the choice of going with a company that is strong versus one that is having debt problems, which do you think they will choose? To do a test for financial leverage, take a look at the debt/equity ratio. The working capital also tells us whether the company has enough liquid assets to cover short term liabilities. Rating agencies like Moody's and S&P say 50% is a prudent debt/equity ratio. Companies in more stable markets can afford slightly higher debt/equity ratios.
If profits are of the utmost importance, then the statement of cash flow is a close second. Oil companies are notorious for reporting non cash line items in the income statement. For this reason, you should try to decipher the cash EPS. By stripping away all the non-cash entities you will get a truer number because cash flow cannot be manipulated as easily as net income can.
Слайд 32
Threat of New Entrants.
There are thousands of oil and oil services
companies throughout the world, but the barriers to enter this industry are enough to scare away all but the serious companies. Barriers can vary depending on the area of the market in which the company is situated. For example, some types of pumping trucks needed at well sites cost more than $1 million each. Other areas of the oil business require highly specialized workers to operate the equipment and to make key drilling decisions. Companies in industries such as these have higher barriers to entry than ones that are simply offering drilling services or support services. Having ample cash is another barrier - a company had better have deep pockets to take on the existing oil companies.
Слайд 33
Power of Suppliers.
While there are plenty of oil companies in the
world, much of the oil and gas business is dominated by a small handful of powerful companies. The large amounts of capital investment tend to weed out a lot of the suppliers of rigs, pipeline, refining, etc. There isn't a lot of cut-throat competition between them, but they do have significant power over smaller drilling and support companies.
Слайд 34
Power of Buyers.
The balance of power is shifting toward buyers. Oil
is a commodity and one company's oil or oil drilling services are not that much different from another's. This leads buyers to seek lower prices and better contract terms.
Слайд 35
Availability of Substitutes.
Substitutes for the oil industry in general include alternative
fuels such as coal, gas, solar power, wind power, hydroelectricity and even nuclear energy. Remember, oil is used for more than just running our vehicles, it is also used in plastics and other materials. When analyzing an energy company it is extremely important to take a close look at the specific area in which the company is operating. Also, companies offering more obscure or specialized services such as seismic drilling or directional drilling tools are much more likely to withstand the threat of substitutes.
Слайд 36
Competitive Rivalry.
Slow industry growth rates and high exit barriers are a
particularly troublesome situation facing some firms. Until quite recently, oil refineries were a particularly good example. For a period of almost 20 years, no new refineries were built in the U.S. Refinery capacity exceeded the product demands as a result of conservation efforts following the oil shocks of the 1970s. At the same time, exit barriers in the refinery business are quite high. Besides the scrap value of the equipment, a refinery that does not operate has no value-adding capability. Almost every refinery can do one thing - produce the refined products they have been designed for.
Слайд 37

Слайд 38
Overview
The precious metals industry is very capital intensive. Constructing mines and building production
facilities requires huge sums of capital. Long-term survival requires heavy expenditures to finance production and exploration. Technology has played a big role in the computer and internet industry, but it has also greatly changed the mining industry. Gold is the most popular precious metal for investors. As you may know, gold is a commodity, and, as such, the price for gold fluctuates on a daily basis in the commodity markets.
While there is a lot of overlap between the basics of mining gold and silver, the primary focus of here is on the gold market. Silver is less valuable than gold, and, as such, it is usually discovered either by accident or as a byproduct of gold/lead/copper mining.
Слайд 39
Industry structure
The metals industry is not vertically integrated like other industries such as
oil and energy. In the metals industry, the companies that mine the gold typically do not refine it, and refiners rarely sell it directly to the public. The industry encompasses three types of firms:
Exploration. These companies have very little in the way of assets. They explore and prove that gold exists in a particular area. The only major assets owned by exploration firms are the rights to drill and a small amount of capital, which is needed to conduct drilling and trenching operations.
Development. Once a gold deposit is discovered by exploration companies, they either try to become development firms, or they sell their gold find to development firms. Development firms are those operating on explored areas that have prove to be mines. The only real difference between development and exploration is that, for development firms, their area has proved to be a gold deposit.
Production. Producer firms are full-fledged mining companies that extract and produce gold from existing mines; this production can range from a hundred thousand ounces to several million ounces of gold production per year.
Слайд 40
Key Ratios/Terms
Mine Production Rates: Serious gold investors follow the Gold Survey very closely, published
by Gold Fields Mineral Services. Each year, it lists the worldwide mine production statistics. Increasing production rates means more supply, which ultimately means a lower price for gold - if demand remains stable.
Scrap Recovery: Another statistic published in the Gold Survey, scrap recovery refers to the worldwide supply of gold from sources other than mine production. This includes recovered old jewelry, industrial byproducts, etc. Throughout the 1990s, more than 15% of the world's gold supply came from scrap recovery.
Futures Sales by Producers As you probably know, gold trades in the futures markets. Gold producers are constantly monitoring the prices in the futures markets because it determines the price at which they can sell their gold. The Gold Survey lists statistics on producer sales. If producers are selling an increasing amount in the futures market, it could mean that prices will fall very soon. By purchasing futures contracts the producer "locks-in" a price. Therefore, if the price of gold falls in future months, it won't affect the producer's bottom line. Conversely, if prices continue to rise after the producer locks in, they won't be able to capitalize on the higher prices.
Bullion: This denotes gold and silver that is refined and officially recognized as high quality (at least 99.5% pure). It is usually in the form of bars rather than coins. When you hear of investors or central banks holding gold reserves, it is usually in the form of bullion.
Ore: This refers to mineralized rock that contains metal. Gold producers mine gold ore and then extract the gold from it using either chemicals, extreme heat, or some other method. There are different types of ores, of which the most common are oxide ores and sulphide ores.
Слайд 41
Analysis insights -1
The price of gold fluctuates on a minute-by-minute basis,
so taking a look at the historical price range is the first place you should look. Many factors determine the price of gold, but it really all comes down to supply and demand. Demand typically does not fluctuate too much, but supply shocks can send prices either soaring or into the doldrums.
The difference between production costs and the futures price for gold equals the gross profit margins for mining companies. Therefore, the second place you want to look is the cost of production. The main factors to look at are the following:
Location - Where is the gold being mined? Political unrest in developing nations has ruined more than one mining company. Developing nations might have cheaper labor and mining costs, but the political risks are huge. If you are risk averse, then look for companies with mines in relatively stable areas of the world. The costs might be higher, but at least the company knows what it\'s getting into.
Ore Quality - Ore is mineralized rock that contains metal. Higher quality ore will contain more gold, which is usually reported as ounces of gold per ton of ore. Generally speaking, oxide ores are better because the rock is more porous, making it easier to remove the gold.
Mine Type - The type of mine a company uses is a big factor in production costs. Most underground mines are more expensive than open pit mines.
Слайд 42
Analysis insights -2
Cost of Production.The cost of production is probably the
most widely followed measure for analyzing a gold producer. The lower the costs, the greater the operating leverage, which means that earnings are more stable and less volatile to changes in the price of gold. For example, a company that has a cash cost around $175/ounce is, for obvious reasons, in a much better position than one whose cost is $275/ounce. The low-cost producer has much more staying power than the marginal producer. In fact, if the price of gold declines below $275/ounce, the higher-cost producer would have to stop producing until the price goes back up. Producers usually publish their cost of production in their annual report; this cost includes everything from site preparation to milling and refining. It doesn't include exploration costs, financing, or any other administrative expenses the company might incur.
Aside from looking at costs, investors should carefully look over revenue growth. Revenue is output times the selling price for gold, so it may fluctuate from year to year. Well-run companies will attempt to hedge against fluctuating gold prices through the futures markets. Take a look at the revenue fluctuations over the past several years. Ideally, the revenue growth should be smooth. Companies with revenues that fluctuate widely from year to year are very hard to analyze and aren't where the smart money goes.
Debt Levels. Investors should keep an eye on debt levels, which are on the balance sheet. High debt puts a strain on credit ratings, weakening the company's ability to purchase new equipment or finance other capital expenditures. Poor credit ratings also make it difficult to acquire new businesses.
Слайд 43
Analysis insights -3
P/E. As a final caveat (beware), never analyze a
precious-metals company based on the price-to-earnings ratio. In general, a high P/E means high projected earnings in the future, but all gold stocks have high P/E ratios. The P/E ratio for a gold stock doesn't really tell us anything because precious metals companies need to be compared by assets, not earnings. Unlike buildings and machinery, gold companies have large amounts of gold in their vaults and in mines throughout the world. Gold on the balance sheet is unlike other capital assets; gold is seen as currency of last resort. Investors are therefore willing to pay more for a gold company because it is the next best thing to physically holding the gold themselves.
There are a few valuation techniques that analysts use when comparing various precious metal companies. The most popular and widely used ratio is market capitalization per ounce of reserves (market cap divided by reserves). This indicates to investors what they are paying for each ounce of reserves. Obviously, a lower price is better..
Слайд 44
Threat of New Entrants.
Financing is a principal barrier to entry in the
precious-metals industry, which is heavily capital intensive. Constructing mines, production facilities, exploration and development and mining equipment all require large sums of capital. This capital is required before the mine is in production. Therefore, favorable financing terms are extremely important. In short, long-term survival in the precious-metal market requires significant capital.
Слайд 45
Power of Suppliers.
The only supply-side issues that miners face deal with
government regulations and rules. The supply of land is plentiful, but gaining approval and permits to mine the land can be difficult, especially if environmental risks are high.
Слайд 46

Power of Buyers.
Gold is a commodity-based business, so the gold from
one company is not that much different from another's. This translates into buyers seeking lower prices and better contract terms.
Слайд 47
Availability of Substitutes.
Substitutes for the precious metals industry include other precious
metals such as diamonds, silver, platinum, etc. These are worthy substitutes for gold, but they are not as widely accepted as gold. Gold has the advantage of being standard for a world currency, so a gold bar in the U.S. is worth the same as it is in Ecuador. As other forms of precious metals such as diamonds gain popularity, they may also become more threatening as substitutes
Слайд 48
Competitive Rivalry.
Gold companies don't compete on price, mainly because the prices
are determined by market forces. But gold companies do compete for land. The backbone of a precious metals company is its reserves, and the only way to beef up reserves is to explore for good mining areas. Companies go to great lengths to discover gold deposits, and the discovery is on a first-come-first-serve basis.
Слайд 49

Слайд 50
Overview
The auto manufacturing industry is considered to be highly capital and labor intensive.
The major costs for producing and selling automobiles include:
Labor - While machines and robots are playing a greater role in manufacturing vehicles, there are still substantial labor costs in designing and engineering automobiles.
Materials - Everything from steel, aluminum, dashboards, seats, tires, etc. are purchased from suppliers.
Advertising - Each year automakers spend billions on print and broadcast advertising; furthermore, they spent large amounts of money on market research to anticipate consumer trends and preferences.
Over and above the labor and material costs we mentioned above, there are other developments in the automobile industry that you must consider when analyzing an automobile company. Globalization, the tendency of world investment and businesses to move from national and domestic markets to a worldwide environment, is a huge factor affecting the auto market. More than ever, it is becoming easier for foreign automakers to enter the North American market.
Слайд 51
Market players
The auto market is thought to be made primarily of
automakers, but auto parts makes up another lucrative sector of the market. The major areas of auto parts manufacturing are:
Original Equipment Manufacturers (OEMs) - The big auto manufacturers do produce some of their own parts, but they can't produce every part and component that goes into a new vehicle. Companies in this industry manufacture everything from door handles to seats.
Replacement Parts Production and Distribution - These are the parts that are replaced after the purchase of a vehicle. Air filters, oil filers and replacement lights are examples of products from this area of the sector.
Rubber Fabrication - This includes everything from tires, hoses, belts, etc.
In the auto industry, a large proportion of revenue comes from selling automobiles. The parts market, however, is even more lucrative. For example, a new car might cost $18,000 to buy, but if you bought, from the automaker, all the parts needed to construct that car, it would cost 300-400% more.
Слайд 52
Key Ratios/Terms
Fleet Sales: Traditionally, these are high-volume sales designated to come from
large companies and government agencies. These sales are almost always at discount prices. In the past several years, auto makers have been extending fleet sales to small businesses and other associations.
Seasonally Adjusted Annual Rate of Sales (SAAR): Most auto makers experience increased sales during the second quarter (April to June), and sales tend to be sluggish between November and January. For this reason, it is important to compare sales figures to the same period of the previous year.
Sales Reports: Many of the large auto makers release their preliminary sales figures from the previous month on a monthly basis. This can give you an indication of the current trends in the industry.
Day Sales Inventory = Average Inventory/Average Daily Sales
Слайд 53
Analysis Insight -1
Automobiles depend heavily on consumer trends and tastes. While car
companies do sell a large proportion of vehicles to businesses and car rental companies (fleet sales), consumer sales is the largest source of revenue. For this reason, taking consumer and business confidence into account should be a higher priority than considering the regular factors like earnings growth and debt load.
Another caveat of analyzing an automaker is taking a look at whether a company is planning makeovers or complete redesigns. Every year, car companies update their cars. This is a part of normal operations, but there can be a problem when a company decides to significantly change the design of a car. These changes can cause massive delays and glitches, which result in increased costs and slower revenue growth. While a new design may pay off significantly in the long run, it's always a risky proposition.
For parts suppliers, the life span of an automobile is very important. The longer a car stays operational, the greater the need for replacement parts. On the other hand, new parts are lasting longer, which is great for consumers, but is not such good news for parts makers. When, for example, most car makers moved from using rolled steel to stainless steel, the change extended the life of parts by several years.
Слайд 54
Analysis Insight -2
A significant portion of an automaker's revenue comes from the
services it offers with the new vehicle. Offering lower financial rates than financial institutions, the car company makes a profit on financing. Extended warranties also factor into the bottom line.
Greater emphasis on leasing has also helped increase revenues. The advantage of leasing is that it eases consumer fears about resale value, and it makes the car sound more affordable. From a maker's perspective, leasing is a great way to hide the true price of the vehicle through financing costs. Car companies, then, are able to push more cars through. Unfortunately, profiting on leasing is not as easy as it sounds. Leasing requires the automakers to accurately judge the value of their vehicles at the end of the lease, otherwise they may actually lose money. If you think about it, the automaker will lose money on the lease if they give the car a high salvage value. A car with a low salvage value at the end of the lease will simply be bought by the consumer and flipped for a profit.
Слайд 55
Threat of New Entrants.
It's true that the average person can't come
along and start manufacturing automobiles. Historically, it was thought that the American automobile industry and the Big Three were safe. But this did not hold true when Honda Motor Co. opened its first plant in Ohio. The emergence of foreign competitors with the capital, required technologies and management skills began to undermine the market share of North American companies.
Слайд 56
Power of Suppliers.
The automobile supply business is quite fragmented (there are
many firms). Many suppliers rely on one or two automakers to buy a majority of their products. If an automaker decided to switch suppliers, it could be devastating to the previous supplier's business. As a result, suppliers are extremely susceptible to the demands and requirements of the automobile manufacturer and hold very little power.
Слайд 57
Power of Buyers.
Historically, the bargaining power of automakers went unchallenged. The
American consumer, however, became disenchanted with many of the products being offered by certain automakers and began looking for alternatives, namely foreign cars. On the other hand, while consumers are very price sensitive, they don't have much buying power as they never purchase huge volumes of cars.
Слайд 58
Availability of Substitutes.
Be careful and thorough when analyzing this factor: we
are not just talking about the threat of someone buying a different car. You need to also look at the likelihood of people taking the bus, train or airplane to their destination. The higher the cost of operating a vehicle, the more likely people will seek alternative transportation options. The price of gasoline has a large effect on consumers' decisions to buy vehicles. Trucks and sport utility vehicles have higher profit margins, but they also guzzle gas compared to smaller sedans and light trucks. When determining the availability of substitutes you should also consider time, money, personal preference and convenience in the auto travel industry. Then decide if one car maker poses a big threat as a substitute.
Слайд 59
Competitive Rivalry.
Highly competitive industries generally earn low returns because the cost
of competition is high. The auto industry is considered to be an oligopoly, which helps to minimize the effects of price-based competition. The automakers understand that price-based competition does not necessarily lead to increases in the size of the marketplace; historically they have tried to avoid price-based competition, but more recently the competition has intensified - rebates, preferred financing and long-term warranties have helped to lure in customers, but they also put pressure on the profit margins for vehicle sales.
Слайд 60

Слайд 61
Structure
Without getting into specific product categories within the retailing industry, the
overall segments can be divided into two categories:
Hard - These types of goods include appliances, electronics, furniture, sporting goods, etc. Sometimes referred to as "hardline retailers."
Soft - This category includes clothing, apparel, and other fabrics.
Each retailer tries to differentiate itself from the competition, but the strategy that the company uses to sell its products is the most important factor. Here are some different types of retailers:
Department Stores - Very large stores offering a huge assortment of goods and services.
Discounters - These also tend to offer a wide array of products and services, but they compete mainly on price.
Demographic - These are retailers that aim at one particular segment. High-end retailers focusing on wealthy individuals would be a good example.
Слайд 62
Key Ratios/Terms
Same Store Sales: Used when analyzing individual retailers. It compares sales
in stores that have been open for a year or more. This allows investors to compare what proportion of new sales have come from sales growth compared to the opening of new stores. This is important because although new stores are good, there eventually comes a saturation point at which future sales growth comes at the expense of losses at other locations. Same store sales are also commonly referred to as "comps."
Sales per Square Foot: Sales/Square Footage. Store space is considered to be a productive asset and the key to profitability. Successful companies generate as much sales volume as possible out of each square foot of store space. More recently, analysts have created modifications of this concept by looking at a retailers' gross margin per square foot.
Inventory Turnover: This ratio shows how many times the inventory of a firm is sold and replaced over a specific period. Generally calculated as: Sales/Inventory, but, may also be calculated as: Cost of Goods Sold /Inventory.
Слайд 63
Key Ratios/Terms cont’d
Average Inventory. Although the first calculation is more frequently
used, COGS may be substituted because sales are recorded at market value while inventories are usually recorded at cost. Also, average inventory may be used instead of the ending inventory to help minimize seasonal factors. This ratio should be compared against similar retail companies or the industry average. A low turnover might imply poor sales and, therefore, excess inventory. A high ratio implies either strong sales or ineffective buying from suppliers. (For related reading, see
Consumer Confidence: The Consumer Confidence Index (CCI) is put out by the Consumer Confidence Board around the middle of each month. The Consumer Confidence Survey is based on a sample of 5,000 U.S. households and is considered to be one of the most accurate indicators of confidence. Increasing confidence means more spending and borrowing for consumers - a positive for retailers.
Personal Income & Disposable Income: Every quarter, the Bureau of Economic Analysis releases the latest income data for U.S. citizens. There is a high correlation between retail sales data and the changes in personal income.
Слайд 64
Analysis insights -1
The biggest problem for analyzing these companies is the
lack of consistency between accounting procedures. It takes a careful eye when comparing performance ratios and figures from one company to the next. For example, some companies tend to include shipping and storage in their cost of goods sold, while others list it as a separate expense. This is why you must read all the notes to the financial statements and gain a better understanding of what is and isn't included in the various figures.
Aside from earnings and revenue growth, one important thing to look at is the markup percentage for the retailer. This is also known as the gross profit margin (sales minus cost of goods sold). Unfortunately, there is not one margin that every retailer should use: discount stores generally have lower margins compared to other general merchandisers. When comparing these numbers, higher margins are usually better because it means the company has more room to work with during price wars, intensified competition or when demand slows.
Слайд 65
Analysis insights -2
Inventory is also a key figure to pay close attention
to as without it, retailers don't have anything to sell. A company's inventory situation depends on what type of products it offers. For example, the inventory turnover for a grocery store (with perishable goods) will be higher than that of a department store. Compare the turnover rates of direct competitors: those with higher rates tend to have fresh new products that sell more frequently. Keep in mind that an increase in inventory is not always a cause for alarm. Sometimes inventory will increase as a result of new stores opening or the expansion of existing stores. Therefore, compare the increase in inventory to the growth of new stores to see if there is more to the story.
Слайд 66
Analysis insights -3
As one final caveat (beware) when looking at performance
data and financial statements for retailers is to compare them against the same period for the previous year. Holiday spending and other seasonal factors can mean wild swings in financial results from one quarter to the next. Compare the Christmas season results for the company over the same season from previous years. There isn't one store out there that doesn't see an increase in sales during the month of December, so don't be fooled by comparisons to preceding months. This is why year-over-year same store sales figures are so widely followed by investors and analysts. When retailers release their same store sales figures on the first or second Thursday of every month, they are usually compared to the same time period from previous years. To take this one step further, compare sales data for more than just one month. Aggressive marketing or discounts can skew data for one particular month; therefore, you need to look at the overall trend in same store sales over several months.
Слайд 67
Threat of New Entrants.
One trend that started over a decade ago
has been a decreasing number of independent retailers. Walk through any mall and you'll notice that a majority of them are chain stores. While the barriers to start up a store are not impossible to overcome, the ability to establish favorable supply contracts, leases and be competitive is becoming virtually impossible. Their vertical structure and centralized buying gives chain stores a competitive advantage over independent retailers.
Слайд 68
Power of Suppliers
. Historically, retailers have tried to exploit relationships with
suppliers. A great example was in the 1970s, when Sears sought to dominate the household appliance market. Sears set very high standards for quality; suppliers that didn't meet these standards were dropped from the Sears line. You could also liken this to the strict control that Wal-Mart places on its suppliers. A contract with a large retailer such as Wal-Mart can make or break a small supplier. In the retail industry, suppliers tend to have very little power.
Слайд 69
Power of Buyers.
Individually, customers have very little bargaining power with retail
stores. It is very difficult to bargain with the clerk at Safeway for a better price on grapes. But as a whole, if customers demand high-quality products at bargain prices, it helps keep retailers honest.
Слайд 70
Availability of Substitutes.
The tendency in retail is not to specialize
in one good or service, but to deal in a wide range of products and services. This means that what one store offers you will likely find at another store. Retailers offering products that are unique have a distinct or absolute advantage over their competitors.
Слайд 71
Competitive Rivalry.
Retailers always face stiff competition. The slow market growth for
the retail market means that firms must fight each other for market share. More recently, they have tried to reduce the cutthroat pricing competition by offering frequent flier points, memberships and other special services to try and gain the customer's loyalty.
Слайд 72
Слайд 73
Overview
Running a bank is just as difficult as analyzing it for
investment purposes. A bank's management must look at the following criteria before it decides how many loans to extend, to whom the loans can be given, what rates to set, and so on:
Capital Adequacy and the Role of Capital
Asset and Liability Management - There is a happy medium between banks overextending themselves (lending too much) and lending enough to make a profit.
Interest Rate Risk - This indicates how changes in interest rates affect profitability.
Liquidity - This is formulated as the proportion of outstanding loans to total assets. If more than 60-70% of total assets are loaned out, the bank is considered to be highly illiquid.
Asset Quality - What is the likelihood of default?
Profitability - This is earnings and revenue growth.
Слайд 74
Key Ratios/Terms -1
Interest Rates: In the U.S., the Federal Reserve decides the
interest rates. Because interest rates directly affect the credit market (loans), banks constantly try to predict the next interest rate moves, so they can adjust their own rates. A bad prediction on the movement of interest rates can cost millions. (To learn more, read Trying To Predict Interest Rates.)
Gap: This refers to the difference, over time, between the assets and liabilities of a financial institution. A "negative gap" occurs when liabilities are higher than assets. Conversely, when there are more assets than liabilities, there is a positive gap. When interest rates are going up, banks with a positive gap will profit. The opposite is true when interest rates are falling.
Capital Adequacy: A bank's capital, or equity, is the margin by which creditors are covered if the bank has to liquidate assets. A good measure of a bank's health is its capital/asset ratio, which, by law, is required to be above a prescribed minimum.
Слайд 75
Key Ratios/Terms -2
The following are the current minimum capital adequacy ratios:
Tier 1
capital to total risk weighted credit (see below) must not be less than 4%.
Total capital (Tier 1 plus Tier 2 less certain deductions) to total risk weighted credit exposures must not be less than 8%.
The risk weighting is prescribed by the Bank for International Settlements. For example, cash and government securities are said to have zero risk, whereas mortgages have a risk weight of 0.5. Multiplying the assets by their risk weights gives the total risk-weighted assets, which is then used to determine the capital adequacy.
Tier 1 Capital: In relation to the capital adequacy ratio, Tier 1 capital can absorb losses without a bank being required to cease trading. This is core capital, and includes equity capital and disclosed reserves.
Tier 2 Capital: In relation to the capital adequacy ratio, Tier 2 capital can absorb losses in the event of a winding up, so it provides less protection to depositors. It includes items such as undisclosed reserves, general loss reserves and subordinated term debt.
Слайд 76
Key Ratios/Terms
Gross Yield on Earning Assets (GYEA)
= Total Interest Income/Total Earning
Assets
This tells you what yields were generated from invested capital (assets).
Rates Paid on Funds (RPF)
= Total Interest Expense /Total Earning Assets
This tells you the average interest rate that the bank is paying on borrowed funds.
Net Interest Margin (NIM)
= (Total Interest Income - Total Interest Expense) /Total Earning Assets
This tells you the average interest margin that the bank is receiving by borrowing and lending funds
Слайд 77
Analysis Insights -1
Interest rate fluctuations play a huge role in the
profitability of a bank. Banks are, therefore, trying to get away from this dependency by generating more revenue on fee-based services. Many bank financial statements will break up the revenue figures into fee-based (or non interest) and non-fee (interest) generated revenue. Make sure you take a close look at the fee-based revenue: firms with a higher fee-based revenue will typically earn a higher return on assets than competitors.
Evaluating management can be difficult because so many aspects of the job are intangible. One key figure for evaluating management is the net interest margin (NIM) (defined above). Look at the past NIM across several years to determine its trends. Ideally, you want to see an even or upward trend. Most banks will have NIMs in the 2-5% range; this might appear low, but don't be fooled - a .01% change from the previous year means big changes in profits.
Слайд 78
Analysis Insights -2
Another good metric for evaluating management performance is a
bank's return on assets (ROA). When calculating ROA, remember that banks are highly leveraged, so a 1% ROA indicates huge profits. This is one area that catches a lot of investors: technology companies might have an ROA of 5% or more, but these figures cannot be directly compared to banks. (To learn more, read ROA On The Way.)
As with other industries, you want to know that a bank has costs under control, and that things are being run efficiently. Closely analyze the bank's operating expenses. Ideally, you want to see operating expenses remain the same as previous years or to decrease. This isn't to say that an increase in operating expenses is a bad thing, as long as revenues are also increasing.
Слайд 79
Analysis Insights -3
As we mentioned in the above section, a measure
of a bank's financial health is its capital adequacy. If a bank is having difficulty meeting the capital ratio requirements, it can use a number of ways to increase the ratio. If it is publicly traded, it can issue new stock or sell more subordinated debt. That, however, may be costly if the bank is in a weak financial position. Small banks, most of which are not publicly traded, generally do not have the option of selling new stock. If the bank cannot increase its equity, it can reduce its assets to improve the capital ratio. Shrinking the balance sheet, however, is not attractive because it hurts profitability. The last option is to seek a merger with a stronger bank.
Слайд 80
Threat of New Entrants.
The average person can't come along and start
up a bank, but there are services, such as internet bill payment, on which entrepreneurs can capitalize. Banks are fearful of being squeezed out of the payments business, because it is a good source of fee-based revenue. Another trend that poses a threat is companies offering other financial services. What would it take for an insurance company to start offering mortgage and loan services? Not much. Also, when analyzing a regional bank, remember that the possibility of a mega bank entering into the market poses a real threat.
Слайд 81
Power of Suppliers.
The suppliers of capital might not pose a big
threat, but the threat of suppliers luring away human capital does. If a talented individual is working in a smaller regional bank, there is the chance that person will be enticed away by bigger banks, investment firms, etc.
Слайд 82
Power of Buyers.
The individual doesn't pose much of a threat to
the banking industry, but one major factor affecting the power of buyers is relatively high switching costs. If a person has a mortgage, car loan, credit card, checking account and mutual funds with one particular bank, it can be extremely tough for that person to switch to another bank. In an attempt to lure in customers, banks try to lower the price of switching, but many people would still rather stick with their current bank. On the other hand, large corporate clients have banks wrapped around their little fingers. Financial institutions - by offering better exchange rates, more services, and exposure to foreign capital markets - work extremely hard to get high-margin corporate clients.
Слайд 83
Availability of Substitutes.
As you can probably imagine, there are plenty of
substitutes in the banking industry. Banks offer a suite of services over and above taking deposits and lending money, but whether it is insurance, mutual funds or fixed income securities, chances are there is a non-banking financial services company that can offer similar services. On the lending side of the business, banks are seeing competition rise from unconventional companies. Sony (NYSE: SNE), General Motors (NYSE:GM) and Microsoft (Nasdaq:MSFT) all offer preferred financing to customers who buy big ticket items. If car companies are offering 0% financing, why would anyone want to get a car loan from the bank and pay 5-10% interest?
Слайд 84
Competitive Rivalry.
The banking industry is highly competitive. The financial services industry
has been around for hundreds of years, and just about everyone who needs banking services already has them. Because of this, banks must attempt to lure clients away from competitor banks. They do this by offering lower financing, preferred rates and investment services. The banking sector is in a race to see who can offer both the best and fastest services, but this also causes banks to experience a lower ROA. They then have an incentive to take on high-risk projects. In the long run, we're likely to see more consolidation in the banking industry. Larger banks would prefer to take over or merge with another bank rather than spend the money to market and advertise to people.
Слайд 85

Слайд 86
Overview
Biotechnology uses of biological processes in the development or manufacture of
a product or in the technological solution to a problem. Since the discovery of DNA in 1953, and the identification of DNA as the genetic material in all life, there have been tremendous advances in the vast area of biotechnology. Biotech has a wide range of uses including food alterations, genetic research and cloning, human and animal health care, pharmaceuticals and the environment.
The biotech arena has not been without controversy. In the 1970s, researchers were forced to stop doing certain types of DNA experiments, and other countries banned the use of genetically modified agricultural products. More recently, we've seen the controversy over cloning as well as stem-cell research. Perhaps the biggest development in the biotechnology field (as far as investors go) occurred when, in the 1980s, the U.S. Supreme Court ruled to allow for patenting of genetically modified life forms. This means that intellectual property will always be at the forefront of biotechnology - some argue that the scope of patent protection actually defines the industry.
Because of extremely high research and development costs coupled with very little revenue in the years of development, many biotechnology companies must partner with larger firms to complete product development. Over the past decade, the biotech industry, along with the hundreds of smaller companies operating in it, has been dominated by a small handful of big companies; however, any one of these smaller companies have the potential to produce a product that sends them soaring to the top.
Слайд 87

Common Applications of Biotechnology
Слайд 88
Key Ratios/Terms
Research and Development (R&D) as a percentage of
Sales = R&D
Expenditures/Revenue
Generally speaking, the higher the percentage spent on R&D, the more is being spent developing new products. Thus, the lower this is, the better. This ratio is useful when comparing one company to another or to the industry in general.
Medicare/Medicaid: This national health insurance program is responsible for reimbursing individuals for certain health related costs. Any sudden changes in funding and reimbursement rates can have profound effects on the biotech industry.
Orphan Drugs: These are drugs designed to treat people with rare diseases and infections (occurring in less than 200,000 individuals). Once the drugs are marketed to the public, orphan drug makers might not benefit from huge demand, but governments will usually subsidize many of the costs of producing these drugs.
Because drug development is an important aspect of biotechnology, understanding the process of approval of drugs for sale to the problem is also an important part of investing in the biotech industry.
Слайд 89

… only 1-2 out of 20 drugs that enter the FDA
testing process actually gain final approval.
Слайд 90
Analysis Insight -1
Analyzing even a blue-chip company is no easy task. The job
is even more difficult when the company in question has very little revenue and its livelihood hinges on one or two potential products.
As with analyzing any company, estimating earnings is key. Because of the long R&D phase, during which there is little revenue coming in, determining the prospective earnings of a biotech company is tricky. You can start by looking at the company's products in both development and production. For a company that is already selling products, looking at the sales trends makes it easy to determine the growth rates and market potential for the drug. For products in the pipeline you need to look at the disease that the drug/product intends to target and how large that market is. A drug that cures the common cold, cancer or heart disease is more lucrative than an orphan drug targeting an obscure disease affecting fewer than 100,000 people in North America; furthermore, most analysts prefer companies that are developing treatments as opposed to vaccines. Treatment drugs are used continuously and repeatedly, whereas vaccines are a one-time shot and are not nearly as lucrative from a financial perspective.
Слайд 91
Analysis Insight -2
Ideally, you want a company to have several products
in development. That way, if one does not make it through the approval process, there are other products to balance the blow. At the same time, there is a happy medium between a company being too focused, and a company having so many developing ideas and products that it loses focus and spreads itself too thin.
Next, you want to take a look at is how far the company's products are in the stages of clinical development, and how close the product is to FDA approval. All companies wishing to sell drugs and/or biotech products in the U.S. require FDA approval. If a company is relatively new at the FDA process, you can expect it to take longer for it to gain approval. It is for this reason that many small biotech companies will partner with larger, more experienced ones. The difference of one year in gaining approval can mean millions of dollars.
Слайд 92
Analysis Insight -3
As the key to any successful biotech company is
solid financing, you also must consider where the company is getting its money from. Take a look under current assets on the balance sheet; the company should have plenty of cash. By looking at the current ratio/working capital ratio you should be able to determine whether it is cash stricken. Because ratios vary wildly across different industries, compare the ratios only to those of similar companies within the biotech industry. The reason for the variation is that most biotech companies use equity financing instead of borrowing, partly because equity is cheaper and partly because many banks and creditors usually refuse to finance such high-risk ventures for which there is a gross lack of collateral.
The other question you need to answer is where the company's money is being spent. Research and development should be the answer. Most biotech firms spend a majority of their money on R&D for new products. Some believe that the more a company spends on R&D, the better the company. Even more important, however, is finding a company that does a lot of research while still controlling expenses to make the cash last for the years ahead. For companies with sales, the process is a little easier: you can look at R&D expenditures in relation to revenue, employees, or some other measure, and then compare it to similar biotech firms. This gives insight into how frugal the company is with its money.
Слайд 93

Threat of New Entrants.
Because the biotech industry is filled with lots
of small companies trying to hit the jackpot, the barriers to enter this industry are enough to scare away all but the serious companies. Biotech firms require huge amounts of funding to finance their large R&D budgets. Having ample cash is one of the biggest barriers, so when interest rates are low, or the equity markets are receptive to initial public offerings, the barriers are lower. Specialization also creates barriers. For instance, knowledge about cancer and heart disease is quite high, whereas a company focusing on something more obscure would likely have a low threat of new entrants because there are very few experts in this field.
Слайд 94
Power of Suppliers.
Biotech companies are unique because most of their value
is driven by intellectual property. The nature of their business does not force them, unlike other industries, to rely on suppliers. Scientific tools, materials, computers and testing equipment is highly specialized, but the likelihood of these companies invading on their line of business is not very high. One snag is that marketing alliances have often proved to be problematic. Small biotech firms don't have the distribution capabilities to promote their new drugs, so they are forced to license their drugs to other suppliers.
Слайд 95

Power of Buyers.
The bargaining power of customers has different levels in
the biotech arena. For example, a company that sells pharmaceutical drugs has thousands of individual customers and doesn't need to worry too much about a buyer revolt. After all, when is the last time you were able to bargain with the pharmacist for a better deal? On the other side are the biotech firms, which sell highly specialized products to governments and hospitals. These large organizations have a lot more bargaining power with biotech companies.
Слайд 96
Availability of Substitutes.
The threat of substitutes in the biotechnology field, again,
really depends on the area. While patent protection might stop the threat of alternative drugs and chemicals for a period of time, eventually there will be a company that can produce a similar product at a cheaper price. Generic drugs, for instance, are a problem: a company that spends millions of dollars on the creation of a new drug must sell it at a high price to recoup the R&D costs, but then along comes a generic drug maker, which simply copies the formula and sells it for a fraction of the cost. This is a big problem in foreign countries where there is a lack of government control. Organizations will illegally produce patent protected drugs and sell them at much lower prices
Слайд 97

Competitive Rivalry.
There are more than 1,000 biotech companies operating in North
America. With the top 1% of these companies making up a majority of the revenue, it's a tough industry in which to make a mark. The fight to see who can cure a disease or condition has researchers working day and night. Trade secrets are also extremely valuable. In short, the rivalry is extremely intense.
Слайд 98

Слайд 99
Industry structure
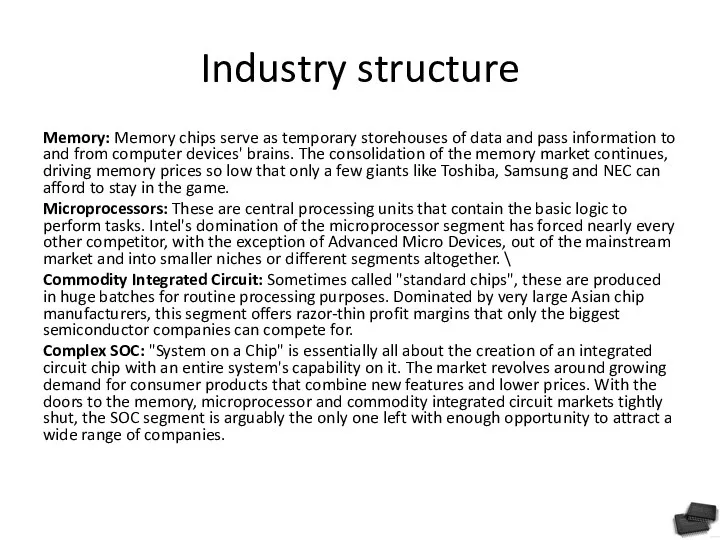
Memory: Memory chips serve as temporary storehouses of data and pass
information to and from computer devices' brains. The consolidation of the memory market continues, driving memory prices so low that only a few giants like Toshiba, Samsung and NEC can afford to stay in the game.
Microprocessors: These are central processing units that contain the basic logic to perform tasks. Intel's domination of the microprocessor segment has forced nearly every other competitor, with the exception of Advanced Micro Devices, out of the mainstream market and into smaller niches or different segments altogether. \
Commodity Integrated Circuit: Sometimes called "standard chips", these are produced in huge batches for routine processing purposes. Dominated by very large Asian chip manufacturers, this segment offers razor-thin profit margins that only the biggest semiconductor companies can compete for.
Complex SOC: "System on a Chip" is essentially all about the creation of an integrated circuit chip with an entire system's capability on it. The market revolves around growing demand for consumer products that combine new features and lower prices. With the doors to the memory, microprocessor and commodity integrated circuit markets tightly shut, the SOC segment is arguably the only one left with enough opportunity to attract a wide range of companies.
Слайд 100
Key Ratios/Terms
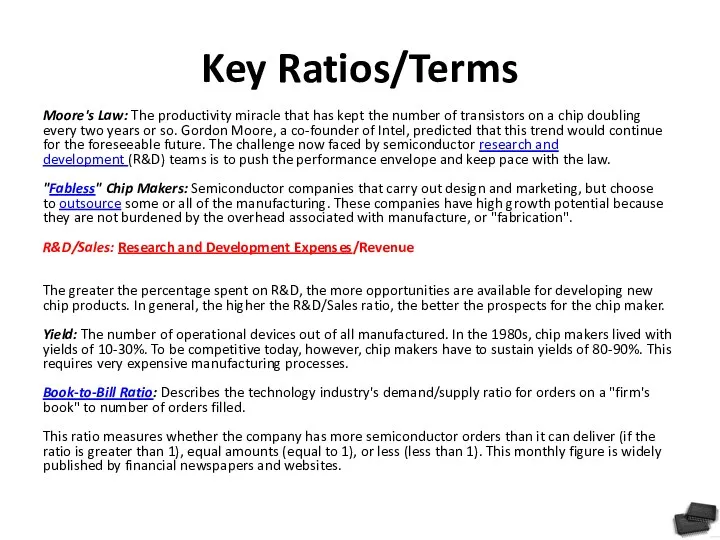
Moore's Law: The productivity miracle that has kept the number of
transistors on a chip doubling every two years or so. Gordon Moore, a co-founder of Intel, predicted that this trend would continue for the foreseeable future. The challenge now faced by semiconductor research and development (R&D) teams is to push the performance envelope and keep pace with the law.
"Fabless" Chip Makers: Semiconductor companies that carry out design and marketing, but choose to outsource some or all of the manufacturing. These companies have high growth potential because they are not burdened by the overhead associated with manufacture, or "fabrication".
R&D/Sales: Research and Development Expenses/Revenue
The greater the percentage spent on R&D, the more opportunities are available for developing new chip products. In general, the higher the R&D/Sales ratio, the better the prospects for the chip maker.
Yield: The number of operational devices out of all manufactured. In the 1980s, chip makers lived with yields of 10-30%. To be competitive today, however, chip makers have to sustain yields of 80-90%. This requires very expensive manufacturing processes.
Book-to-Bill Ratio: Describes the technology industry's demand/supply ratio for orders on a "firm's book" to number of orders filled.
This ratio measures whether the company has more semiconductor orders than it can deliver (if the ratio is greater than 1), equal amounts (equal to 1), or less (less than 1). This monthly figure is widely published by financial newspapers and websites.
Слайд 101
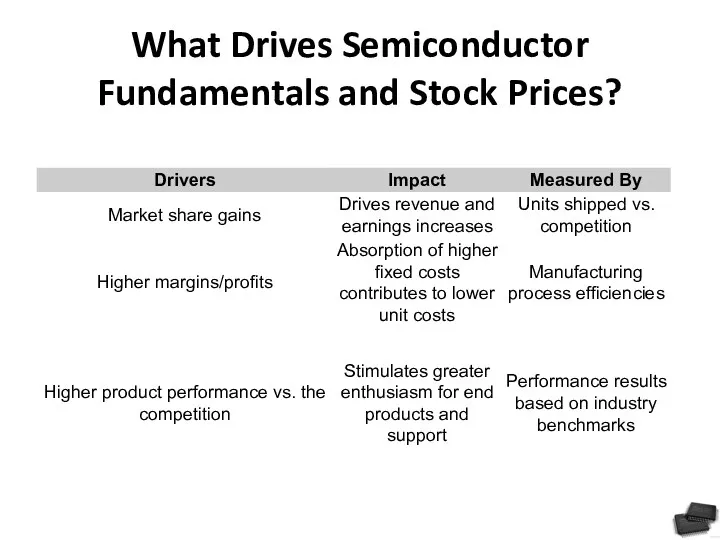
What Drives Semiconductor Fundamentals and Stock Prices?
Слайд 102
Слайд 103

Threat of New Entrants.
In the early days of the semiconductors industry,
design engineers with good ideas would often leave one company to start up another. As the industry matures, however, setting up a chip fabrication factory requires billions of dollars in investment. The cost of entry makes it painful or even impossible for all but the biggest players to keep up with state-of-the-art operations. It comes as no surprise, then, that established players have had a big advantage. Regardless, there are signs that things could be changing yet again. Semiconductor companies are forming alliances to spread out the costs of manufacturing. Meanwhile, the appearance and success of "fabless" chip makers suggests that factory ownership may not last as a barrier to entry.
Слайд 104
Power of Suppliers.
For the large semiconductor companies, suppliers have little power
- many semiconductor companies have hundreds of suppliers. This diffusion of risk over many companies allows the chip giant to keep the bargaining power of any one supplier to a minimum. However, with production getting hugely expensive, many smaller chip makers are becoming increasingly dependent on a handful of large foundries. As the suppliers of cutting-edge equipment and production skills, merchant foundries enjoy considerable industry bargaining power. The largest U.S.-based foundry belongs to none other than IBM – which is also a top chip maker in its own right.
Слайд 105
Power of Buyers.
Most of the industry's key segments are dominated by
a small number of large players. This means that buyers have little bargaining power.
Слайд 106
Availability of Substitutes.
The threat of substitutes in the semiconductors industry really
depends on the segment. While intellectual property protection might stop the threat of new substitute chips for a period of time, within a short period of time companies start to produce similar products at lower prices. Copy-cat suppliers are a problem: a company that spends millions, if not billions, of dollars on the creation of a faster, more reliable chip will strive to recoup the R&D costs. But then along comes a player that reverse engineers the system and markets a similar product for a fraction of the price.
Слайд 107
Competitive Rivalry.
The industry is marked by intense rivalries between individual companies.
There is always pressure on chip makers to come up with something better, faster and cheaper than what redefined the state-of-the-art only a few months before. That pressure extends to chip makers, foundries, design labs and distributors – everyone connected to the business of bringing chips from R&D into high-tech equipment. The result is an industry that continually produces cutting-edge technology while riding volatile business conditions.
Слайд 108
Слайд 109

Слайд 110

Слайд 111

Слайд 112

Слайд 113

Слайд 114

Слайд 115

Слайд 116

Слайд 117

Слайд 118

Слайд 119
Threat of New Entrants.
The average entrepreneur can't come along and
start a large insurance company. The threat of new entrants lies within the insurance industry itself. Some companies have carved out niche areas in which they underwrite insurance. These insurance companies are fearful of being squeezed out by the big players. Another threat for many insurance companies is other financial services companies entering the market. What would it take for a bank or investment bank to start offering insurance products? In some countries, only regulations that prevent banks and other financial firms from entering the industry. If those barriers were ever broken down, like they were in the U.S. with the Gramm-Leach-Bliley Act of 1999, you can be sure that the floodgates will open.
Слайд 120
Power of Suppliers.
The suppliers of capital might not pose a
big threat, but the threat of suppliers luring away human capital does. If a talented insurance underwriter is working for a smaller insurance company (or one in a niche industry), there is the chance that person will be enticed away by larger companies looking to move into a particular market.
Слайд 121
Power of Buyers.
The individual doesn't pose much of a threat
to the insurance industry. Large corporate clients have a lot more bargaining power with insurance companies. Large corporate clients like airlines and pharmaceutical companies pay millions of dollars a year in premiums. Insurance companies try extremely hard to get high-margin corporate clients.
Слайд 122
Availability of Substitutes.
This one is pretty straight forward, for there
are plenty of substitutes in the insurance industry. Most large insurance companies offer similar suites of services. Whether it is auto, home, commercial, health or life insurance, chances are there are competitors that can offer similar services. In some areas of insurance, however, the availability of substitutes are few and far between. Companies focusing on niche areas usually have a competitive advantage, but this advantage depends entirely on the size of the niche and on whether there are any barriers preventing other firms from entering.

 Социальная политика государства (8 класс)
 Сущность и функции финансов
 Кредитование. Классификация банковских кредитов
 Сведения о страховом стаже. Форма ЕФС -1 и порядок ее заполнения
 Пенсионный фонд России (ПФР)
 Организация налично –денежного обращения
 Принципы международного налогообложения
 Пути повышения рентабельности производства продукции на предприятии (на примере ООО Альфамит)
 Финансовая грамотность. 10 класс
 Расчет и оплата экологического сбора
 Механизмы снижения риска. Диверсификация
 Международные лизинговые операции
 Фінансовий облік інших необоротних матеріальних активів та нематеріальних активів
 Самозанятость. Критерии и особенности
 Теоретические основы страхования по КАСКО
 Международные стандарты финансовой отчетности МСФО (IAS) 24 Раскрытие информации о связанных сторонах
 Социальный предприниматель
 Money loves to be counted…
 T2_L10
 Ogólne zasady stosowania ustawy o dyscyplinie finansów publicznyc
 Audit report. The Evai token contract
 Происхождение и суть денег
 Этапы постановки системы бюджетирования
 Фінансовий облік запасів. (Тема 7)
 Персонал и оплата труда на предприятии
 Характеристика финансовых институтов, как объекта оценки. (Лекция 1)
 Финансирование здравоохранения. Лекция № 4
 Налоги с физических лиц