- Introduction to Risk, Return, and the Opportunity Cost of Capital

Содержание
- 2. Topics Covered 75 Years of Capital Market History Measuring Risk Portfolio Risk Beta and Unique Risk
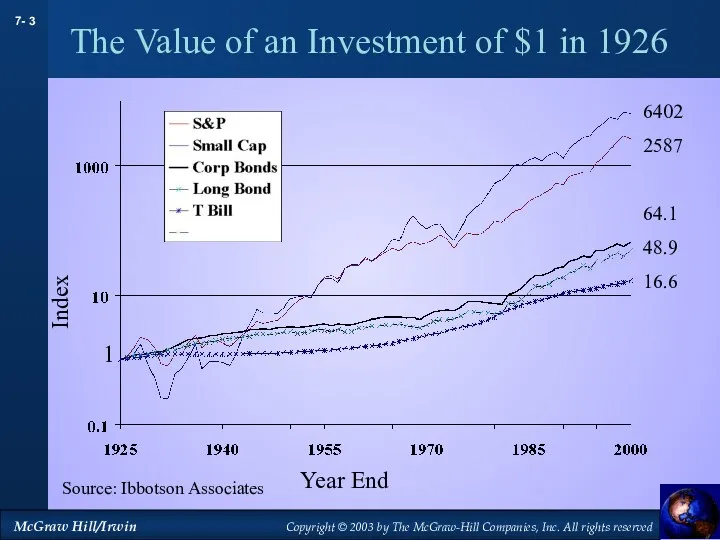
- 3. The Value of an Investment of $1 in 1926 Source: Ibbotson Associates Index Year End 1
- 4. Source: Ibbotson Associates Index Year End 1 660 267 6.6 5.0 1.7 Real returns The Value
- 5. Rates of Return 1926-2000 Source: Ibbotson Associates Year Percentage Return
- 6. Average Market Risk Premia (1999-2000) Risk premium, % Country
- 7. Measuring Risk Variance - Average value of squared deviations from mean. A measure of volatility. Standard
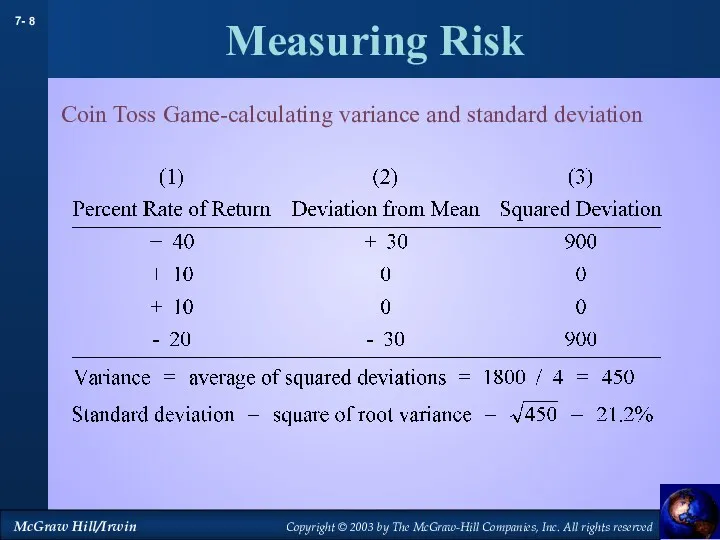
- 8. Measuring Risk Coin Toss Game-calculating variance and standard deviation
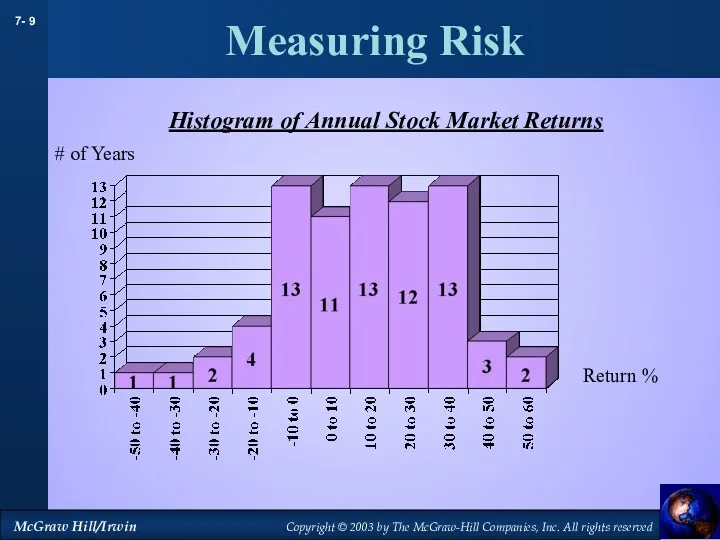
- 9. Measuring Risk Return % # of Years Histogram of Annual Stock Market Returns
- 10. Measuring Risk Diversification - Strategy designed to reduce risk by spreading the portfolio across many investments.
- 11. Measuring Risk
- 12. Measuring Risk
- 13. Measuring Risk
- 14. Portfolio Risk The variance of a two stock portfolio is the sum of these four boxes
- 15. Portfolio Risk Example Suppose you invest 65% of your portfolio in Coca-Cola and 35% in Reebok.
- 16. Portfolio Risk Example Suppose you invest 65% of your portfolio in Coca-Cola and 35% in Reebok.
- 17. Portfolio Risk Example Suppose you invest 65% of your portfolio in Coca-Cola and 35% in Reebok.
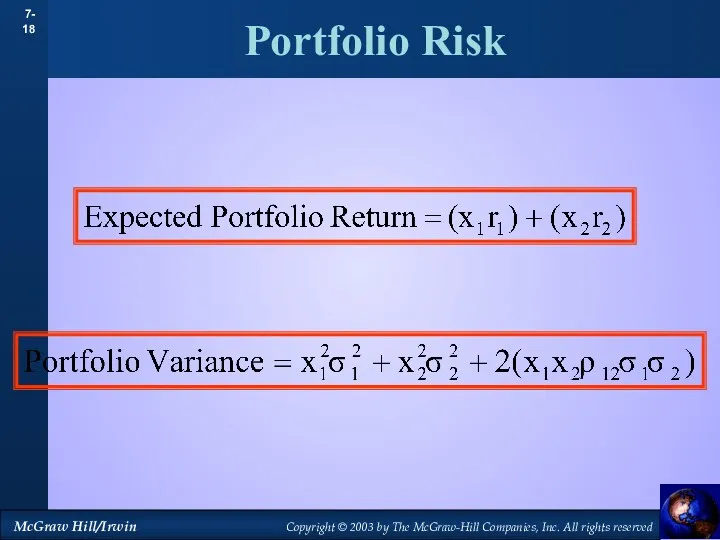
- 18. Portfolio Risk
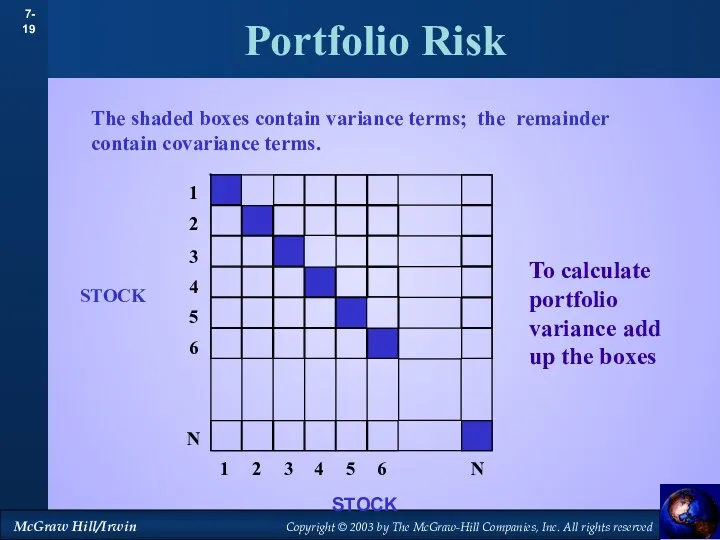
- 19. Portfolio Risk The shaded boxes contain variance terms; the remainder contain covariance terms. STOCK STOCK To
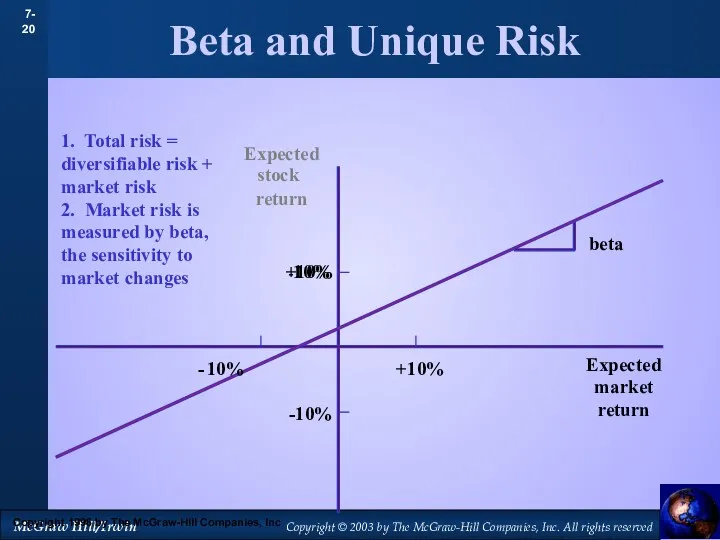
- 20. Beta and Unique Risk 1. Total risk = diversifiable risk + market risk 2. Market risk
- 21. Beta and Unique Risk Market Portfolio - Portfolio of all assets in the economy. In practice
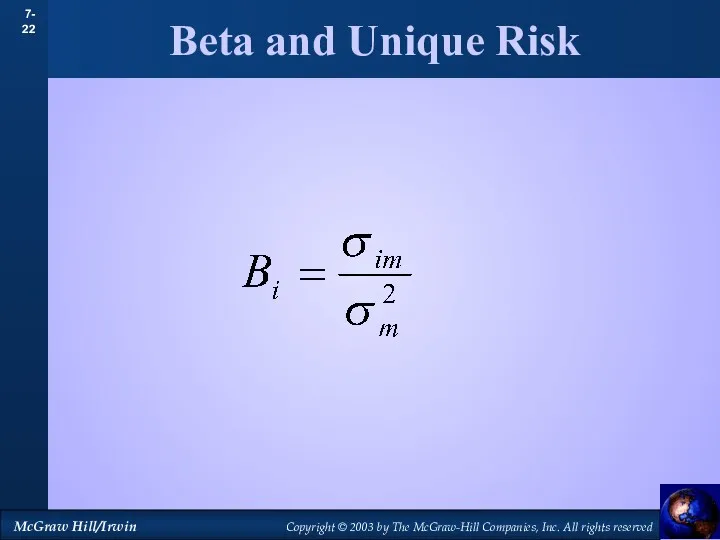
- 22. Beta and Unique Risk
- 24. Скачать презентацию
Topics Covered
75 Years of Capital Market History
Measuring Risk
Portfolio Risk
Beta and Unique
Topics Covered
75 Years of Capital Market History
Measuring Risk
Portfolio Risk
Beta and Unique
The Value of an Investment of $1 in 1926
Source: Ibbotson Associates
Index
Year
The Value of an Investment of $1 in 1926
Source: Ibbotson Associates
Index
Year
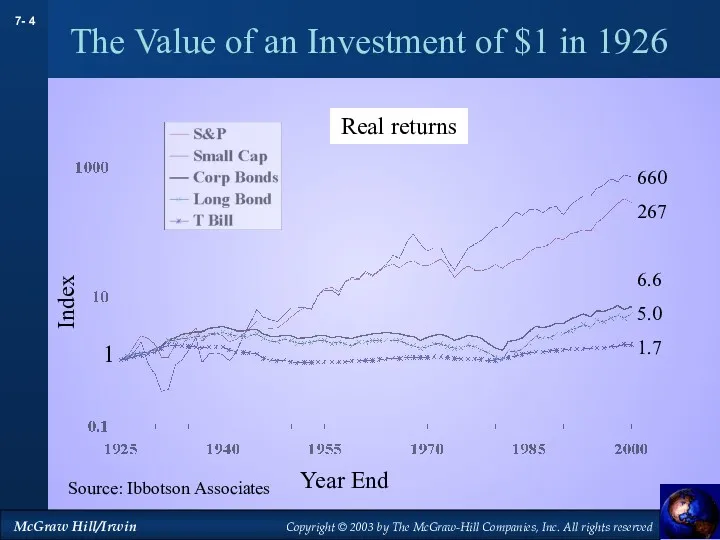
Source: Ibbotson Associates
Index
Year End
1
660
267
6.6
5.0
1.7
Real returns
The Value of an Investment of $1
Source: Ibbotson Associates
Index
Year End
1
660
267
6.6
5.0
1.7
Real returns
The Value of an Investment of $1
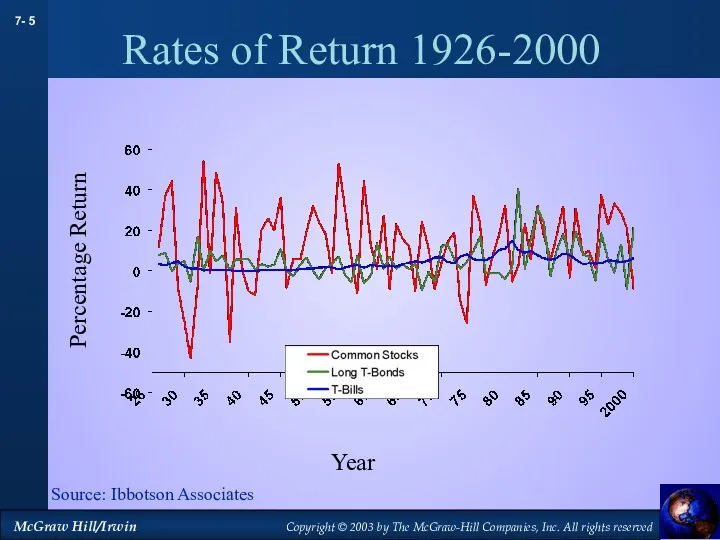
Rates of Return 1926-2000
Source: Ibbotson Associates
Year
Percentage Return
Rates of Return 1926-2000
Source: Ibbotson Associates
Year
Percentage Return
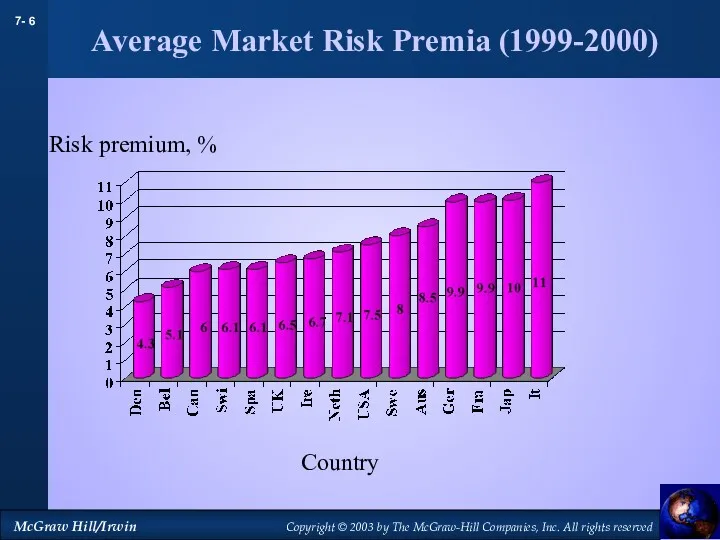
Average Market Risk Premia (1999-2000)
Risk premium, %
Country
Average Market Risk Premia (1999-2000)
Risk premium, %
Country
Measuring Risk
Variance - Average value of squared deviations from mean. A
Measuring Risk
Variance - Average value of squared deviations from mean. A
Measuring Risk
Coin Toss Game-calculating variance and standard deviation
Measuring Risk
Coin Toss Game-calculating variance and standard deviation
Measuring Risk
Return %
# of Years
Histogram of Annual Stock Market Returns
Measuring Risk
Return %
# of Years
Histogram of Annual Stock Market Returns
Measuring Risk
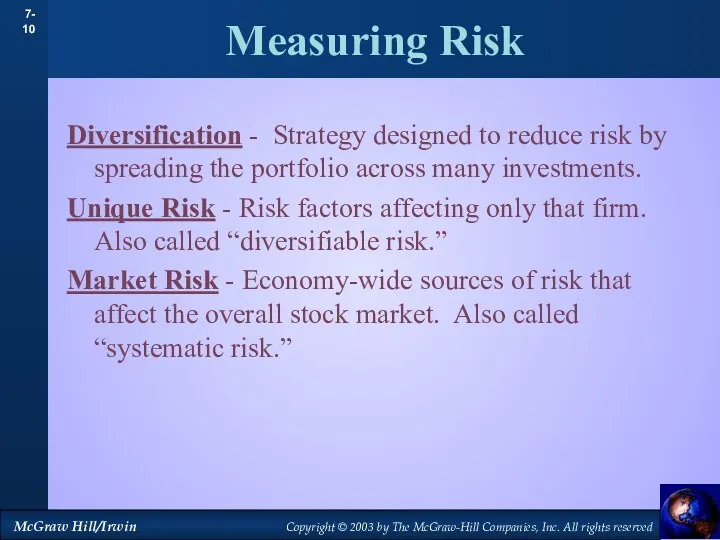
Diversification - Strategy designed to reduce risk by spreading the
Measuring Risk
Diversification - Strategy designed to reduce risk by spreading the
Measuring Risk
Measuring Risk
Measuring Risk
Measuring Risk
Measuring Risk
Measuring Risk
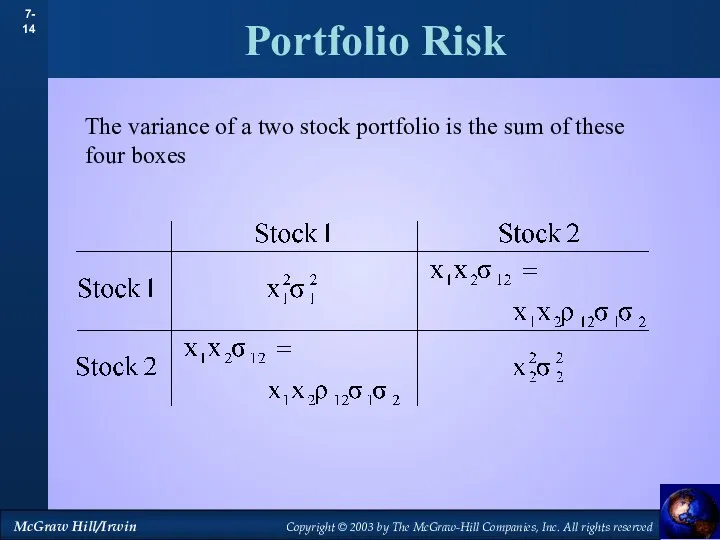
Portfolio Risk
The variance of a two stock portfolio is the sum
Portfolio Risk
The variance of a two stock portfolio is the sum
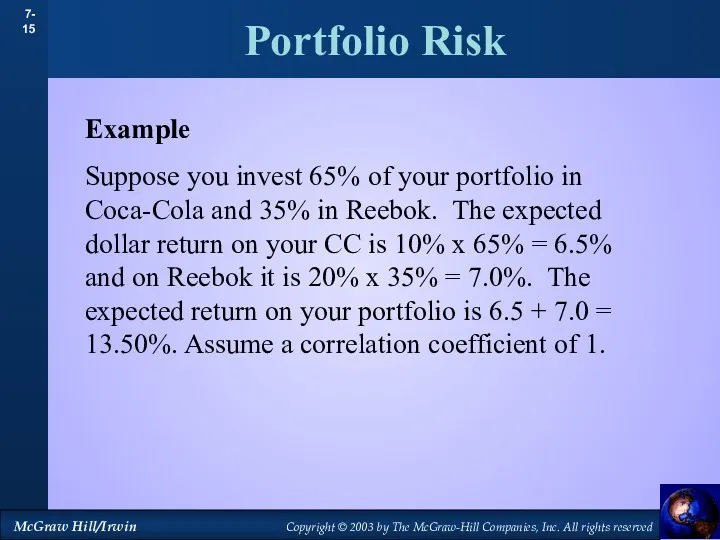
Portfolio Risk
Example
Suppose you invest 65% of your portfolio in Coca-Cola
Portfolio Risk
Example
Suppose you invest 65% of your portfolio in Coca-Cola
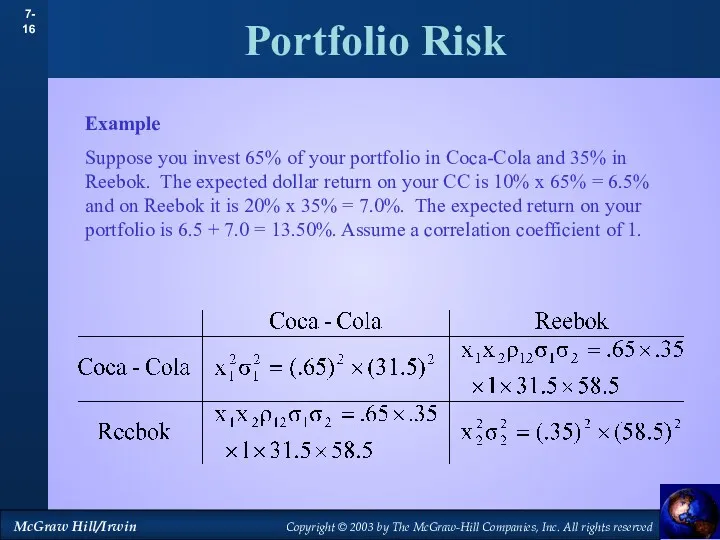
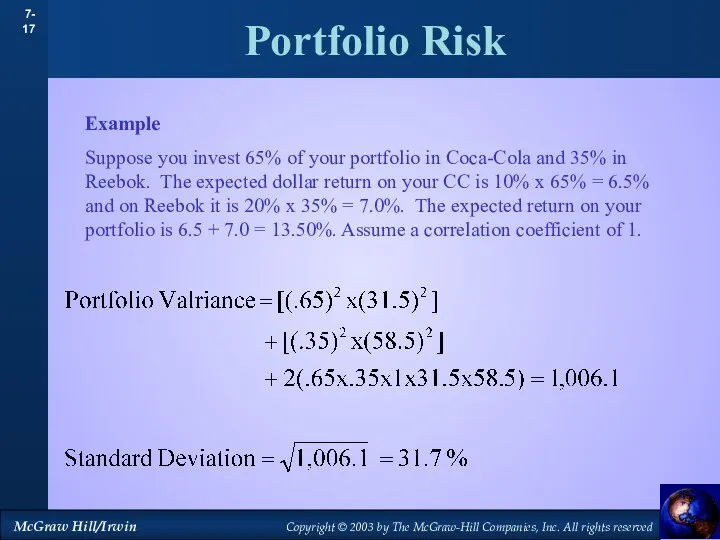
Portfolio Risk
Example
Suppose you invest 65% of your portfolio in Coca-Cola
Portfolio Risk
Example
Suppose you invest 65% of your portfolio in Coca-Cola
Portfolio Risk
Example
Suppose you invest 65% of your portfolio in Coca-Cola
Portfolio Risk
Example
Suppose you invest 65% of your portfolio in Coca-Cola
Portfolio Risk
Portfolio Risk
Portfolio Risk
The shaded boxes contain variance terms; the remainder contain covariance
Portfolio Risk
The shaded boxes contain variance terms; the remainder contain covariance
Beta and Unique Risk
1. Total risk = diversifiable risk + market
Beta and Unique Risk
1. Total risk = diversifiable risk + market
Beta and Unique Risk
Market Portfolio - Portfolio of all assets in
Beta and Unique Risk
Market Portfolio - Portfolio of all assets in
Beta and Unique Risk
Beta and Unique Risk
 Банківська система
 Қазіргі жағдайда коммерциялық банктердің қаржылық тұрақтылығын жүйелі талдау
 Учет материалов организации
 Бюджетные кредиты
 Финансовая среда предпринимательства и предпринимательские риски
 Новый механизм оказания адресной социальной помощи с 1 января 2020 года
 Финансовый анализ положения компании Вимм-БильДанн
 Себестоимость продукции
 Государственный бюджет
 Финансовое планирование и прогнозирование. Бюджетирование
 Тема 2. Инвестиционный климат предприятия и его оценка
 Принципы международного налогообложения
 Инструменты и методы бережливого производства
 Решение задач распознавания образов нейросетями
 Фондовый рынок и биржевые инструменты
 Қысқа мерзімдегі фирманың шығындар
 Как найти средства на научное исследование: гранты, субсидии и спонсоры
 Нематериальные активы
 Электрические сети и передача электрической энергии. Государственное регулирование в сфере электроэнергетики. Лекция 7-8
 Правовые основы социальной защиты и социального обеспечения
 Державне регулювання ринків фінансових послуг. Фінансові компанії
 Прогноз значения курса доллара США по состоянию на 20 мая
 Банковские услуги и отношения людей с банками
 Оборотный капитал корпорации и краткосрочное финансирование
 Бухгалтерский учет материалов
 Понятие монополистической деятельности на товарных рынках
 Vērtspapīri
 Крупнейшие инвестиционные проекты России в сфере туризма