- Risk and Return

Содержание
- 2. Topics Covered Markowitz Portfolio Theory Risk and Return Relationship Testing the CAPM CAPM Alternatives
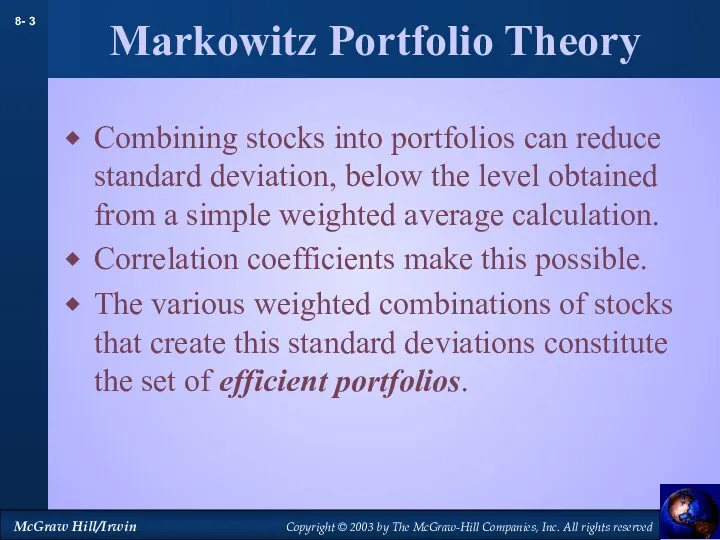
- 3. Markowitz Portfolio Theory Combining stocks into portfolios can reduce standard deviation, below the level obtained from
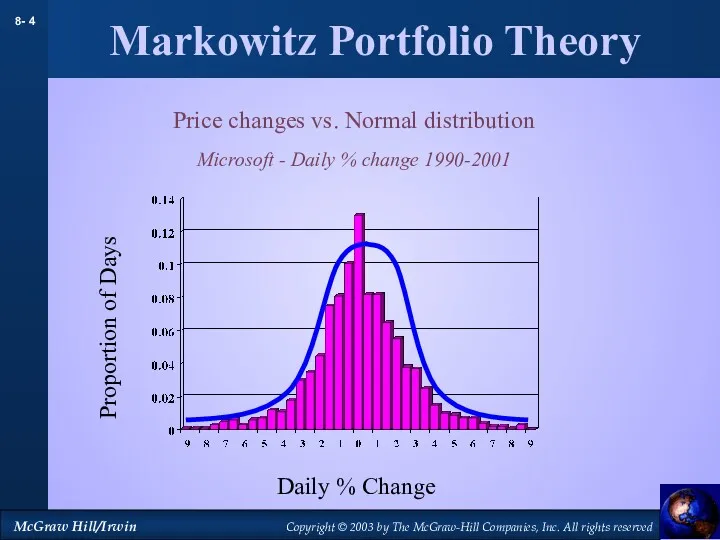
- 4. Markowitz Portfolio Theory Price changes vs. Normal distribution Microsoft - Daily % change 1990-2001 Proportion of
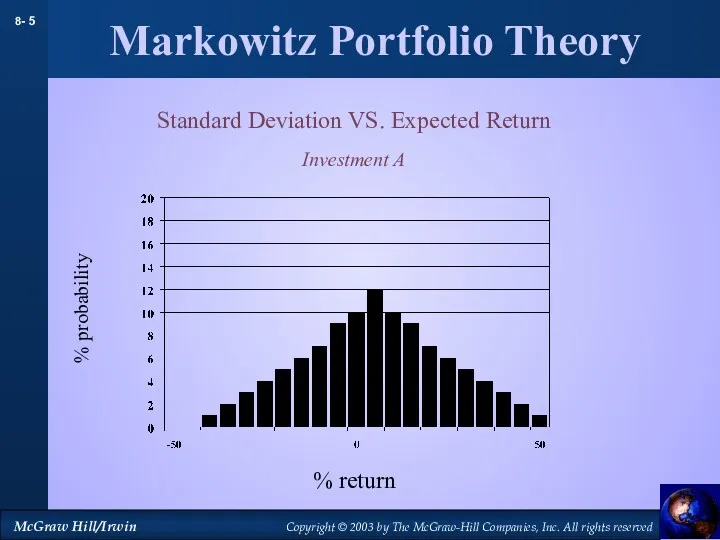
- 5. Markowitz Portfolio Theory Standard Deviation VS. Expected Return Investment A % probability % return
- 6. Markowitz Portfolio Theory Standard Deviation VS. Expected Return Investment B % probability % return
- 7. Markowitz Portfolio Theory Standard Deviation VS. Expected Return Investment C % probability % return
- 8. Markowitz Portfolio Theory Standard Deviation VS. Expected Return Investment D % probability % return
- 9. Markowitz Portfolio Theory Coca Cola Reebok Standard Deviation Expected Return (%) 35% in Reebok Expected Returns
- 10. Efficient Frontier Standard Deviation Expected Return (%) Each half egg shell represents the possible weighted combinations
- 11. Efficient Frontier Standard Deviation Expected Return (%) Lending or Borrowing at the risk free rate (rf)
- 12. Efficient Frontier Example Correlation Coefficient = .4 Stocks σ % of Portfolio Avg Return ABC Corp
- 13. Efficient Frontier Example Correlation Coefficient = .4 Stocks σ % of Portfolio Avg Return ABC Corp
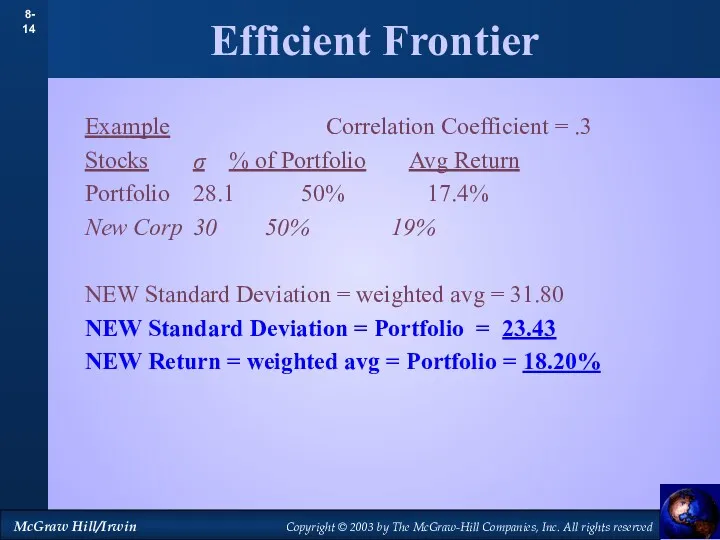
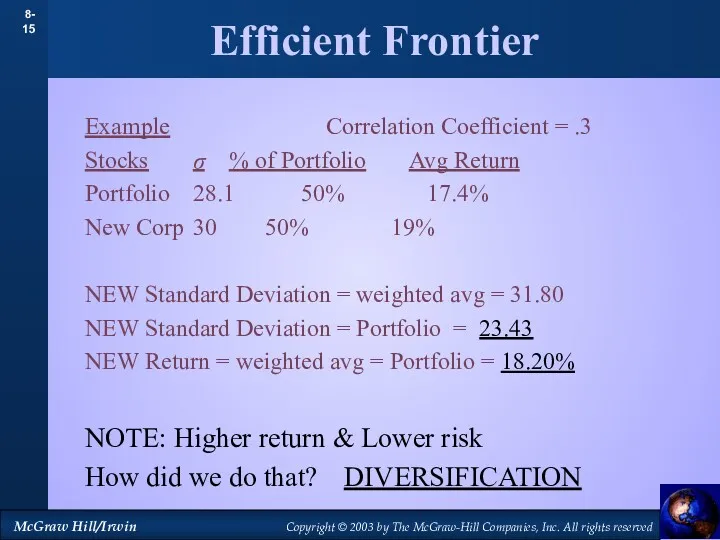
- 14. Efficient Frontier Example Correlation Coefficient = .3 Stocks σ % of Portfolio Avg Return Portfolio 28.1
- 15. Efficient Frontier Example Correlation Coefficient = .3 Stocks σ % of Portfolio Avg Return Portfolio 28.1
- 16. Efficient Frontier A B Return Risk (measured as σ)
- 17. Efficient Frontier A B Return Risk AB
- 18. Efficient Frontier A B N Return Risk AB
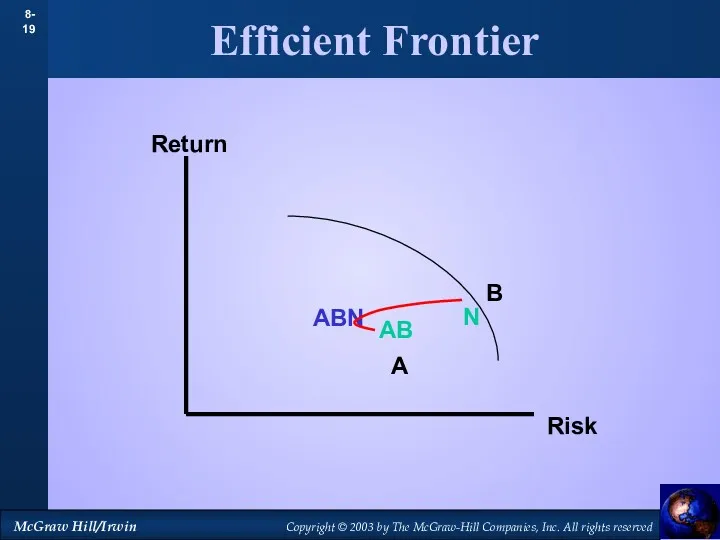
- 19. Efficient Frontier A B N Return Risk AB ABN
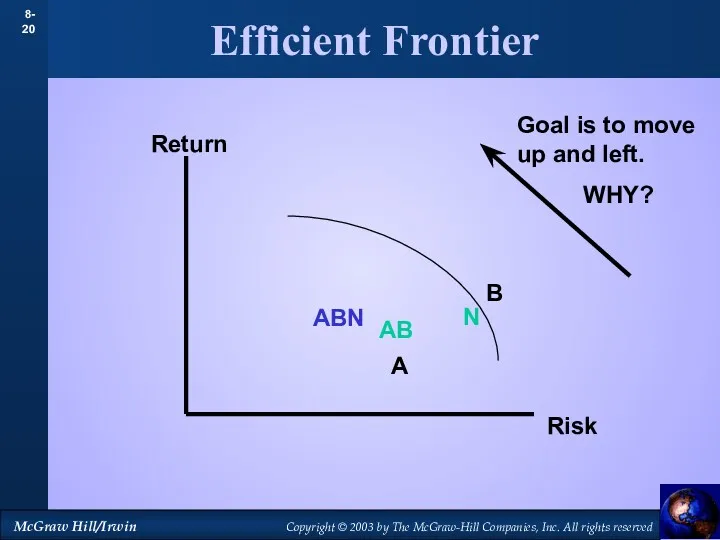
- 20. Efficient Frontier A B N Return Risk AB Goal is to move up and left. WHY?
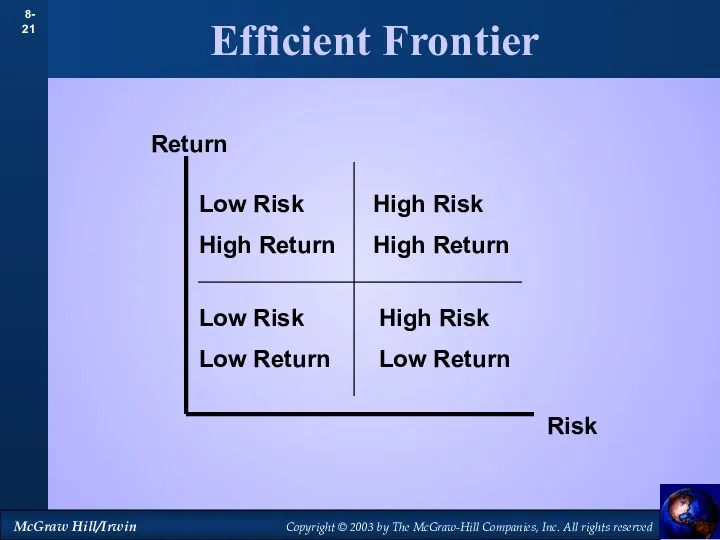
- 21. Efficient Frontier Return Risk Low Risk High Return High Risk High Return Low Risk Low Return
- 22. Efficient Frontier Return Risk Low Risk High Return High Risk High Return Low Risk Low Return
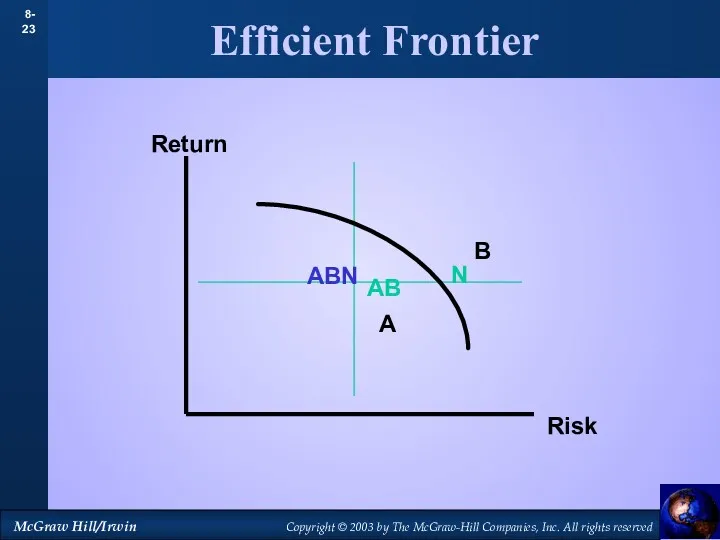
- 23. Efficient Frontier Return Risk A B N AB ABN
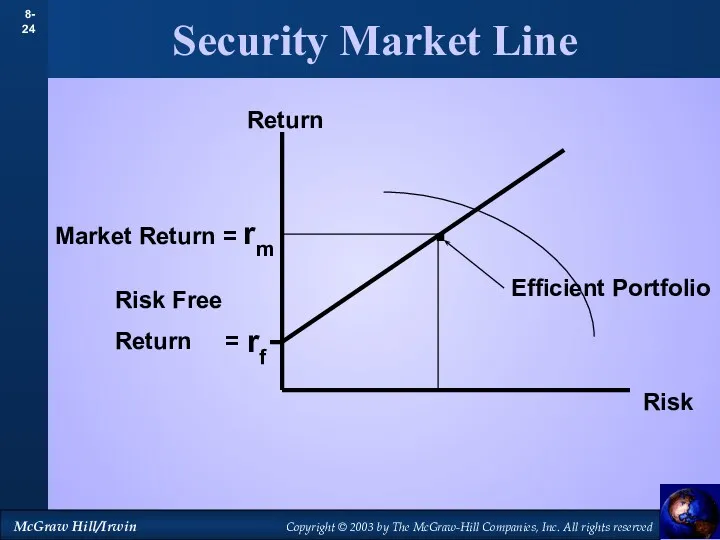
- 24. Security Market Line Return Risk . rf Risk Free Return = Efficient Portfolio
- 25. Security Market Line Return . rf Risk Free Return = Efficient Portfolio BETA 1.0
- 26. Security Market Line Return . rf Risk Free Return = BETA Security Market Line (SML)
- 27. Security Market Line Return BETA rf 1.0 SML SML Equation = rf + B ( rm
- 28. Capital Asset Pricing Model R = rf + B ( rm - rf ) CAPM
- 29. Testing the CAPM Avg Risk Premium 1931-65 Portfolio Beta 1.0 SML 30 20 10 0 Investors
- 30. Testing the CAPM Avg Risk Premium 1966-91 Portfolio Beta 1.0 SML 30 20 10 0 Investors
- 31. Testing the CAPM High-minus low book-to-market Return vs. Book-to-Market Dollars Low minus big http://mba.tuck.dartmouth.edu/pages/faculty/ken.french/data_library.html
- 32. Consumption Betas vs Market Betas Stocks (and other risky assets) Wealth = market portfolio
- 33. Arbitrage Pricing Theory Alternative to CAPM Expected Risk Premium = r - rf = Bfactor1(rfactor1 -
- 35. Скачать презентацию
Topics Covered
Markowitz Portfolio Theory
Risk and Return Relationship
Testing the CAPM
CAPM Alternatives
Topics Covered
Markowitz Portfolio Theory
Risk and Return Relationship
Testing the CAPM
CAPM Alternatives
Markowitz Portfolio Theory
Combining stocks into portfolios can reduce standard deviation, below
Markowitz Portfolio Theory
Combining stocks into portfolios can reduce standard deviation, below
Markowitz Portfolio Theory
Price changes vs. Normal distribution
Microsoft - Daily % change
Markowitz Portfolio Theory
Price changes vs. Normal distribution
Microsoft - Daily % change
Markowitz Portfolio Theory
Standard Deviation VS. Expected Return
Investment A
% probability
% return
Markowitz Portfolio Theory
Standard Deviation VS. Expected Return
Investment A
% probability
% return
Markowitz Portfolio Theory
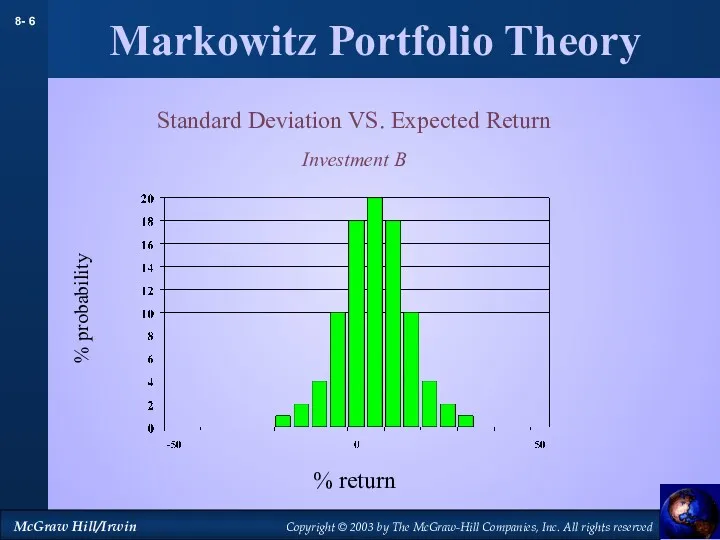
Standard Deviation VS. Expected Return
Investment B
% probability
% return
Markowitz Portfolio Theory
Standard Deviation VS. Expected Return
Investment B
% probability
% return
Markowitz Portfolio Theory
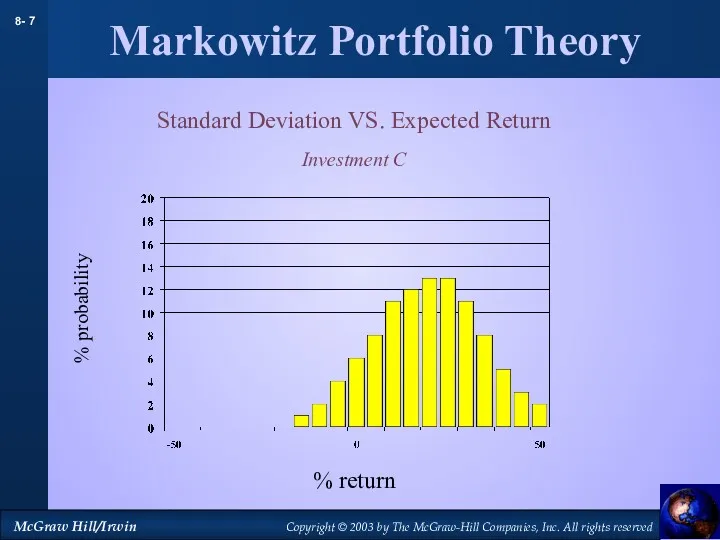
Standard Deviation VS. Expected Return
Investment C
% probability
% return
Markowitz Portfolio Theory
Standard Deviation VS. Expected Return
Investment C
% probability
% return
Markowitz Portfolio Theory
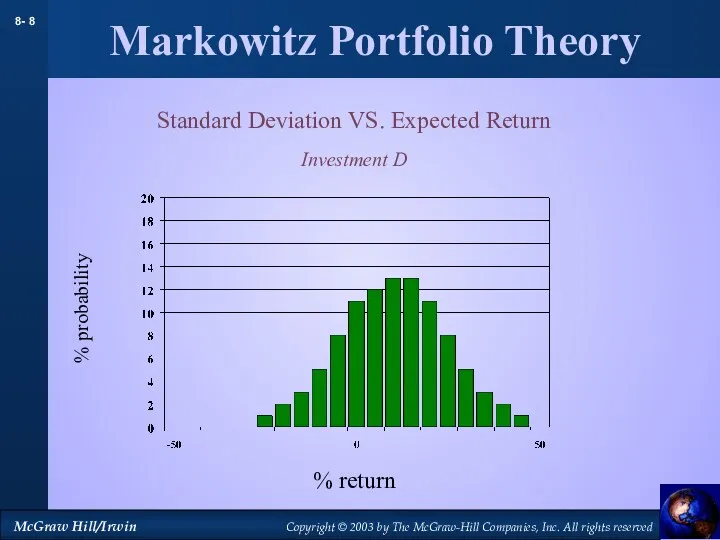
Standard Deviation VS. Expected Return
Investment D
% probability
% return
Markowitz Portfolio Theory
Standard Deviation VS. Expected Return
Investment D
% probability
% return
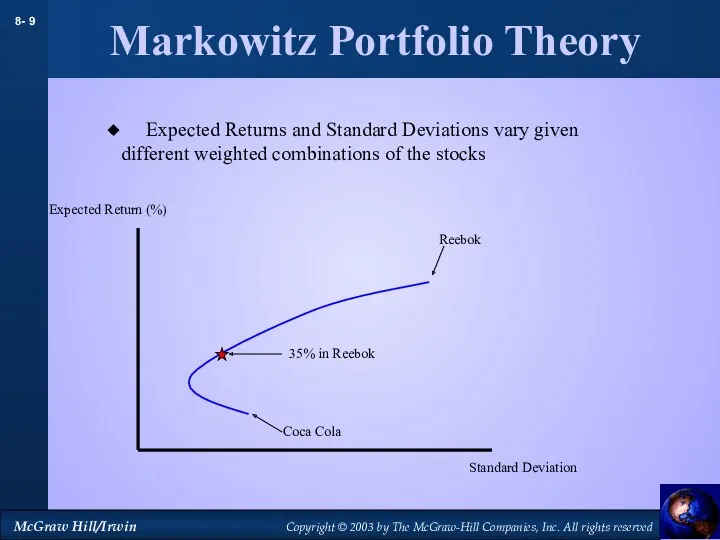
Markowitz Portfolio Theory
Coca Cola
Reebok
Standard Deviation
Expected Return (%)
35% in Reebok
Expected Returns
Markowitz Portfolio Theory
Coca Cola
Reebok
Standard Deviation
Expected Return (%)
35% in Reebok
Expected Returns
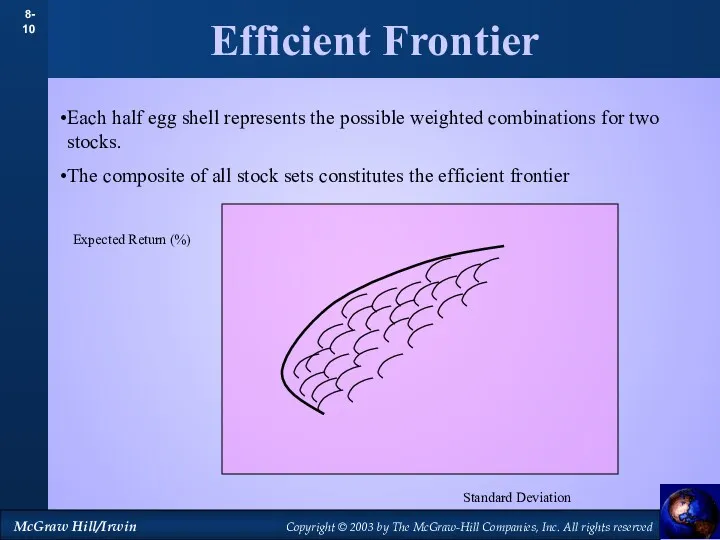
Efficient Frontier
Standard Deviation
Expected Return (%)
Each half egg shell represents the possible
Efficient Frontier
Standard Deviation
Expected Return (%)
Each half egg shell represents the possible
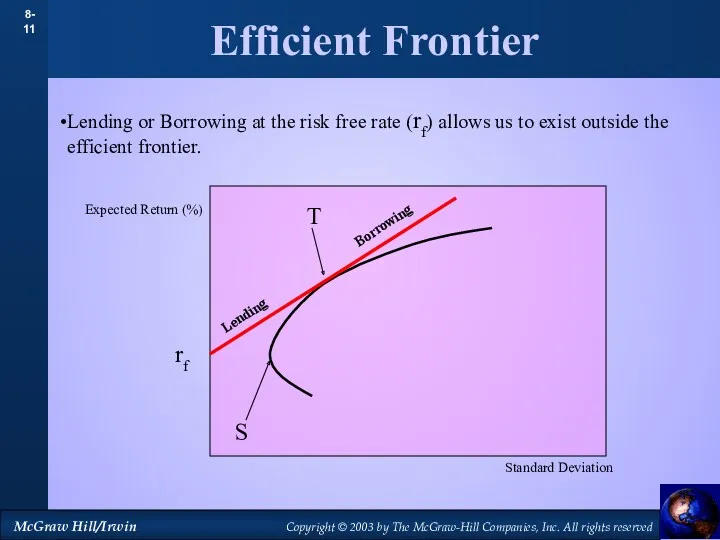
Efficient Frontier
Standard Deviation
Expected Return (%)
Lending or Borrowing at the risk free
Efficient Frontier
Standard Deviation
Expected Return (%)
Lending or Borrowing at the risk free
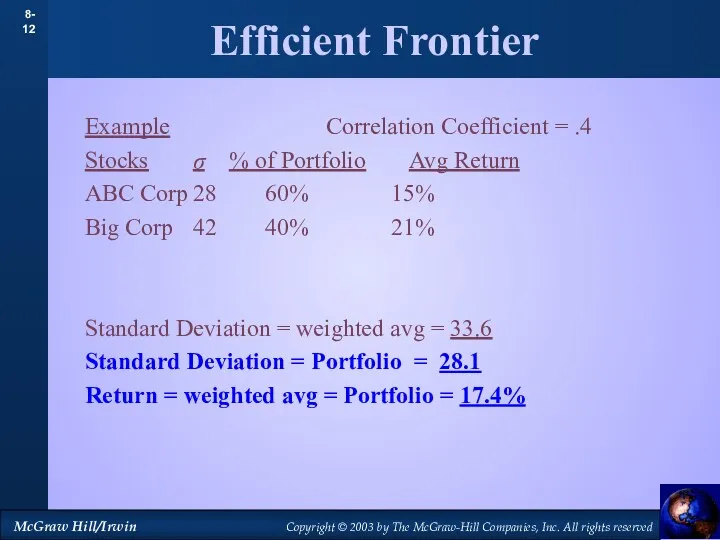
Efficient Frontier
Example Correlation Coefficient = .4
Stocks σ % of Portfolio Avg Return
ABC Corp 28 60% 15%
Big
Efficient Frontier
Example Correlation Coefficient = .4
Stocks σ % of Portfolio Avg Return
ABC Corp 28 60% 15%
Big
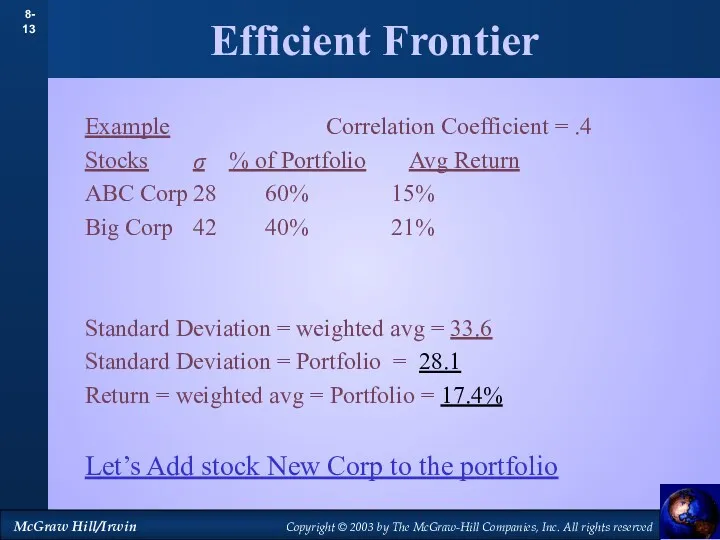
Efficient Frontier
Example Correlation Coefficient = .4
Stocks σ % of Portfolio Avg Return
ABC Corp 28 60% 15%
Big
Efficient Frontier
Example Correlation Coefficient = .4
Stocks σ % of Portfolio Avg Return
ABC Corp 28 60% 15%
Big
Efficient Frontier
Example Correlation Coefficient = .3
Stocks σ % of Portfolio Avg Return
Portfolio 28.1 50% 17.4%
New Corp 30
Efficient Frontier
Example Correlation Coefficient = .3
Stocks σ % of Portfolio Avg Return
Portfolio 28.1 50% 17.4%
New Corp 30
Efficient Frontier
Example Correlation Coefficient = .3
Stocks σ % of Portfolio Avg Return
Portfolio 28.1 50% 17.4%
New Corp 30
Efficient Frontier
Example Correlation Coefficient = .3
Stocks σ % of Portfolio Avg Return
Portfolio 28.1 50% 17.4%
New Corp 30
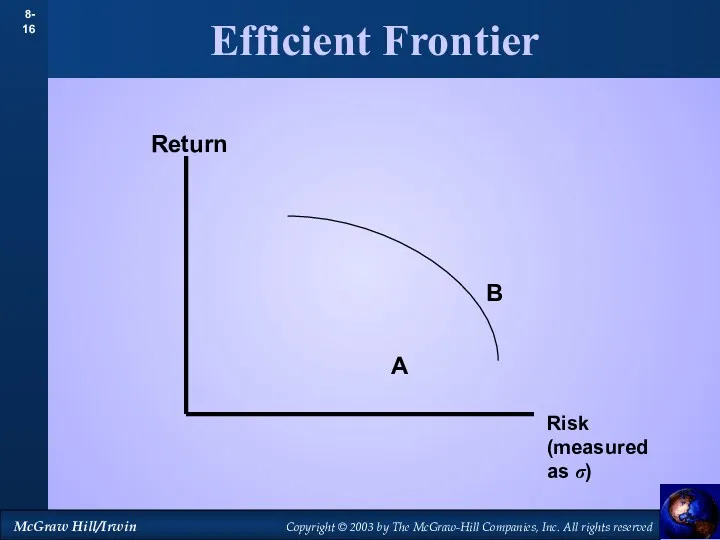
Efficient Frontier
A
B
Return
Risk (measured as σ)
Efficient Frontier
A
B
Return
Risk (measured as σ)

Efficient Frontier
A
B
Return
Risk
AB
Efficient Frontier
A
B
Return
Risk
AB
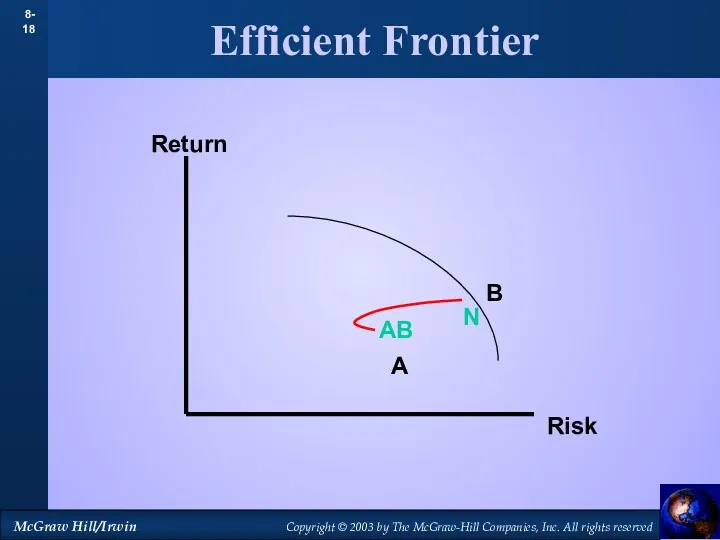
Efficient Frontier
A
B
N
Return
Risk
AB
Efficient Frontier
A
B
N
Return
Risk
AB
Efficient Frontier
A
B
N
Return
Risk
AB
ABN
Efficient Frontier
A
B
N
Return
Risk
AB
ABN
Efficient Frontier
A
B
N
Return
Risk
AB
Goal is to move up and left.
WHY?
ABN
Efficient Frontier
A
B
N
Return
Risk
AB
Goal is to move up and left.
WHY?
ABN
Efficient Frontier
Return
Risk
Low Risk
High Return
High Risk
High Return
Low Risk
Low Return
High Risk
Low Return
Efficient Frontier
Return
Risk
Low Risk
High Return
High Risk
High Return
Low Risk
Low Return
High Risk
Low Return

Efficient Frontier
Return
Risk
Low Risk
High Return
High Risk
High Return
Low Risk
Low Return
High Risk
Low Return
Efficient Frontier
Return
Risk
Low Risk
High Return
High Risk
High Return
Low Risk
Low Return
High Risk
Low Return
Efficient Frontier
Return
Risk
A
B
N
AB
ABN
Efficient Frontier
Return
Risk
A
B
N
AB
ABN
Security Market Line
Return
Risk
.
rf
Risk Free
Return =
Efficient Portfolio
Security Market Line
Return
Risk
.
rf
Risk Free
Return =
Efficient Portfolio
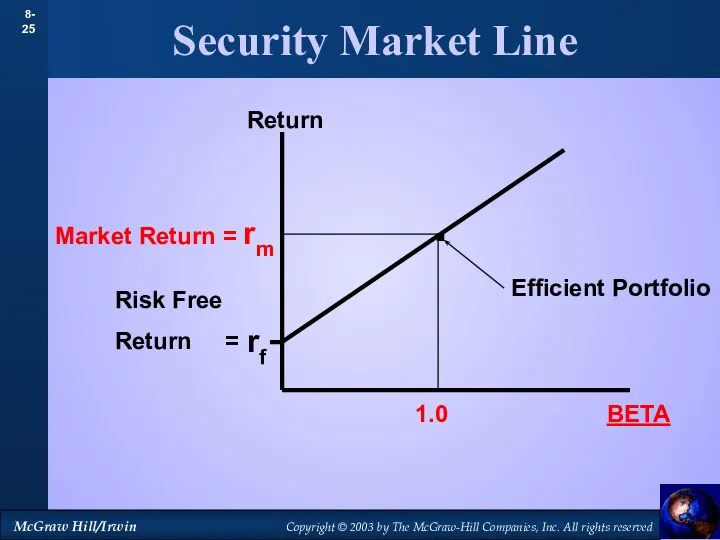
Security Market Line
Return
.
rf
Risk Free
Return =
Efficient Portfolio
BETA
1.0
Security Market Line
Return
.
rf
Risk Free
Return =
Efficient Portfolio
BETA
1.0
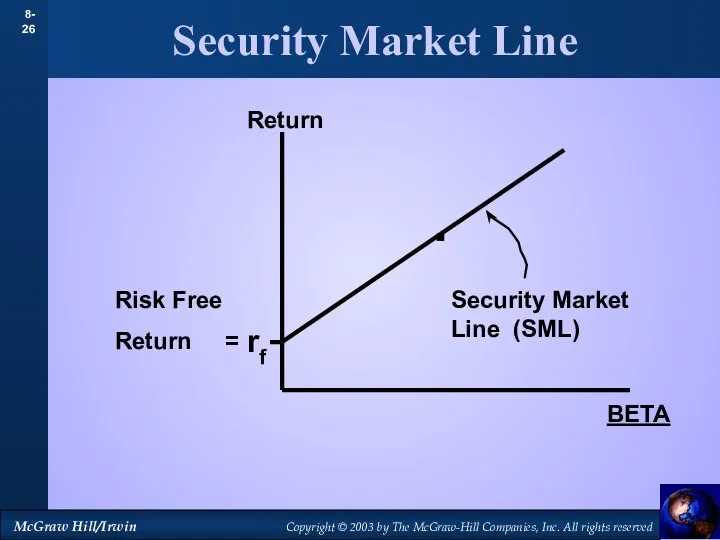
Security Market Line
Return
.
rf
Risk Free
Return =
BETA
Security Market Line (SML)
Security Market Line
Return
.
rf
Risk Free
Return =
BETA
Security Market Line (SML)
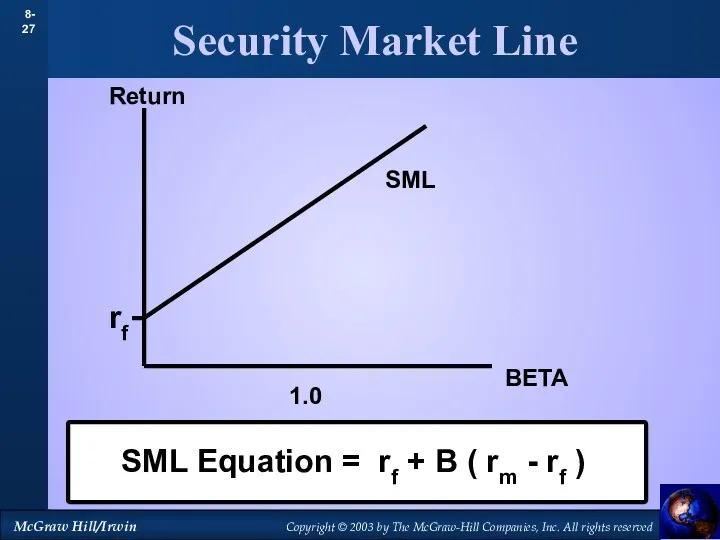
Security Market Line
Return
BETA
rf
1.0
SML
SML Equation = rf + B ( rm -
Security Market Line
Return
BETA
rf
1.0
SML
SML Equation = rf + B ( rm -
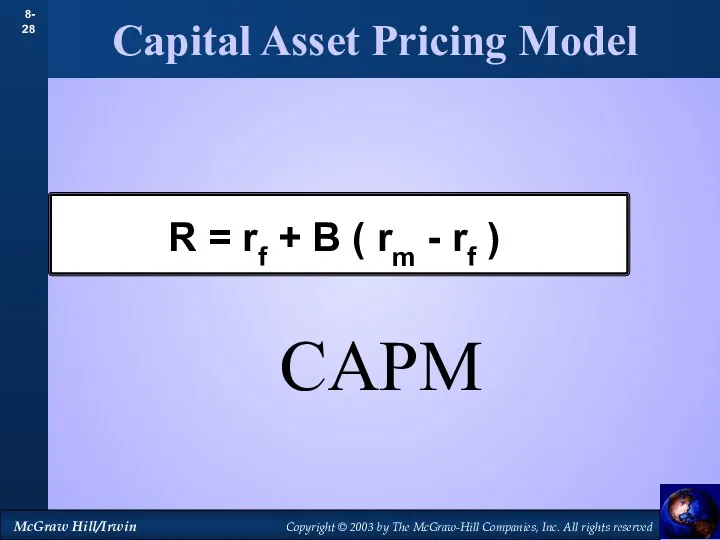
Capital Asset Pricing Model
R = rf + B ( rm
Capital Asset Pricing Model
R = rf + B ( rm
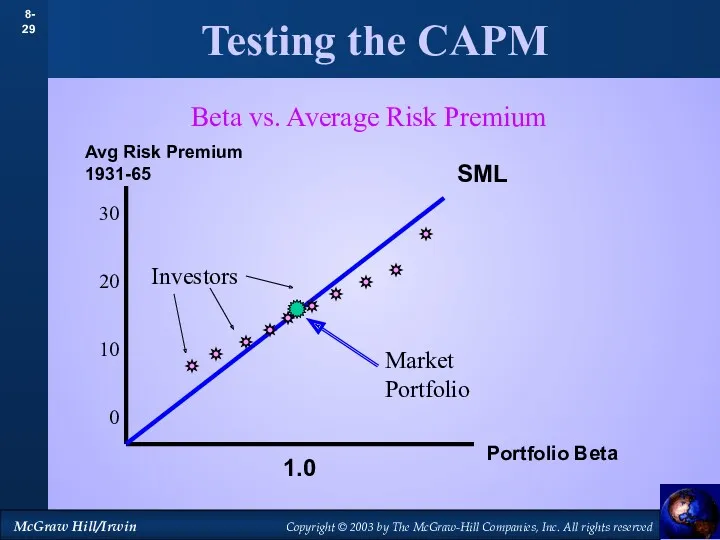
Testing the CAPM
Avg Risk Premium 1931-65
Portfolio Beta
1.0
SML
30
20
10
0
Investors
Market Portfolio
Beta vs. Average Risk
Testing the CAPM
Avg Risk Premium 1931-65
Portfolio Beta
1.0
SML
30
20
10
0
Investors
Market Portfolio
Beta vs. Average Risk
Testing the CAPM
Avg Risk Premium 1966-91
Portfolio Beta
1.0
SML
30
20
10
0
Investors
Market Portfolio
Beta vs. Average Risk
Testing the CAPM
Avg Risk Premium 1966-91
Portfolio Beta
1.0
SML
30
20
10
0
Investors
Market Portfolio
Beta vs. Average Risk
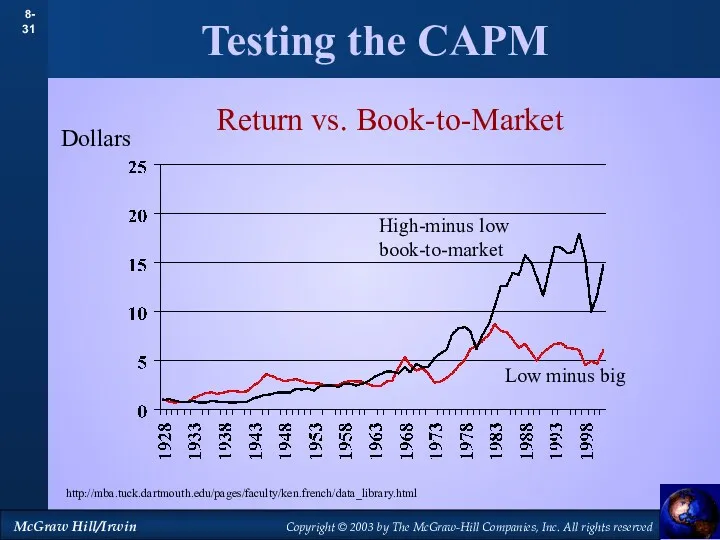
Testing the CAPM
High-minus low book-to-market
Return vs. Book-to-Market
Dollars
Low minus big
http://mba.tuck.dartmouth.edu/pages/faculty/ken.french/data_library.html
Testing the CAPM
High-minus low book-to-market
Return vs. Book-to-Market
Dollars
Low minus big
http://mba.tuck.dartmouth.edu/pages/faculty/ken.french/data_library.html
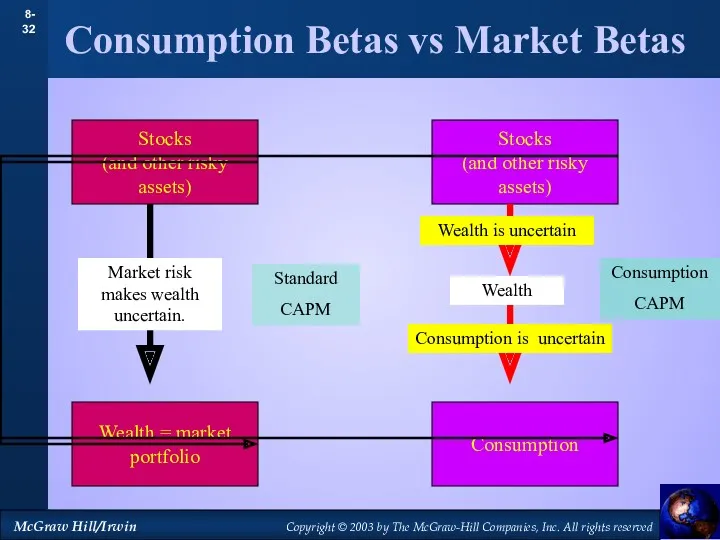
Consumption Betas vs Market Betas
Stocks
(and other risky assets)
Wealth = market
portfolio
Consumption Betas vs Market Betas
Stocks
(and other risky assets)
Wealth = market
portfolio
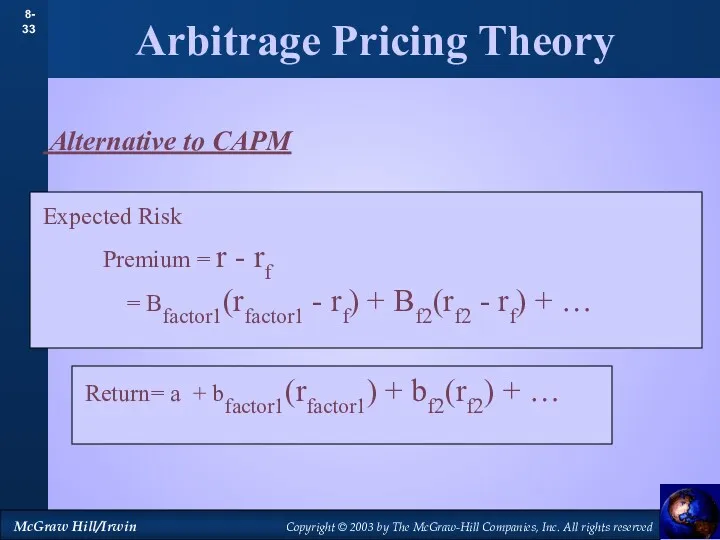
Arbitrage Pricing Theory
Alternative to CAPM
Expected Risk
Premium = r
Arbitrage Pricing Theory
Alternative to CAPM
Expected Risk
Premium = r
 Structuring. Transaction Framework
 Контрольно-кассовые машины
 Школа инвестиций НИУ-ВШЭ: программа и преимущества
 Долгосрочные внеоборотные активы
 Экологический сбор
 Базы оценки, отличные от рыночной стоимости
 Налог на доходы физических лиц
 Счета бухгалтерского учета и план счетов
 Государственные и муниципальные финансы как элемент финансово-кредитной системы
 International, national and contractual frameworks of investment protection. Class 2
 Основы организации бухгалтерского учета в кредитных организациях
 Повышенная стипендия за достижения в научно-исследовательской деятельности
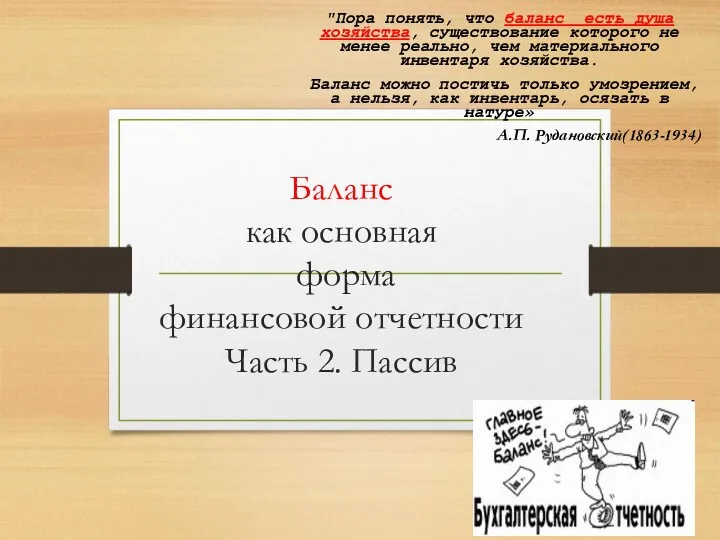 Баланс как основная форма финансовой отчетности. Часть 2. Пассив
 Стандарты аудиторской деятельности, регулирующие форму, содержание, предоставление аудиторского заключения
 Доллар США
 Введение налога на профессиональный доход для самозанятых граждан
 Земельный налог
 Организация бюджетного процесса в поселении. (Тема 4.6)
 Бухгалтерская (финансовая) отчетность
 Эмиссия ценных бумаг. (Тема 6)
 Финансовая система, характеристика звеньев. Тема 4
 Сметное дело. Методы составления смет и сметной документации. (Лекция 11)
 Эволюция мировой валютной системы и современные валютные проблемы. Лекция 3
 Финансовая работа в первичной профсоюзной организации
 Поддержка малого и среднего предпринимательства в Московской области в 2018 году
 Государственный бюджет. Тест №50. 3 класс
 Изменения в налоговом законодательстве с 2023 года: Введение Единого налогового платежа
 Валютные курсы и эффективность экспортных и импортных операций. Страхование валютных рисков. Хеджирование