- Первичная структура, идентификация белка. Масс-спектрометрия

Содержание
- 2. План 6 лекций Методы определения размера, массы, олигомерного состояния и гидродинамических свойств белков (EM, AFM, DLS,
- 3. Стандартные аминокислоты, входящие в состав белков
- 4. Различные уровни структурной организации белков
- 5. Мы выделили и очистили рекомбинантный белок, знаем, какая должна быть его последовательность, что дальше? Как ее
- 6. Mass-spectrometry A toolkit of methods to accurately determine masses in a sample Required steps: Ionization is
- 7. Принцип метода Ионизируем молекулы, переводим ионы в газовую фазу и делим их по отношению m/z Семенюк
- 8. Способы ионизации для МС
- 9. Способы ионизации для МС ESI
- 10. Способы ионизации для МС ESI MALDI
- 11. Семенюк П.И.
- 12. Снова про разрешение…
- 14. Как посчитать массу иона, зная соседние пики m/z ? Пример
- 15. Способы разделения ионов TOF Quadrupole Ion Trap Magnetic sector Combinations are often used!
- 16. МС подходы к идентификации и характеристике белка: «прямой» и «кверх ногами» http://www.chromatographyonline.com/top-down-versus-bottom-approaches-proteomics-0
- 17. Применимость анализаторов ионов для top-down
- 18. Two types of the “bottom-up” protein identification Peptide mass fingerprinting after proteolytic digestion and comparison with
- 19. Как правило, однозарядные ионы -> тривиальное определение их массы из m/z
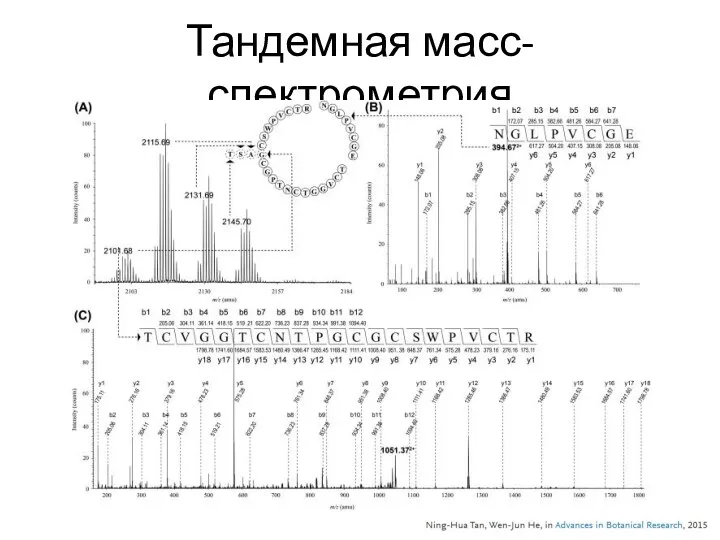
- 20. Тандемная масс-спектрометрия
- 21. Monoisotopic masses of amino acids 80Da phosphorylation Similar masses! Identical masses! Identical masses! Similar masses!
- 22. Тандемная масс-спектрометрия
- 23. MS/MS for indentifying terminal truncations in protein sequence >sp|O14558|1-160 MEIPVPVQPSWLRRASAPLPGLSAPGRLFDQRFGEGLLEAELAALCPTTLAPYYLRAPSV ALPVAQVPTDPGHFSVLLDVKHFSPEEIAVKVVGEHVEVHARHEERPDEHGFVAREFHRR YRLPPGVDPAAVTSALSPEGVLSIQAAPASAQAPPPAAAK >sp|O14558|1-160 MEIPVPVQPSWLRRASAPLPGLSAPGRLFDQRFGEGLLEAELAALCPTTLAPYYLRAPSV ALPVAQVPTDPGHFSVLLDVKHFSPEEIAVKVVGEHVEVHARHEERPDEHGFVAREFHRR YRLPPGVDPAAVTSALSPEGVLSIQAAPASAQA
- 24. MS/MS for indentifying PTMs m/z m/z MS spectrum MS/MS spectrum of the 1641 Da phosphopeptide …RSpSWRVVSSIEQK…
- 25. Конец лекции 18.11.19
- 26. Secondary structure elements α-helix β-strand Turns and loops Random coil Protein conformation is stabilized largely by
- 27. Предсказание вторичной структуры белка по его последовательности http://www.compbio.dundee.ac.uk/jpred4/index_up.html
- 28. Secondary structure prediction based on STARD1 protein sequence alpha helix ('H'), beta sheet ('E') or not
- 29. Light Spectrum
- 30. Изменение энергии молекулы (ΔЕ) при взаимодействии с квантом света (hν) https://biomolecula.ru/articles/spektroskopiia-kr-novye-vozmozhnosti-starogo-metoda
- 31. Main protein chromophores
- 32. Absorption in far-UV by secondary structures The differences in the linear absorption exist, but are not
- 33. Chirality and optical activity
- 34. α-helices and β-cheets are optically active
- 35. Polarization of light
- 36. Polarization of light https://www.youtube.com/watch?v=8YkfEft4p-w
- 37. Circularly polarized light can be absorbed
- 38. Units of CD Дихроичное поглощение Молярный дихроизм Молярный дихроизм Молярная эллиптичность
- 39. Far-UV CD spectroscopy
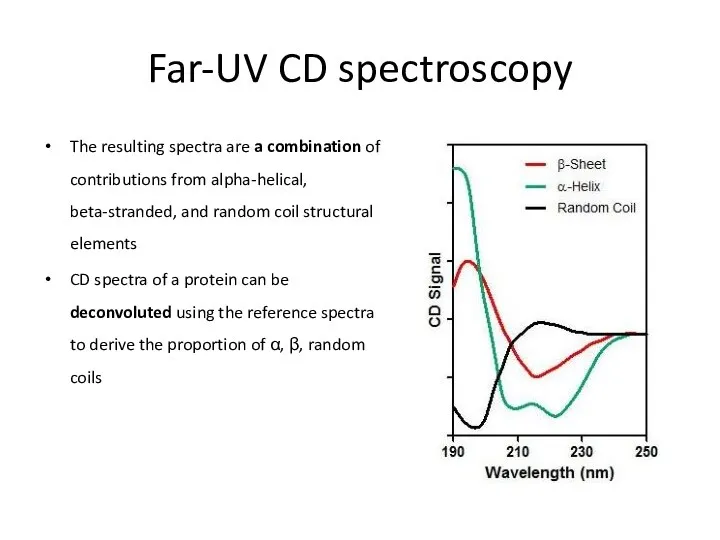
- 40. Far-UV CD spectroscopy The resulting spectra are a combination of contributions from alpha-helical, beta-stranded, and random
- 41. Alpha-helix content determination using an empirical formula Greenfield, N.; Fasman, G. D. Biochemistry 1969, 8, 4108–4116.
- 43. STARD1 far-UV spectrum analysis using DichroWeb Sluchanko et al Prot. Exp. Purif. 2016
- 44. Applications Determination of 2° structure content in a protein of interest The effect of ligand binding
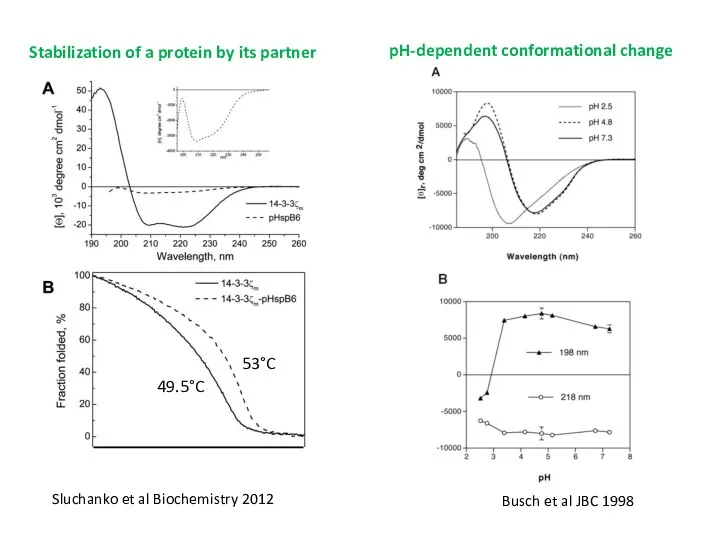
- 45. Stabilization of a protein by its partner Sluchanko et al Biochemistry 2012 49.5°C 53°C pH-dependent conformational
- 46. Monomerization of a protein reduces the stability of its alpha-helical structure Sluchanko, Uversky BBA Proteins 2015
- 47. Far-UV CD Very convenient, sensitive, non-invasive technique Small sample consumption (50-100 µl, 0.5-1 mg/ml), sample can
- 48. Aromatic residues are chromophores Resonance double bonds Absorb UV light around 280 nm Proteins therefore give
- 49. Near-UV CD for assessment of tertiary structure features Is sensitive to the environment! Higher protein C
- 50. Bova et al PNAS 1999 For wild-type αB-crystallin 10% α-helix, 44% β-sheet, 45% unfolded For R120G
- 51. Fourier-Transform Infrared (FTIR) spectroscopy X axis – wavenumbers (cm-1) 1650 cm-1 = 0.01/1650 ~ 6 µm
- 52. Interference
- 53. Interference
- 54. Interferometer
- 55. FTIR spectroscopy requires Fourier transformation of raw data to get spectrum The FTIR interferogram (dependence on
- 56. Fourier transform Signal in time domain Signal in frequency domain
- 58. Buffer subtraction from sample Water absorbs ! Analysis in thin films and cuvettes, capillaries
- 59. FTIR spectroscopy for studying 2° structures The workflow for structure analysis: measurement of the protein sample
- 60. Protein bands in a FTIR spectrum
- 61. Processing of the raw spectrum 2nd derivative raw spectrum Curve-fitted inverse derivative spectrum
- 62. Unfolding of HSPB8 induced by temperature as monitored by FTIR Kazakov et al Biophys Chem 2009
- 63. Raman spectroscopy Complimentary to IR spectroscopy, but relies on scattering instead of absorption Possibility to measure
- 64. Raman spectroscopy C.V. Raman, 1930 Nobel Prize Elastic scattering Raman scattering Must be filtered out! Очень
- 65. Комбинационное рассеяние света (эффект Рамана) — неупругое рассеяние оптического излучения на молекулах вещества (твёрдого, жидкого или
- 66. Выявление различных веществ по ключевым пикам на спектре КР сложной смеси
- 67. Raman spectroscopy (=комбинационное рассеяние света) The focus of Raman spectroscopy Very weak signals (elastic scattering dominates)
- 68. Raman spectroscopy (=комбинационное рассеяние света)
- 69. Raman spectrum Laser frequency (0 cm-1) Stokes shifts
- 70. Raman spectrum
- 71. Raman microscope
- 72. Information extracted from Raman spectra The Raman shifts and relative intensities of all of the bands
- 73. Raman spectra – protein 2° structure Resonance Raman spectra – near the electronic transition frequency Curr
- 74. Intrinsic fluorescence and tertiary structure Stokes (red) shift
- 75. Trp location and fluorescence spectra class A (λm = 308 nm, structured spectra) - the fluorophores,
- 76. Protein folding
- 77. Protein quality control
- 78. Thermal stability of proteins Enzyme activity (T) CD DSF DSC Thermal shift assays:
- 79. Differential scanning fluorimetry (DSF) Может быть не только белковый флуорофор! Либо внешняя, либо иммобилизованная метка https://www.nature.com/articles/nprot.2007.321
- 80. Data transformation Trp fluorescence Wavelength, nm λ1 λ2 λmax I(λ1)/I(λ2) T, C Trp emission spectrum T0.5
- 81. Thermofluor Extrinsic dyes: supro orange, 1,8-ANS, Nile red qPCR machine
- 82. Thermofluor – effect of ligands
- 83. DSF and high-throughput DOI: 10.1007/978-1-4939-7577-8_23 In book: Bacterial Chemosensing Screening of ligands (bind or not) Optimization
- 84. DSF and high-throughput
- 85. Дифференциальная сканирующая калориметрия (ДСК, DSC)
- 86. Теплота и калория Количество энергии, которое теряет или получает тело в течение времени в форме теплового
- 87. Принцип метода ДСК ДСК основан на нагревании или охлаждении образца и эталона с заданной скоростью при
- 88. Определения Тепловой поток Скорость нагревания Теплопоглощение (переданное тепло, отнесенное к приросту температуры)
- 89. Взаимосвязь потока тепла в единицу времени (мощность) и температуры Постоянная мощность Измеряем температуру Постоянная скорость нагрева
- 90. Постоянная мощность Измеряем температуру Постоянная скорость нагрева Измеряем мощность Семенюк П.И.
- 91. Постоянная мощность Измеряем температуру Постоянная скорость нагрева Измеряем мощность Семенюк П.И.
- 92. Эндотермические и экзотермические тепловые эффекты
- 93. Что получаем в итоге опыта?
- 94. Энтальпия
- 95. Калориметрия мультидоменных белков
- 96. Сочетание разных методов изучения термостабильности
- 98. Скачать презентацию
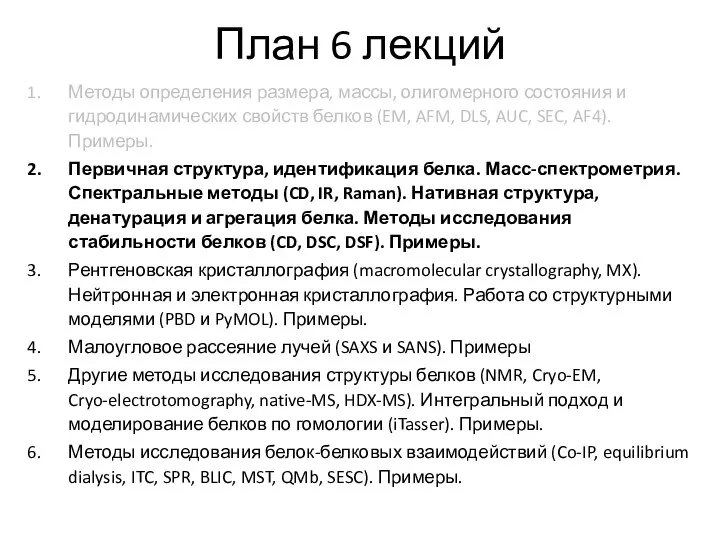
План 6 лекций
Методы определения размера, массы, олигомерного состояния и гидродинамических свойств
План 6 лекций
Методы определения размера, массы, олигомерного состояния и гидродинамических свойств
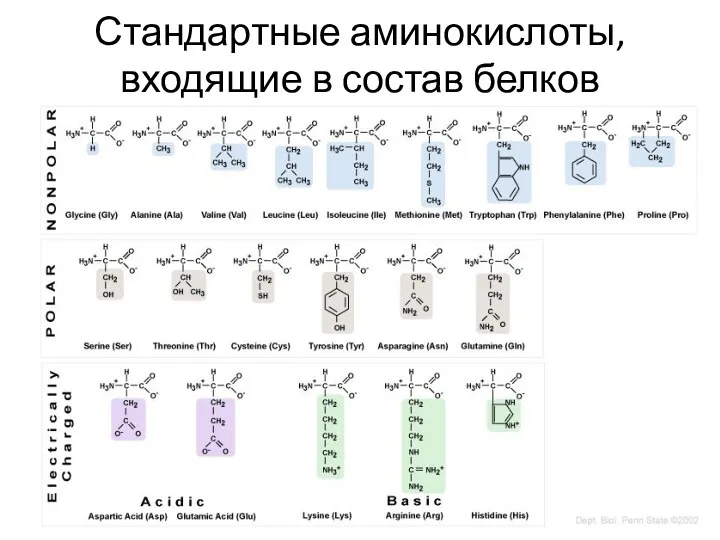
Стандартные аминокислоты, входящие в состав белков
Стандартные аминокислоты, входящие в состав белков
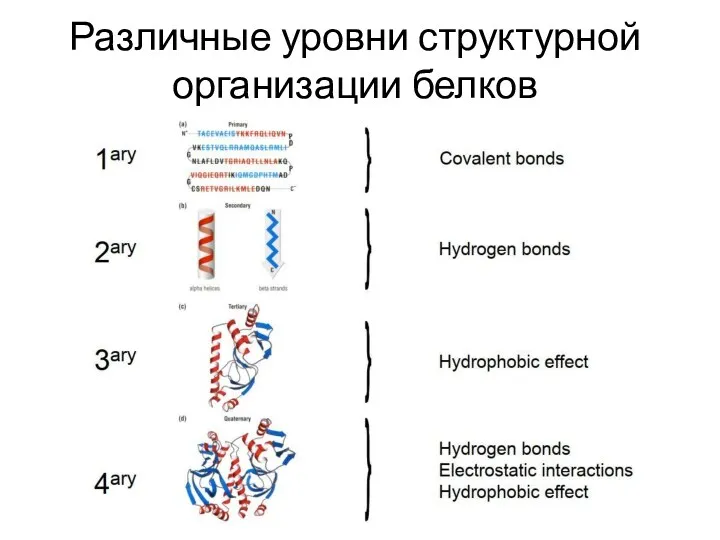
Различные уровни структурной организации белков
Различные уровни структурной организации белков
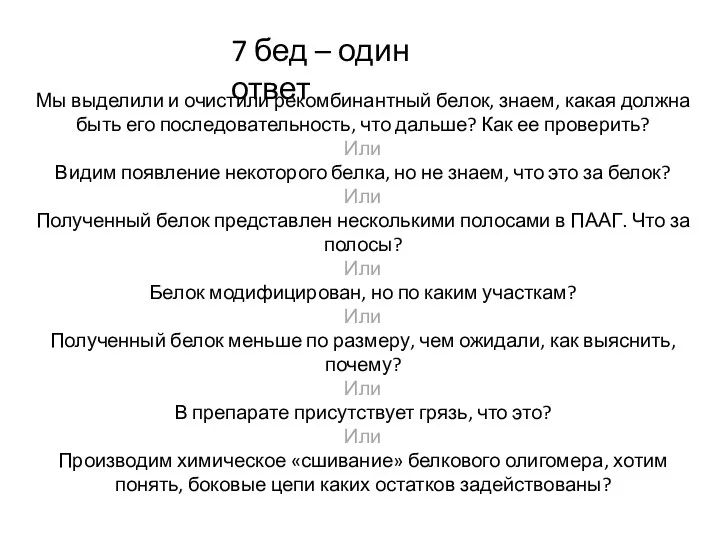
Мы выделили и очистили рекомбинантный белок, знаем, какая должна быть его
Мы выделили и очистили рекомбинантный белок, знаем, какая должна быть его
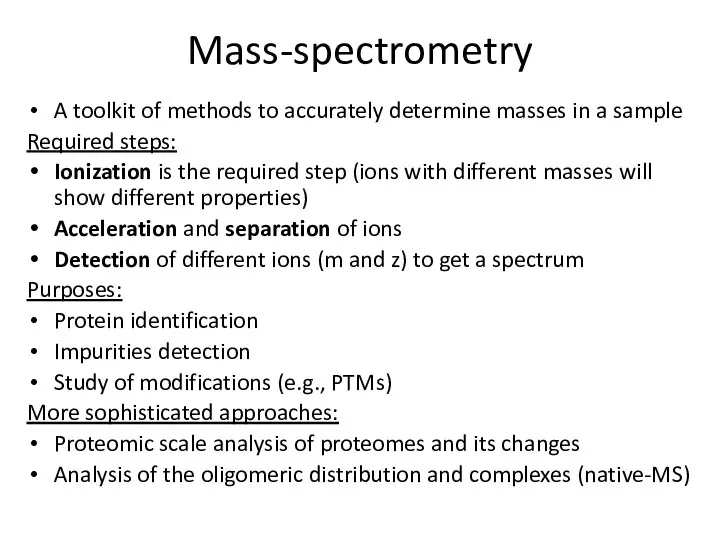
Mass-spectrometry
A toolkit of methods to accurately determine masses in a sample
Required
Mass-spectrometry
A toolkit of methods to accurately determine masses in a sample
Required
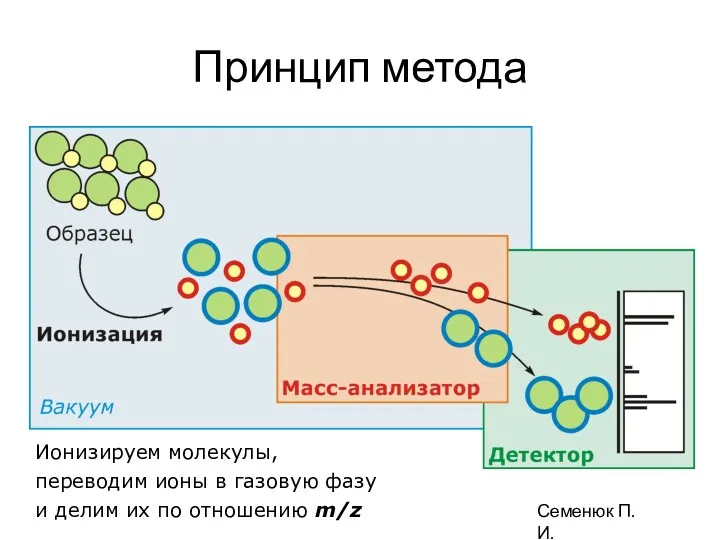
Принцип метода
Ионизируем молекулы,
переводим ионы в газовую фазу
и делим их по отношению
Принцип метода
Ионизируем молекулы, переводим ионы в газовую фазу и делим их по отношению
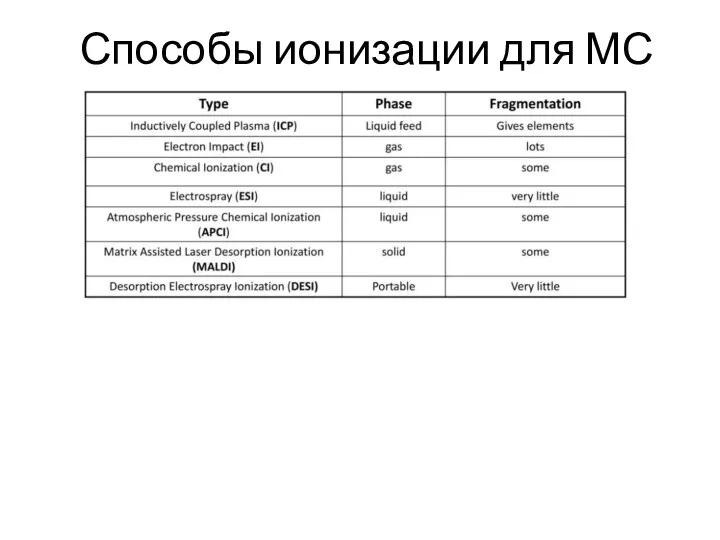
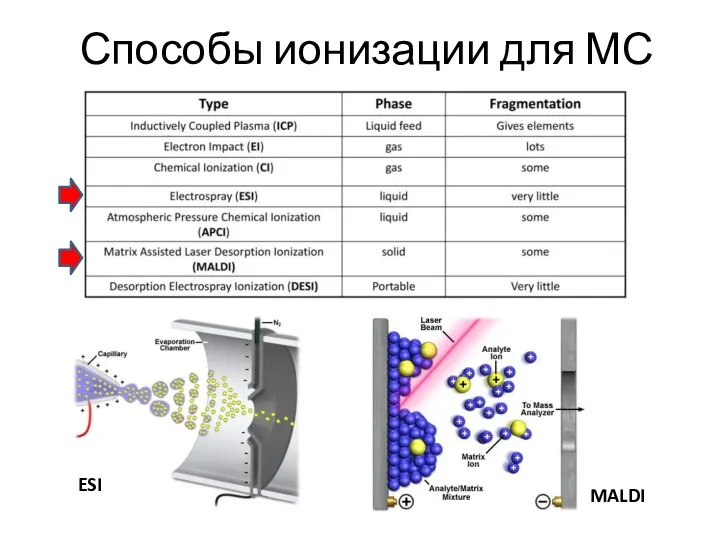
Способы ионизации для МС
Способы ионизации для МС
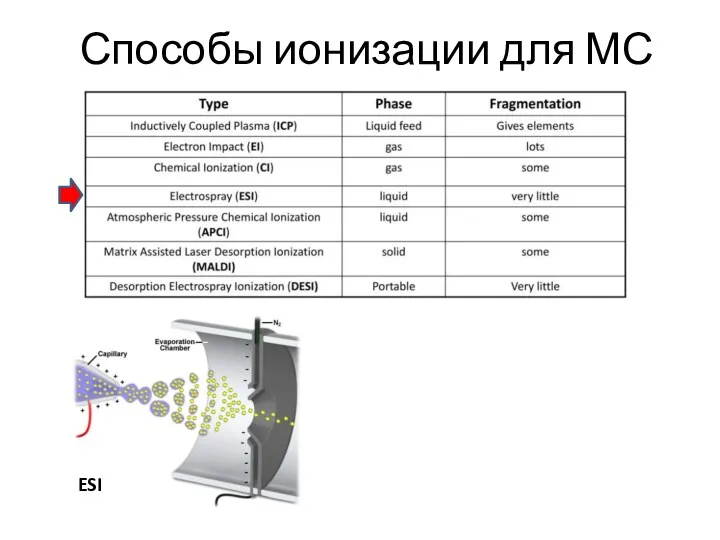
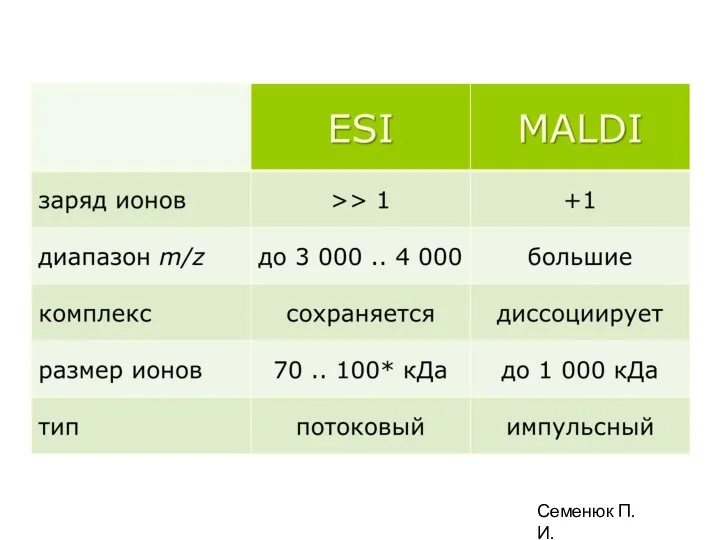
Способы ионизации для МС
ESI
Способы ионизации для МС
ESI
Способы ионизации для МС
ESI
MALDI
Способы ионизации для МС
ESI
MALDI
Семенюк П.И.
Семенюк П.И.
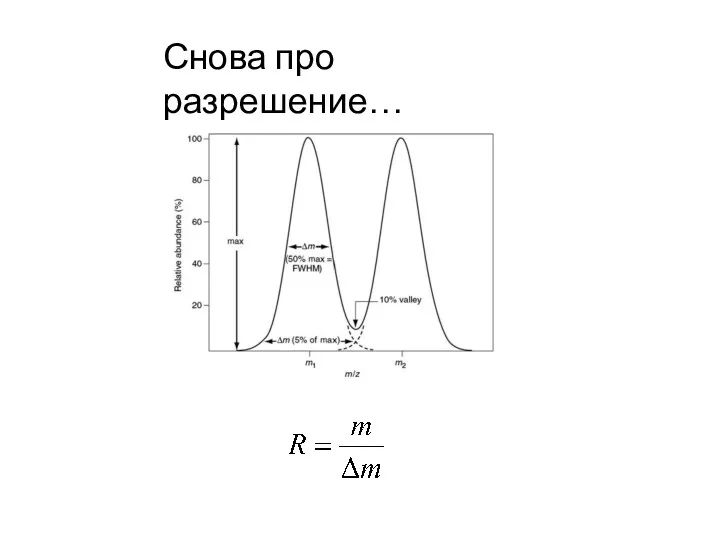
Снова про разрешение…
Снова про разрешение…
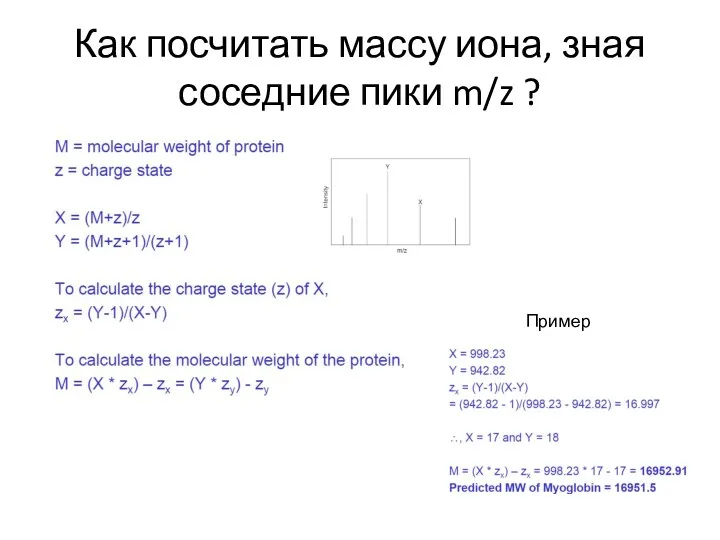
Как посчитать массу иона, зная соседние пики m/z ?
Пример
Как посчитать массу иона, зная соседние пики m/z ?
Пример
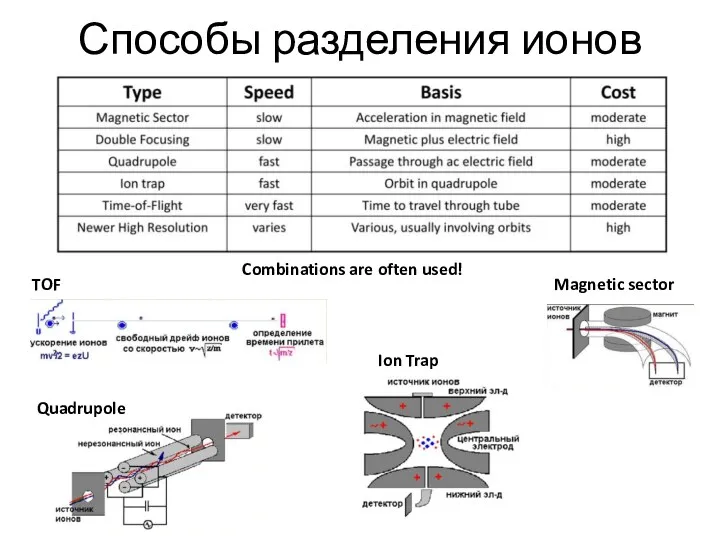
Способы разделения ионов
TOF
Quadrupole
Ion Trap
Magnetic sector
Combinations are often used!
Способы разделения ионов
TOF
Quadrupole
Ion Trap
Magnetic sector
Combinations are often used!
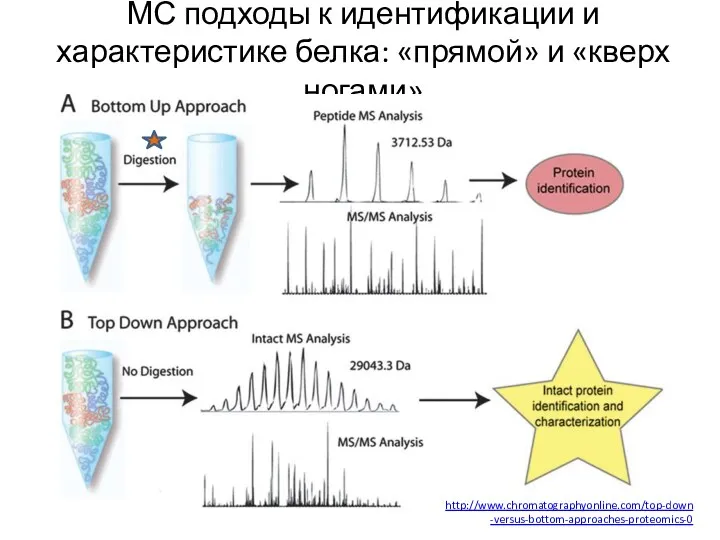
МС подходы к идентификации и характеристике белка: «прямой» и «кверх ногами»
http://www.chromatographyonline.com/top-down-versus-bottom-approaches-proteomics-0
МС подходы к идентификации и характеристике белка: «прямой» и «кверх ногами»
http://www.chromatographyonline.com/top-down-versus-bottom-approaches-proteomics-0
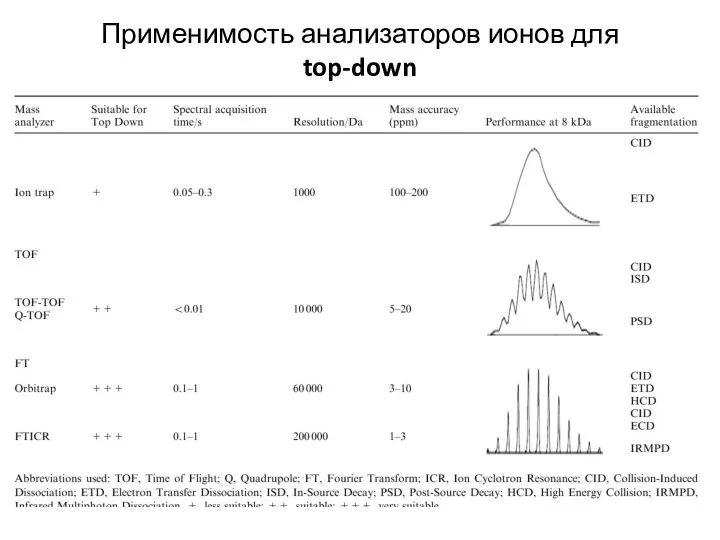
Применимость анализаторов ионов для top-down
Применимость анализаторов ионов для top-down
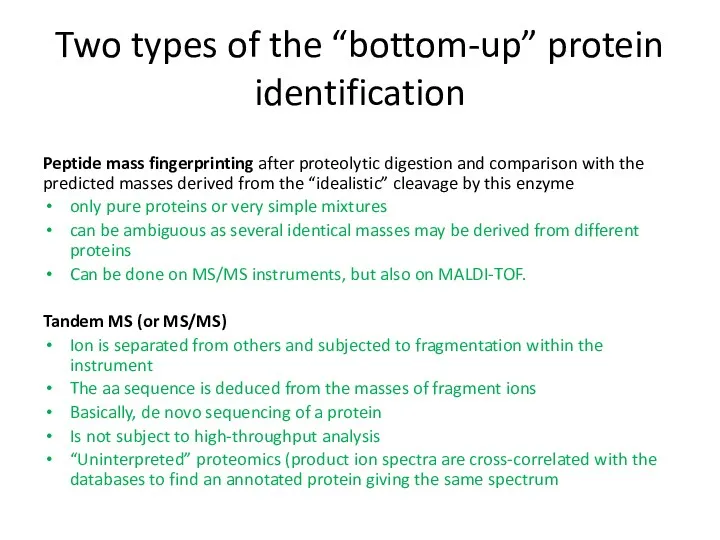
Two types of the “bottom-up” protein identification
Peptide mass fingerprinting after proteolytic
Two types of the “bottom-up” protein identification
Peptide mass fingerprinting after proteolytic
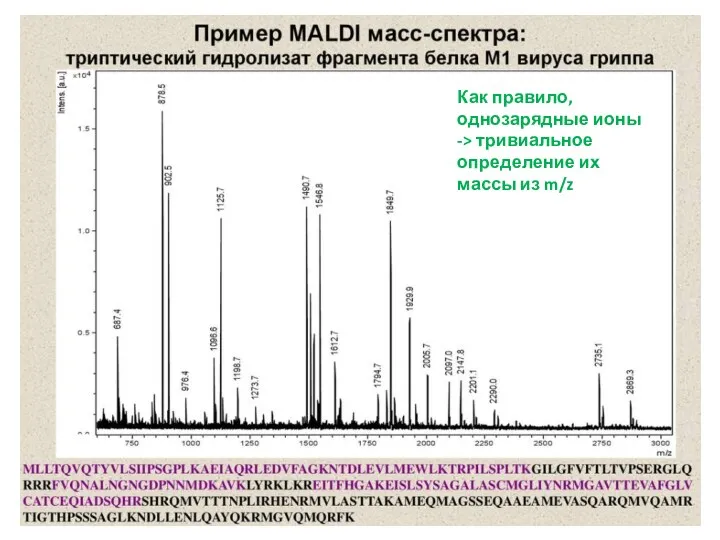
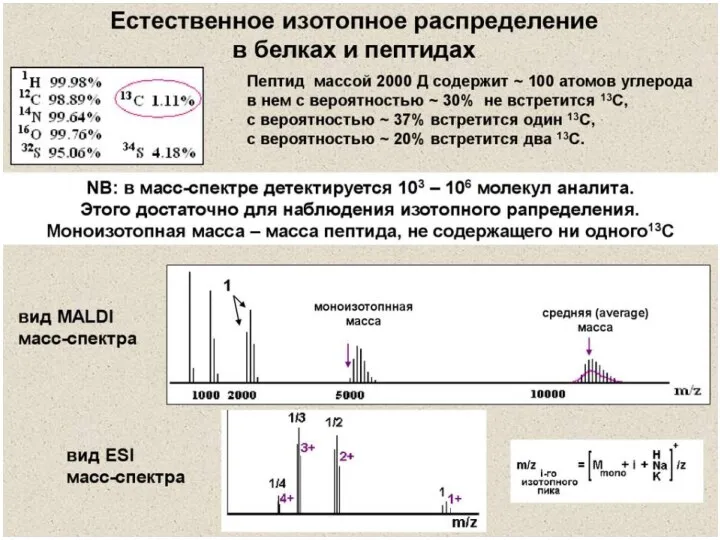
Как правило, однозарядные ионы -> тривиальное определение их массы из m/z
Как правило, однозарядные ионы -> тривиальное определение их массы из m/z
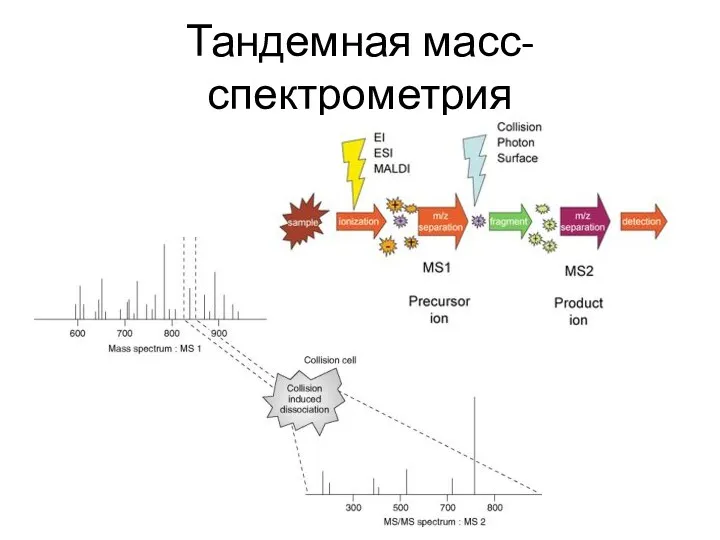
Тандемная масс-спектрометрия
Тандемная масс-спектрометрия
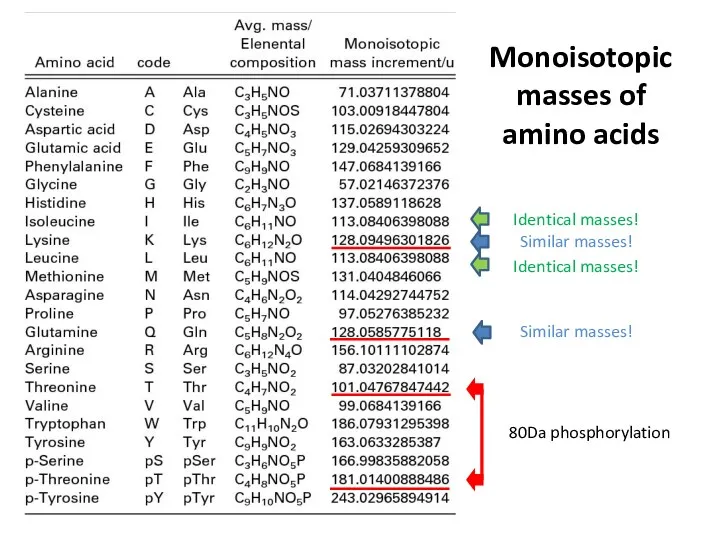
Monoisotopic masses of amino acids
80Da phosphorylation
Similar masses!
Identical masses!
Identical masses!
Similar masses!
Monoisotopic masses of amino acids
80Da phosphorylation
Similar masses!
Identical masses!
Identical masses!
Similar masses!
Тандемная масс-спектрометрия
Тандемная масс-спектрометрия
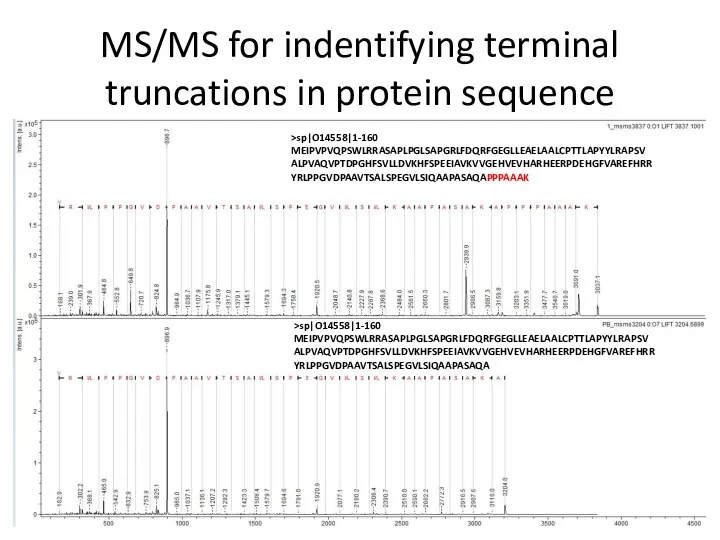
MS/MS for indentifying terminal truncations in protein sequence
>sp|O14558|1-160
MEIPVPVQPSWLRRASAPLPGLSAPGRLFDQRFGEGLLEAELAALCPTTLAPYYLRAPSV
ALPVAQVPTDPGHFSVLLDVKHFSPEEIAVKVVGEHVEVHARHEERPDEHGFVAREFHRR
YRLPPGVDPAAVTSALSPEGVLSIQAAPASAQAPPPAAAK
>sp|O14558|1-160
MEIPVPVQPSWLRRASAPLPGLSAPGRLFDQRFGEGLLEAELAALCPTTLAPYYLRAPSV
ALPVAQVPTDPGHFSVLLDVKHFSPEEIAVKVVGEHVEVHARHEERPDEHGFVAREFHRR
YRLPPGVDPAAVTSALSPEGVLSIQAAPASAQA
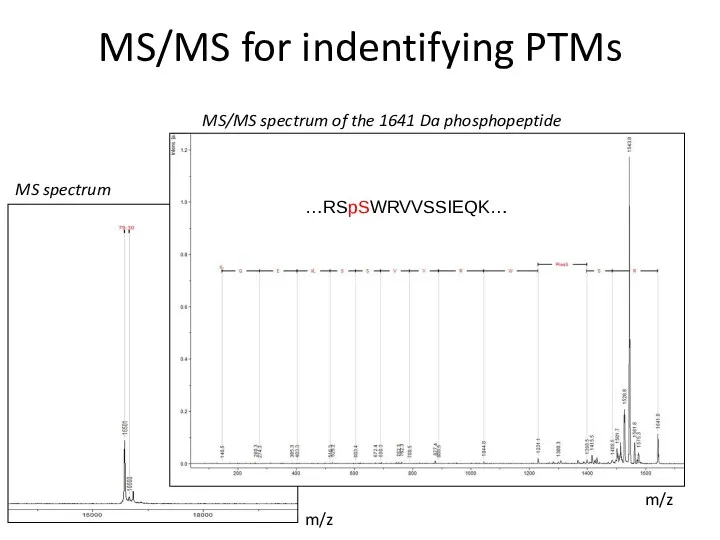
MS/MS for indentifying PTMs
m/z
m/z
MS spectrum
MS/MS spectrum of the 1641 Da phosphopeptide
…RSpSWRVVSSIEQK…
MS/MS for indentifying PTMs
m/z
m/z
MS spectrum
MS/MS spectrum of the 1641 Da phosphopeptide
…RSpSWRVVSSIEQK…

Конец лекции 18.11.19
Конец лекции 18.11.19
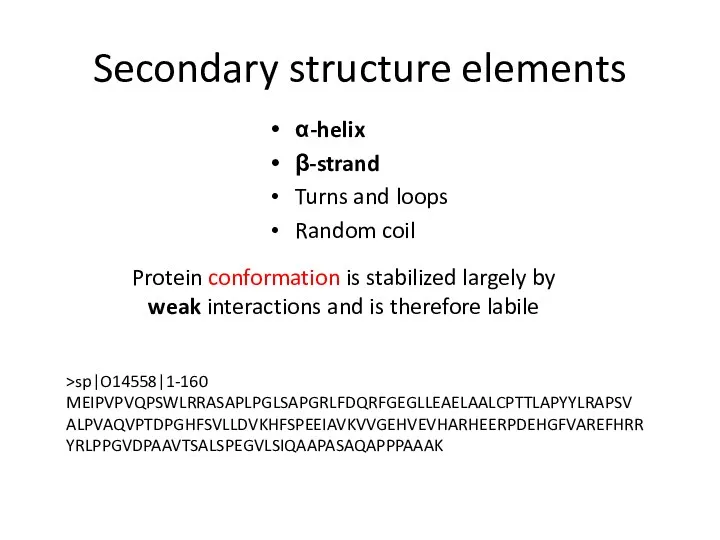
Secondary structure elements
α-helix
β-strand
Turns and loops
Random coil
Protein conformation is stabilized largely
Secondary structure elements
α-helix
β-strand
Turns and loops
Random coil
Protein conformation is stabilized largely
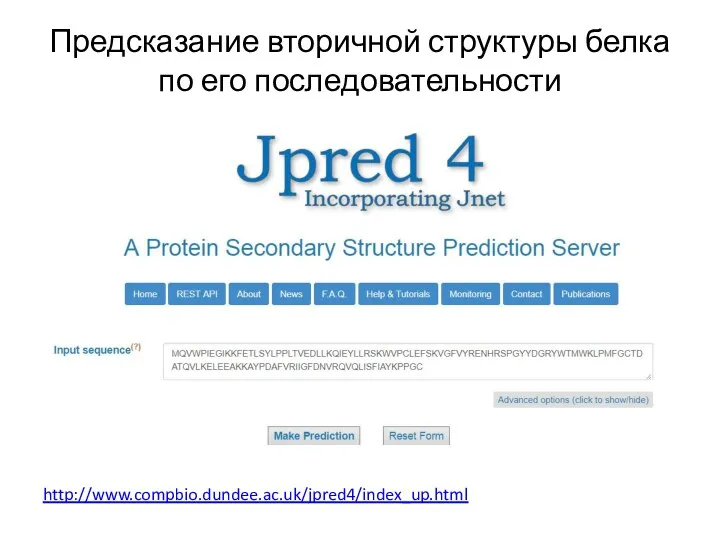
Предсказание вторичной структуры белка по его последовательности
http://www.compbio.dundee.ac.uk/jpred4/index_up.html
Предсказание вторичной структуры белка по его последовательности
http://www.compbio.dundee.ac.uk/jpred4/index_up.html
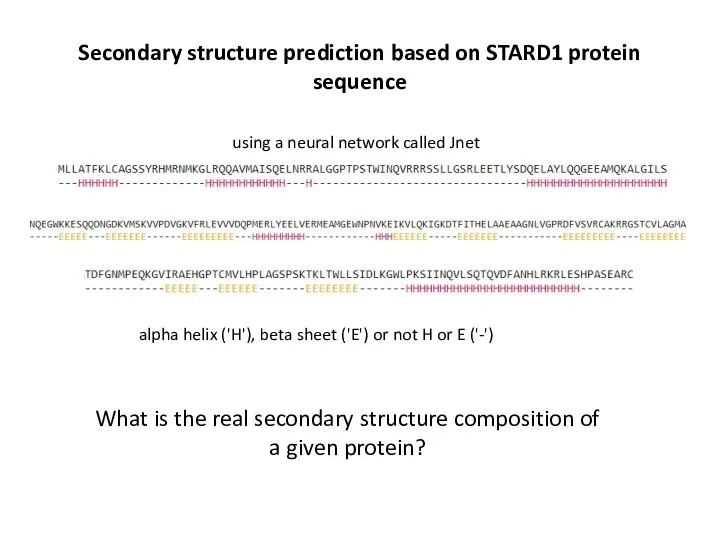
Secondary structure prediction based on STARD1 protein sequence
alpha helix ('H'), beta
Secondary structure prediction based on STARD1 protein sequence
alpha helix ('H'), beta
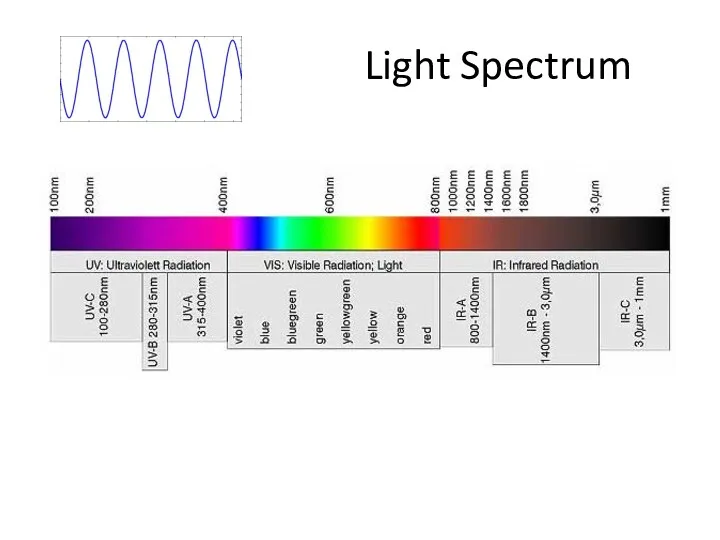
Light Spectrum
Light Spectrum
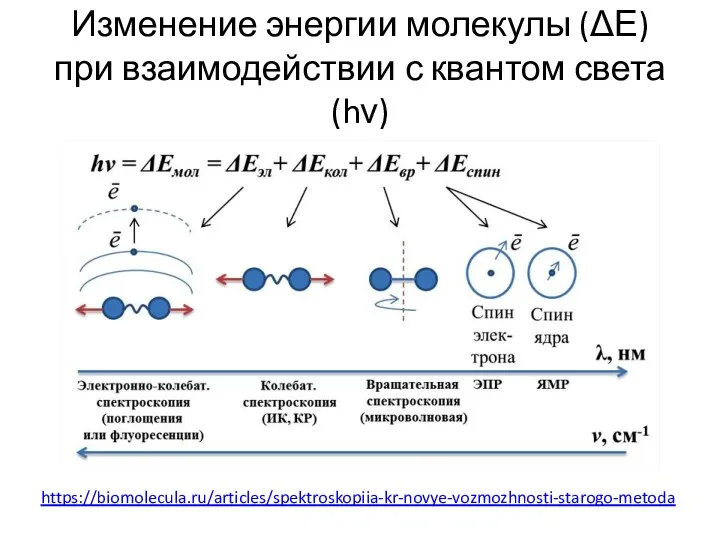
Изменение энергии молекулы (ΔЕ) при взаимодействии с квантом света (hν)
https://biomolecula.ru/articles/spektroskopiia-kr-novye-vozmozhnosti-starogo-metoda
Изменение энергии молекулы (ΔЕ) при взаимодействии с квантом света (hν)
https://biomolecula.ru/articles/spektroskopiia-kr-novye-vozmozhnosti-starogo-metoda
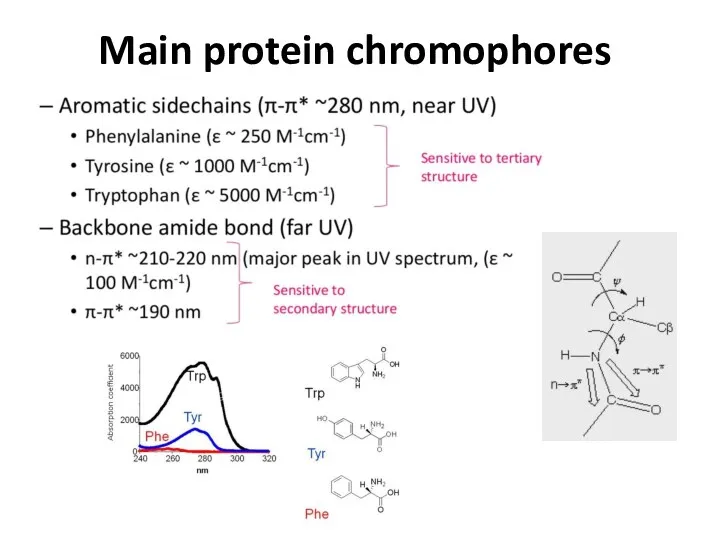
Main protein chromophores
Main protein chromophores
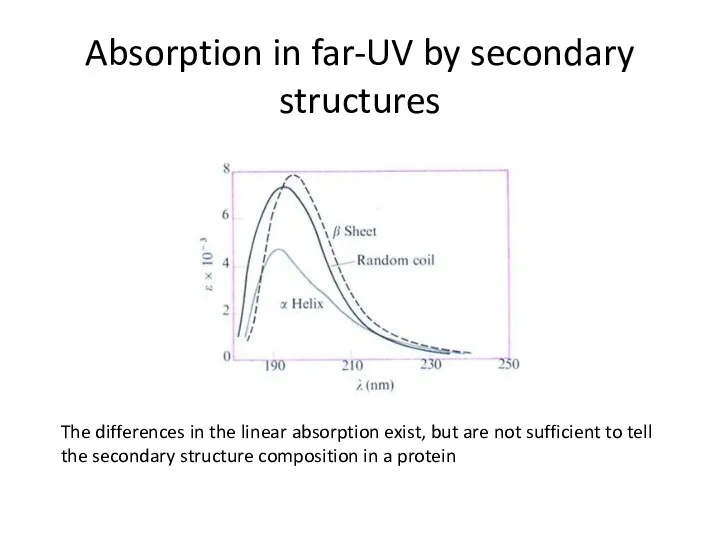
Absorption in far-UV by secondary structures
The differences in the linear absorption
Absorption in far-UV by secondary structures
The differences in the linear absorption
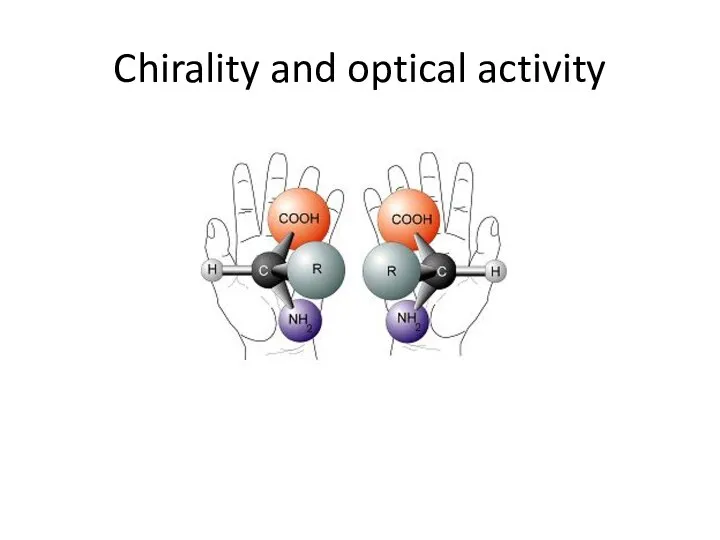
Chirality and optical activity
Chirality and optical activity
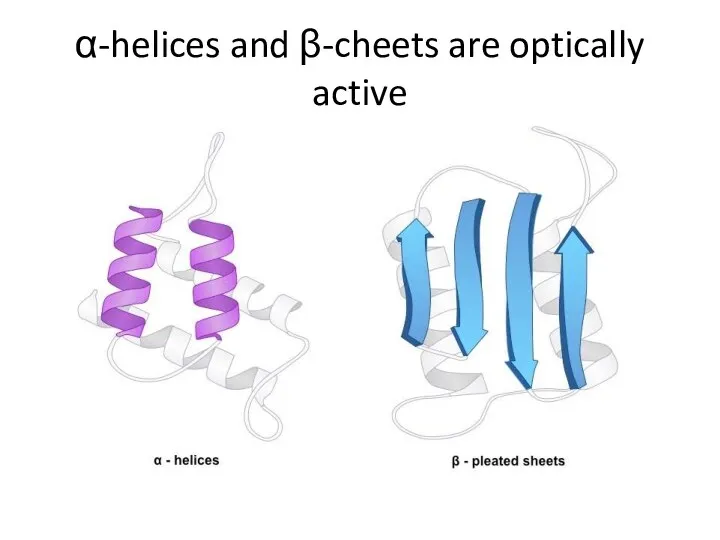
α-helices and β-cheets are optically active
α-helices and β-cheets are optically active
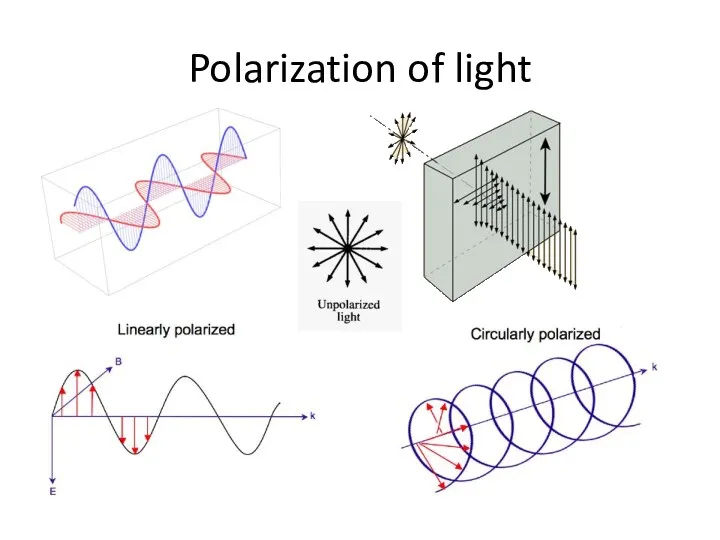
Polarization of light
Polarization of light
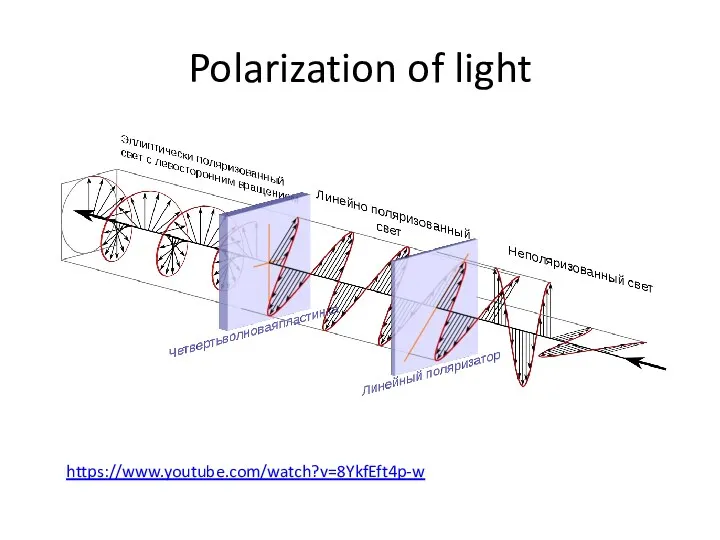
Polarization of light
https://www.youtube.com/watch?v=8YkfEft4p-w
Polarization of light
https://www.youtube.com/watch?v=8YkfEft4p-w
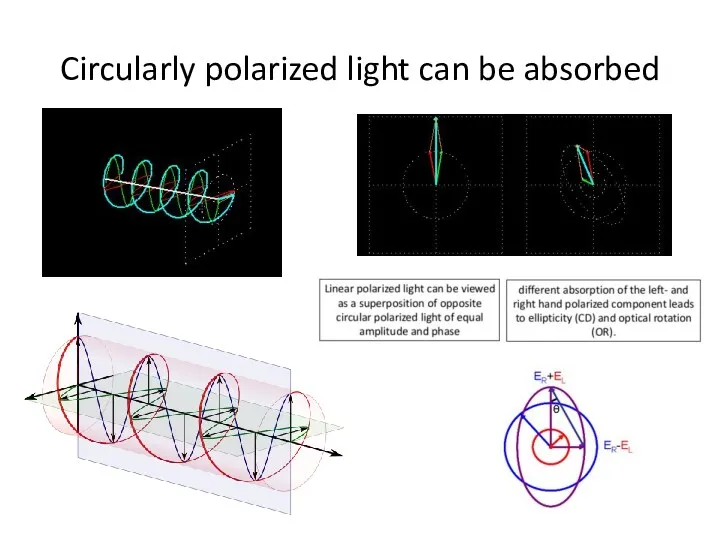
Circularly polarized light can be absorbed
Circularly polarized light can be absorbed
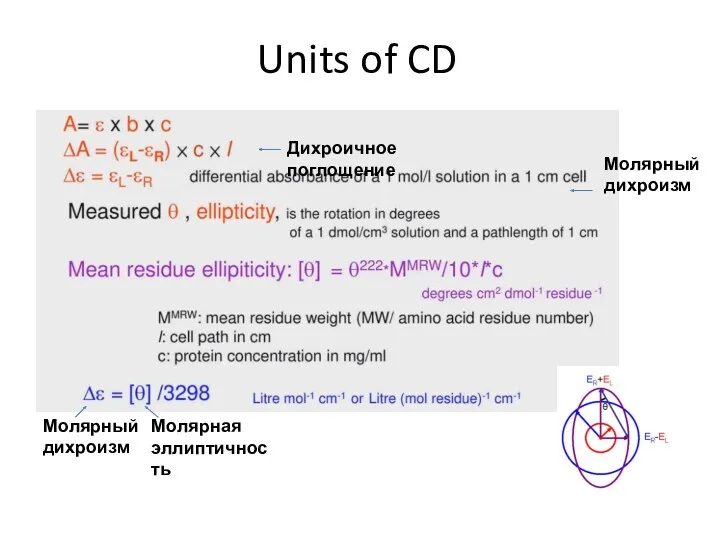
Units of CD
Дихроичное поглощение
Молярный дихроизм
Молярный дихроизм
Молярная эллиптичность
Units of CD
Дихроичное поглощение
Молярный дихроизм
Молярный дихроизм
Молярная эллиптичность
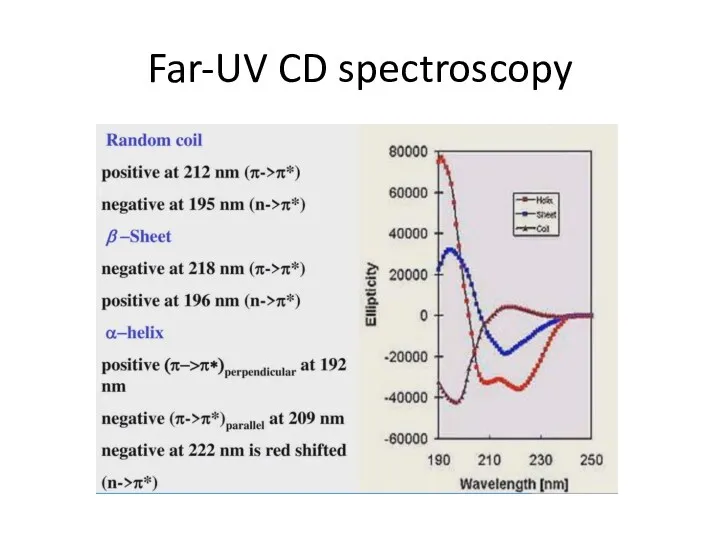
Far-UV CD spectroscopy
Far-UV CD spectroscopy
Far-UV CD spectroscopy
The resulting spectra are a combination of contributions from
Far-UV CD spectroscopy
The resulting spectra are a combination of contributions from
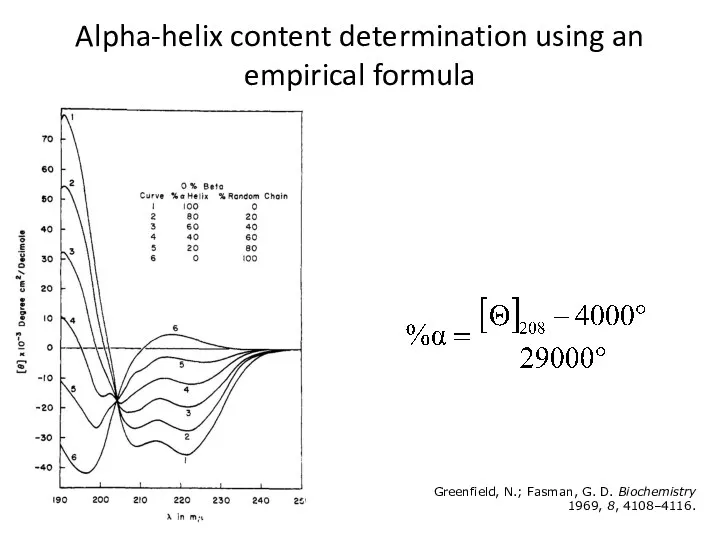
Alpha-helix content determination using an empirical formula
Greenfield, N.; Fasman, G. D.
Alpha-helix content determination using an empirical formula
Greenfield, N.; Fasman, G. D.
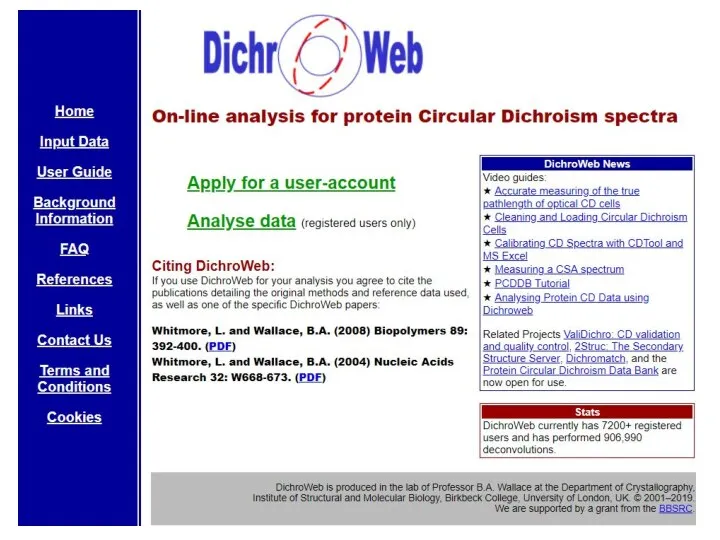
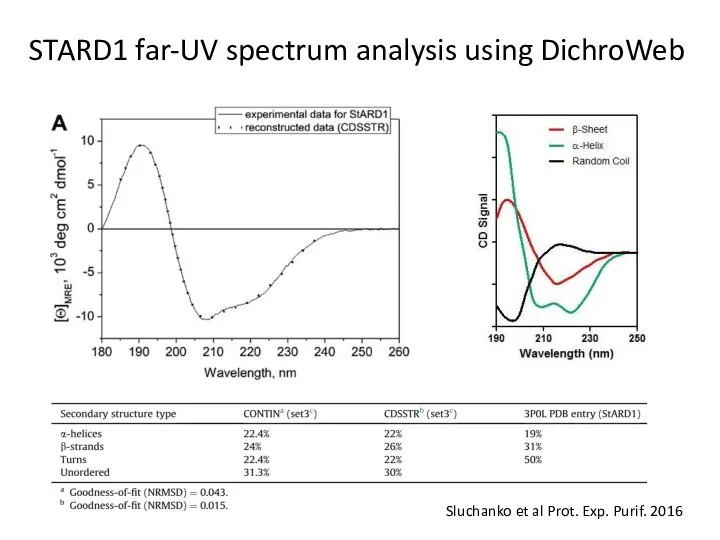
STARD1 far-UV spectrum analysis using DichroWeb
Sluchanko et al Prot. Exp. Purif.
STARD1 far-UV spectrum analysis using DichroWeb
Sluchanko et al Prot. Exp. Purif.
Applications
Determination of 2° structure content in a protein of interest
The effect
Applications
Determination of 2° structure content in a protein of interest
The effect
Stabilization of a protein by its partner
Sluchanko et al Biochemistry 2012
49.5°C
53°C
pH-dependent
Stabilization of a protein by its partner
Sluchanko et al Biochemistry 2012
49.5°C
53°C
pH-dependent
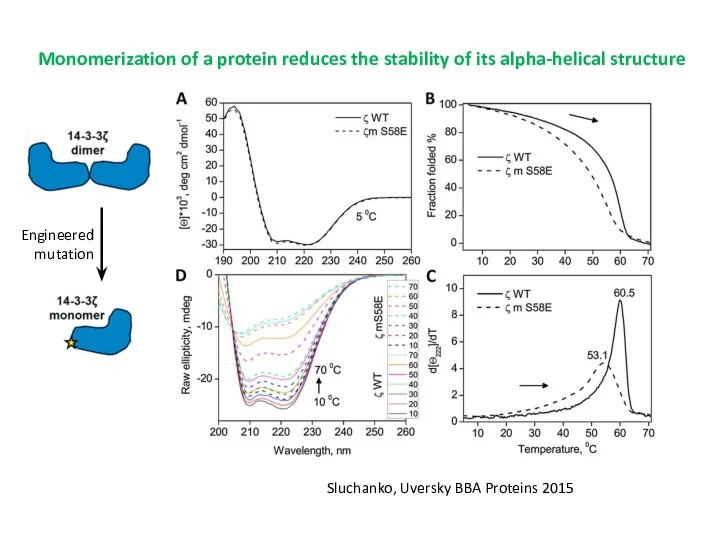
Monomerization of a protein reduces the stability of its alpha-helical structure
Sluchanko,
Monomerization of a protein reduces the stability of its alpha-helical structure
Sluchanko,
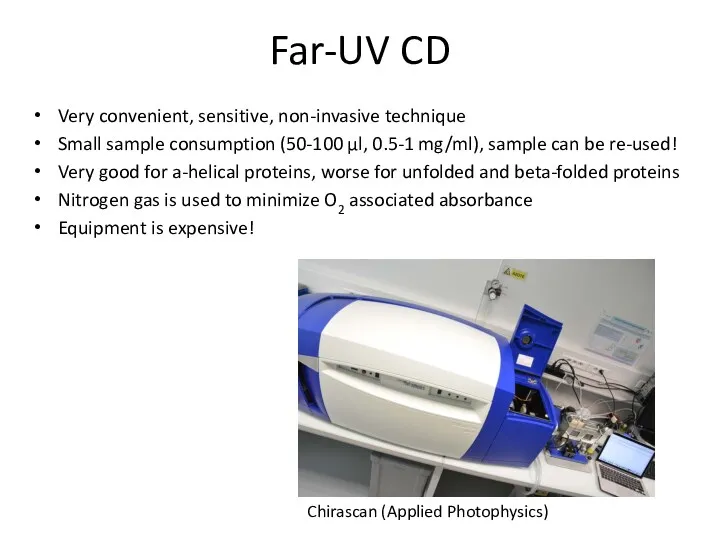
Far-UV CD
Very convenient, sensitive, non-invasive technique
Small sample consumption (50-100 µl, 0.5-1
Far-UV CD
Very convenient, sensitive, non-invasive technique
Small sample consumption (50-100 µl, 0.5-1
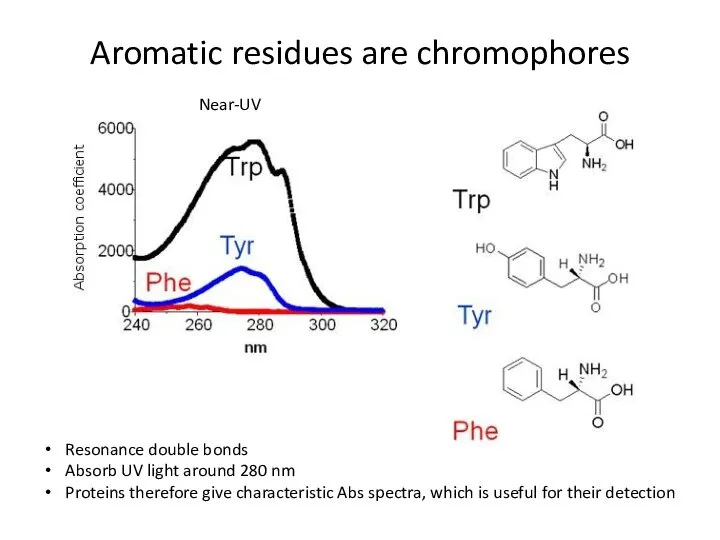
Aromatic residues are chromophores
Resonance double bonds
Absorb UV light around 280 nm
Proteins
Aromatic residues are chromophores
Resonance double bonds
Absorb UV light around 280 nm
Proteins
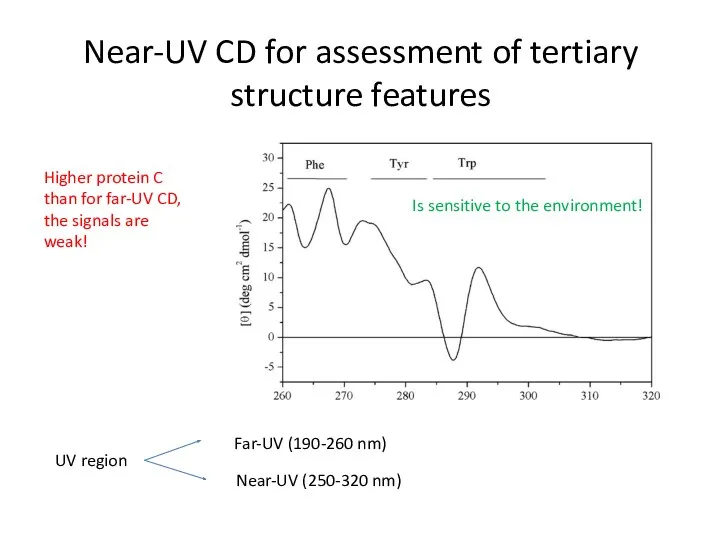
Near-UV CD for assessment of tertiary structure features
Is sensitive to the
Near-UV CD for assessment of tertiary structure features
Is sensitive to the
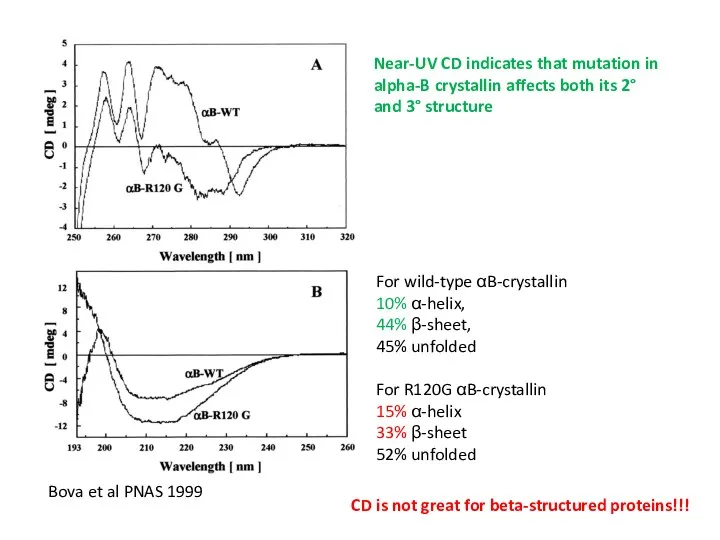
Bova et al PNAS 1999
For wild-type αB-crystallin
10% α-helix,
44% β-sheet,
45%
Bova et al PNAS 1999
For wild-type αB-crystallin
10% α-helix,
44% β-sheet,
45%
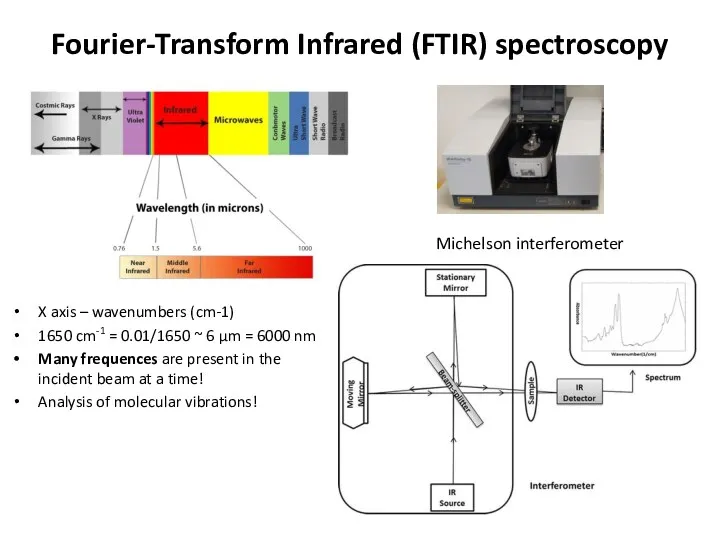
Fourier-Transform Infrared (FTIR) spectroscopy
X axis – wavenumbers (cm-1)
1650 cm-1 =
Fourier-Transform Infrared (FTIR) spectroscopy
X axis – wavenumbers (cm-1)
1650 cm-1 =
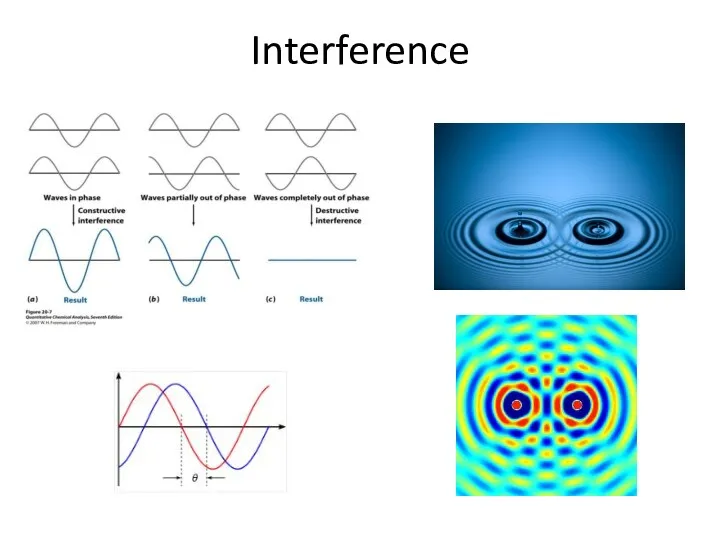
Interference
Interference
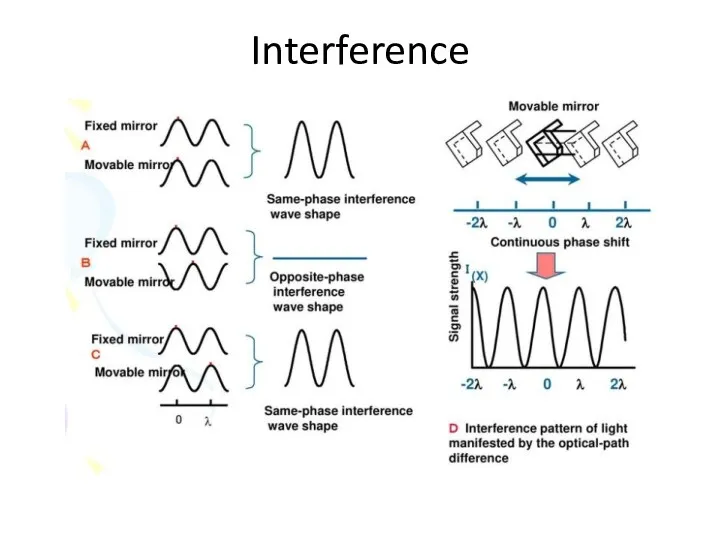
Interference
Interference
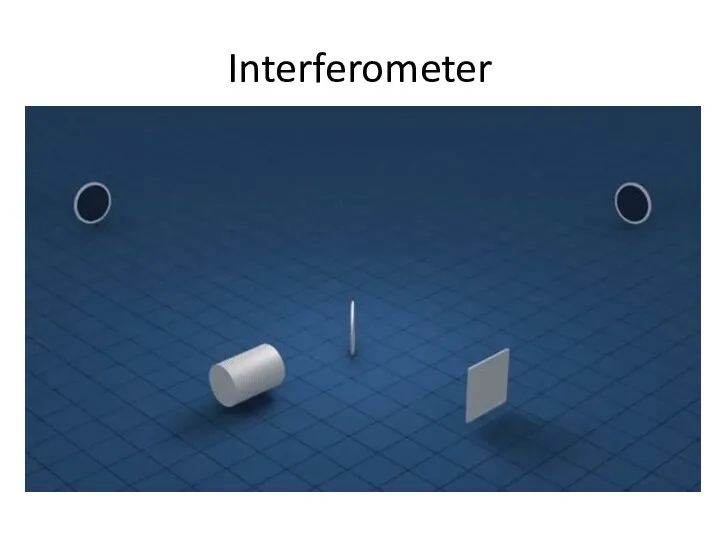
Interferometer
Interferometer
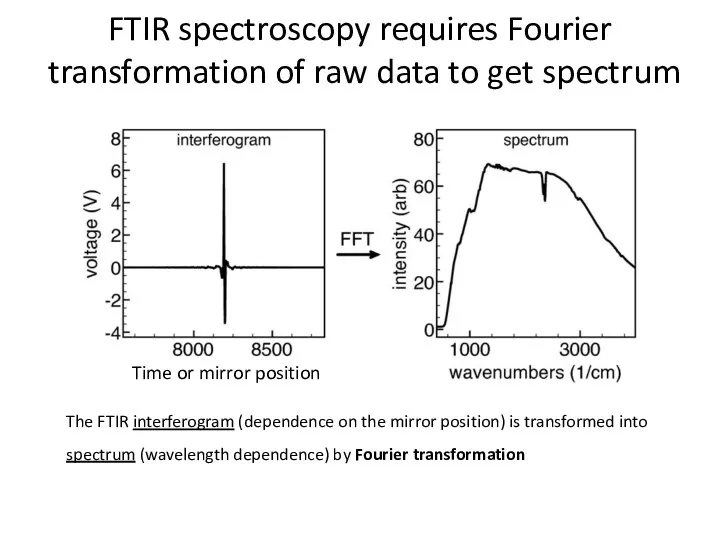
FTIR spectroscopy requires Fourier transformation of raw data to get spectrum
The
FTIR spectroscopy requires Fourier transformation of raw data to get spectrum
The
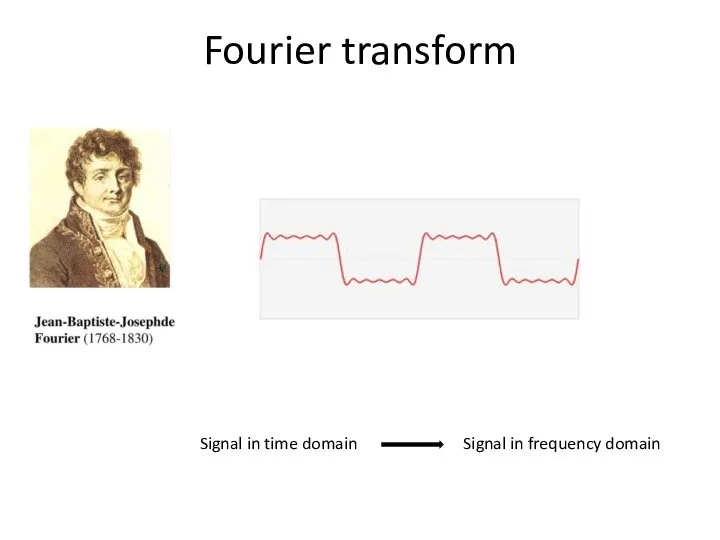
Fourier transform
Signal in time domain
Signal in frequency domain
Fourier transform
Signal in time domain
Signal in frequency domain

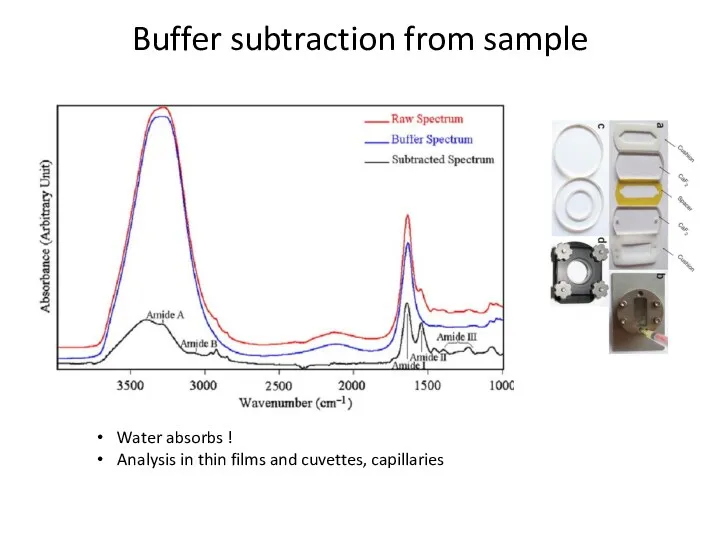
Buffer subtraction from sample
Water absorbs !
Analysis in thin films and cuvettes,
Buffer subtraction from sample
Water absorbs !
Analysis in thin films and cuvettes,
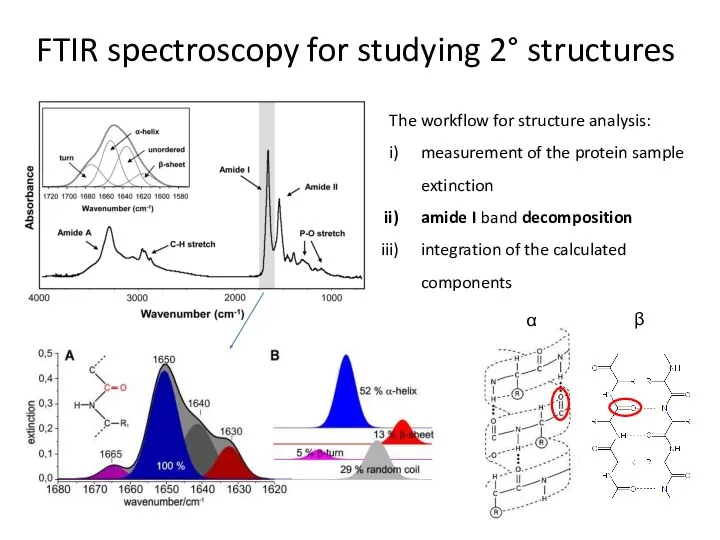
FTIR spectroscopy for studying 2° structures
The workflow for structure analysis:
measurement of
FTIR spectroscopy for studying 2° structures
The workflow for structure analysis:
measurement of
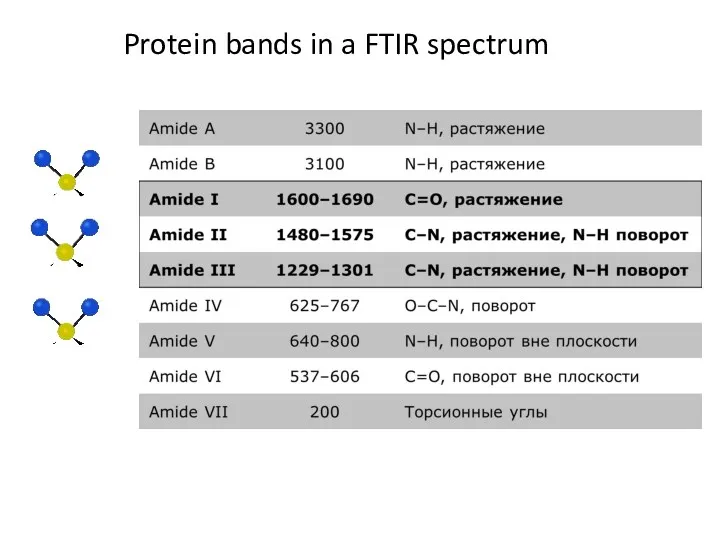
Protein bands in a FTIR spectrum
Protein bands in a FTIR spectrum
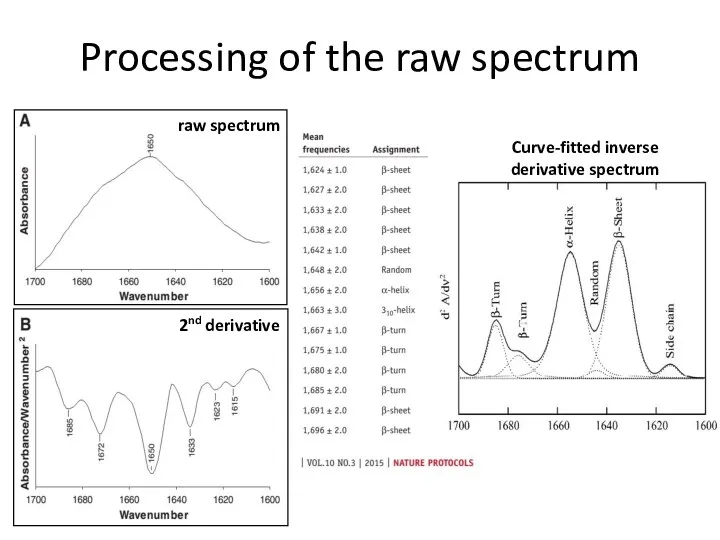
Processing of the raw spectrum
2nd derivative
raw spectrum
Curve-fitted inverse derivative spectrum
Processing of the raw spectrum
2nd derivative
raw spectrum
Curve-fitted inverse derivative spectrum
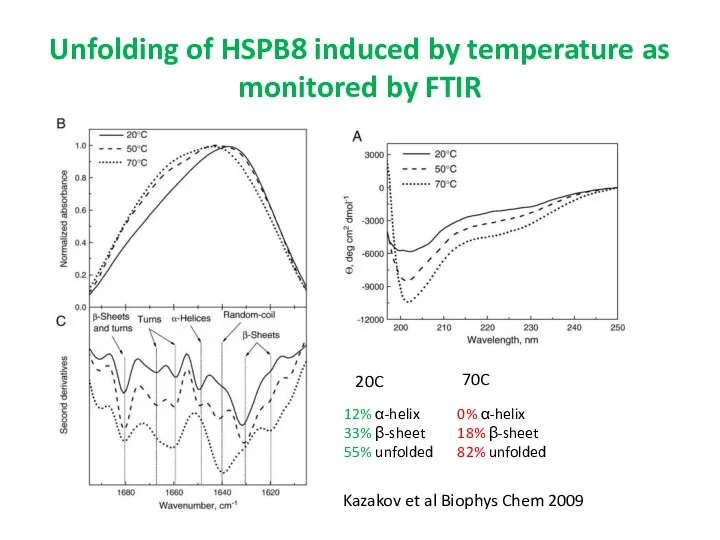
Unfolding of HSPB8 induced by temperature as monitored by FTIR
Kazakov et
Unfolding of HSPB8 induced by temperature as monitored by FTIR
Kazakov et
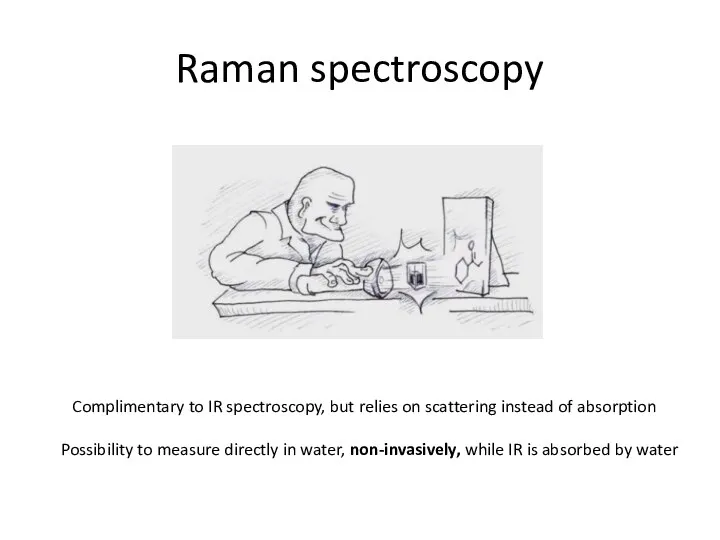
Raman spectroscopy
Complimentary to IR spectroscopy, but relies on scattering instead of
Raman spectroscopy
Complimentary to IR spectroscopy, but relies on scattering instead of
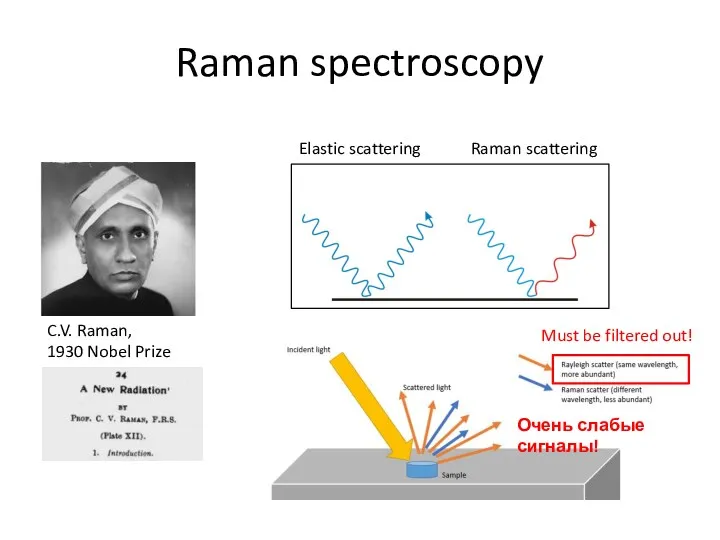
Raman spectroscopy
C.V. Raman,
1930 Nobel Prize
Elastic scattering
Raman scattering
Must be filtered out!
Очень слабые
Raman spectroscopy
C.V. Raman,
1930 Nobel Prize
Elastic scattering
Raman scattering
Must be filtered out!
Очень слабые
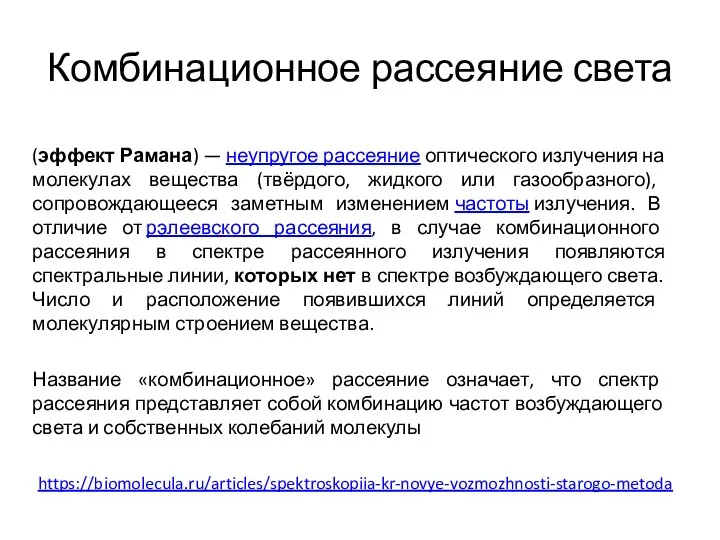
Комбинационное рассеяние света
(эффект Рамана) — неупругое рассеяние оптического излучения на молекулах вещества (твёрдого, жидкого
Комбинационное рассеяние света
(эффект Рамана) — неупругое рассеяние оптического излучения на молекулах вещества (твёрдого, жидкого
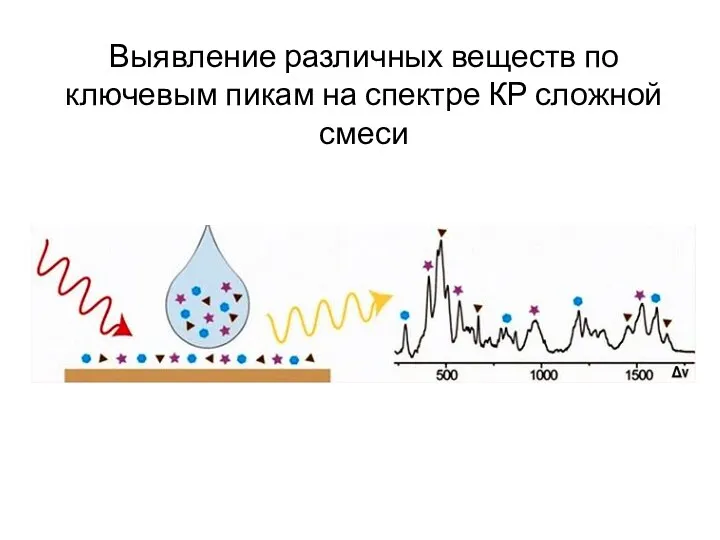
Выявление различных веществ по ключевым пикам на спектре КР сложной смеси
Выявление различных веществ по ключевым пикам на спектре КР сложной смеси
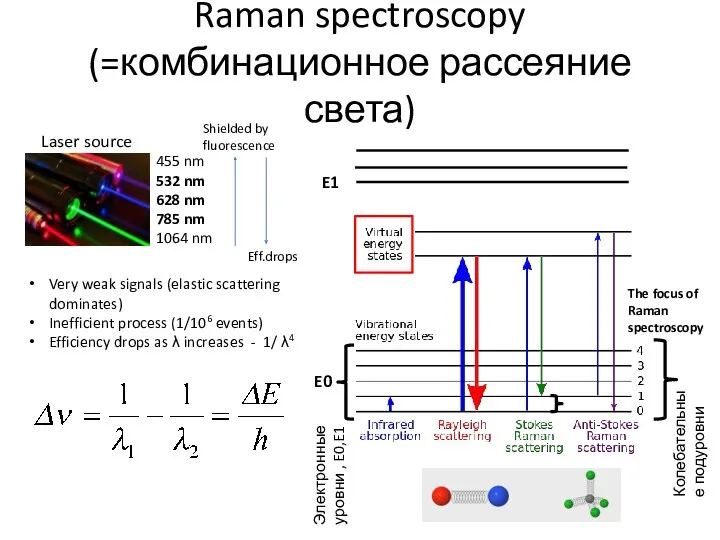
Raman spectroscopy (=комбинационное рассеяние света)
The focus of Raman spectroscopy
Very weak signals
Raman spectroscopy (=комбинационное рассеяние света)
The focus of Raman spectroscopy
Very weak signals
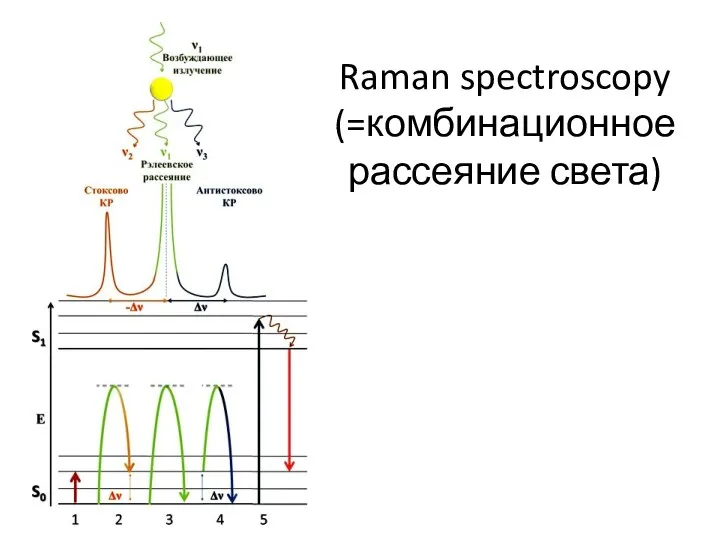
Raman spectroscopy (=комбинационное рассеяние света)
Raman spectroscopy (=комбинационное рассеяние света)
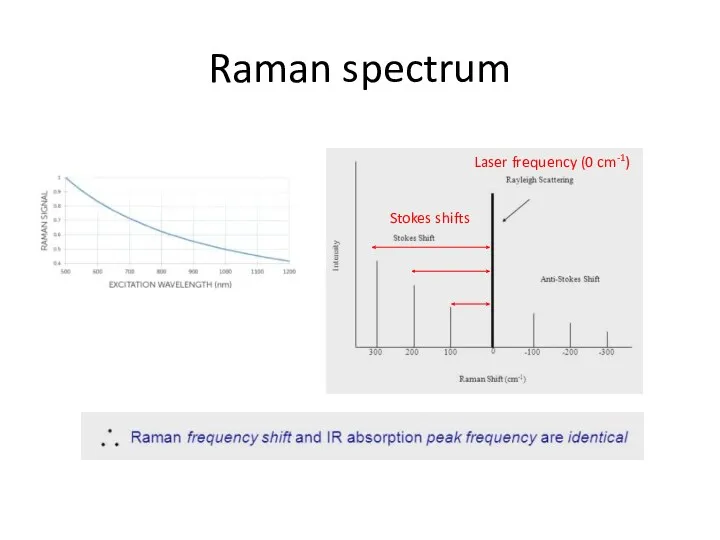
Raman spectrum
Laser frequency (0 cm-1)
Stokes shifts
Raman spectrum
Laser frequency (0 cm-1)
Stokes shifts
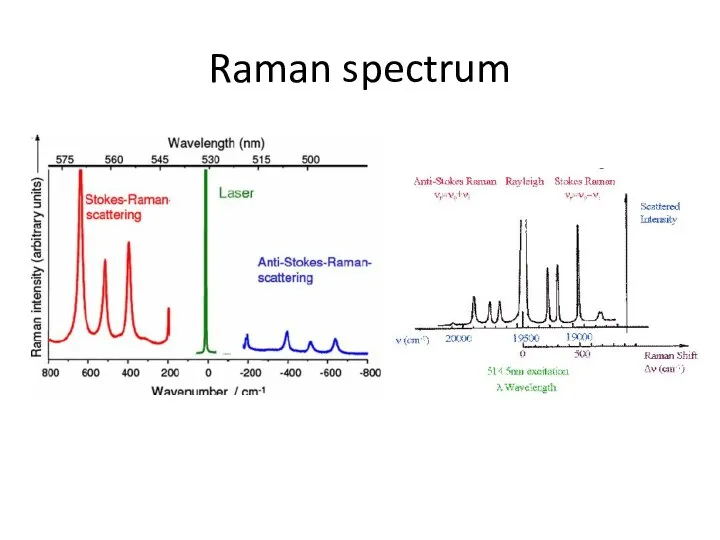
Raman spectrum
Raman spectrum
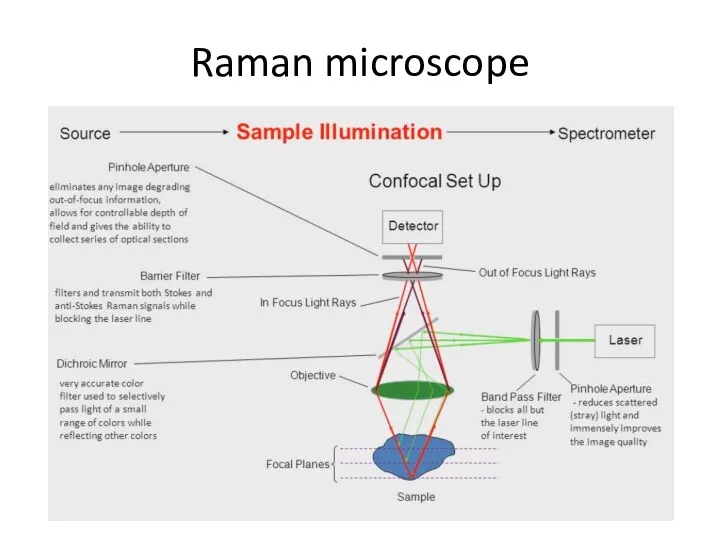
Raman microscope
Raman microscope
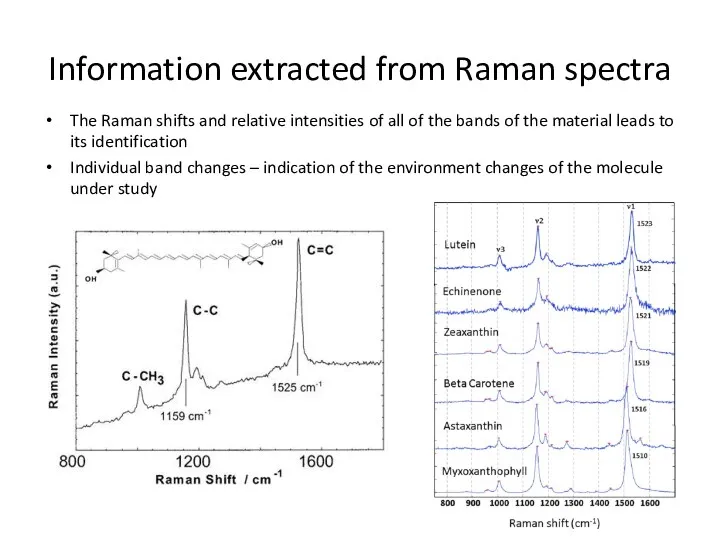
Information extracted from Raman spectra
The Raman shifts and relative intensities of
Information extracted from Raman spectra
The Raman shifts and relative intensities of
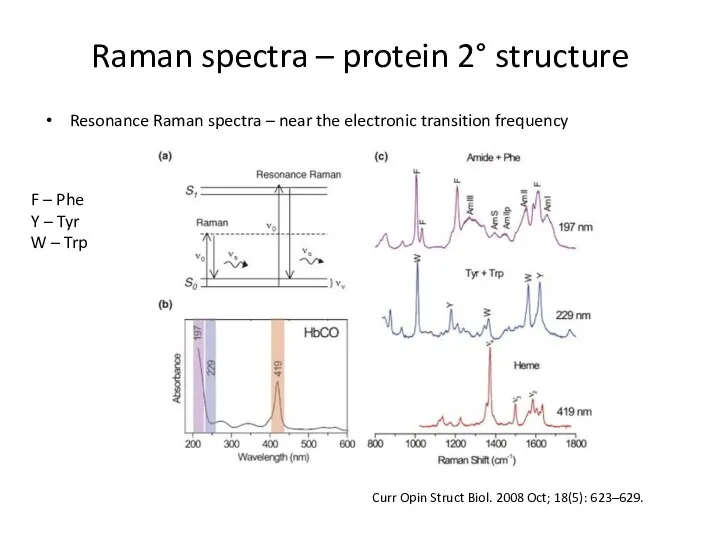
Raman spectra – protein 2° structure
Resonance Raman spectra – near the
Raman spectra – protein 2° structure
Resonance Raman spectra – near the
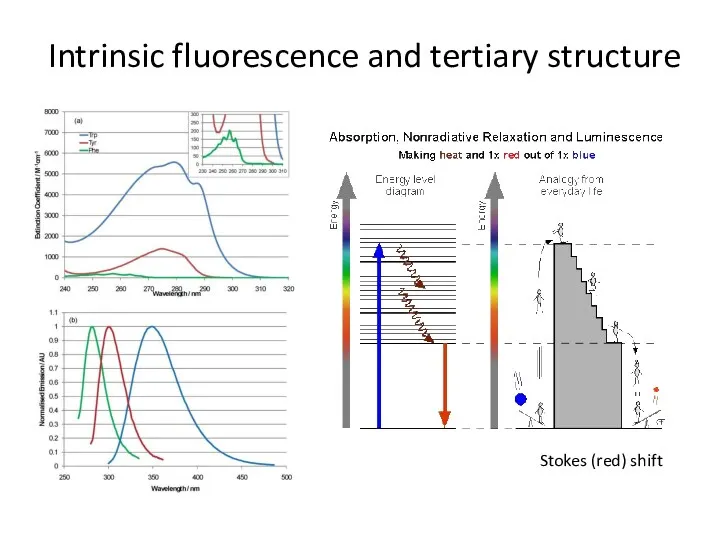
Intrinsic fluorescence and tertiary structure
Stokes (red) shift
Intrinsic fluorescence and tertiary structure
Stokes (red) shift
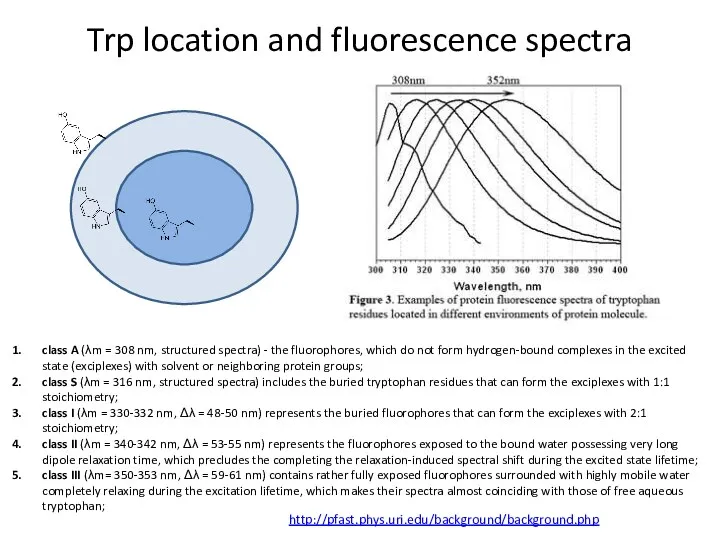
Trp location and fluorescence spectra
class A (λm = 308 nm, structured
Trp location and fluorescence spectra
class A (λm = 308 nm, structured
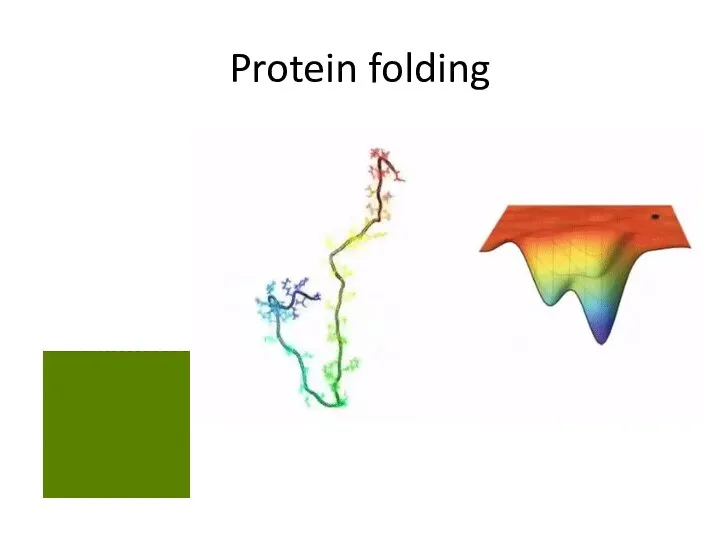
Protein folding
Protein folding
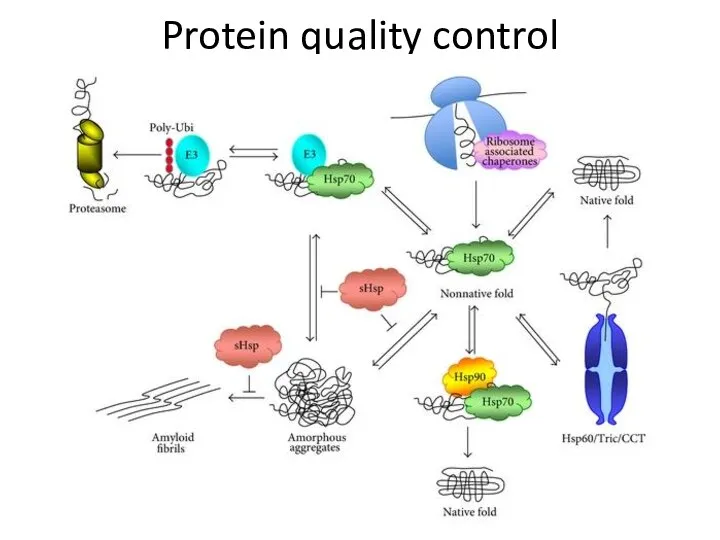
Protein quality control
Protein quality control
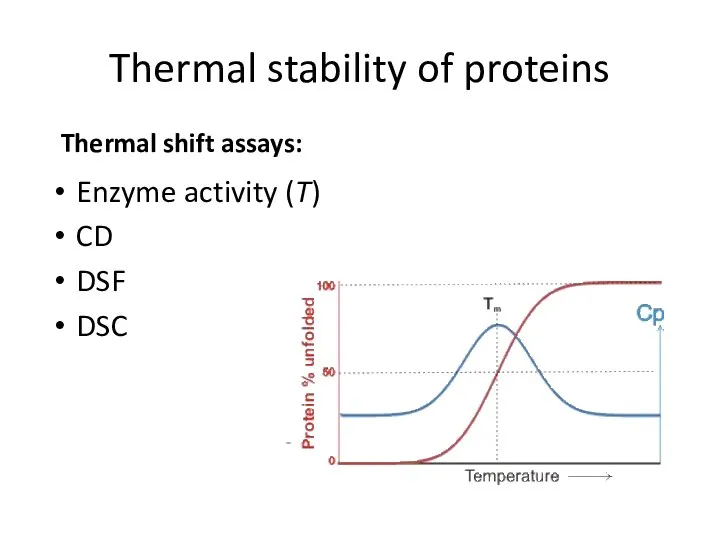
Thermal stability of proteins
Enzyme activity (T)
CD
DSF
DSC
Thermal shift assays:
Thermal stability of proteins
Enzyme activity (T)
CD
DSF
DSC
Thermal shift assays:
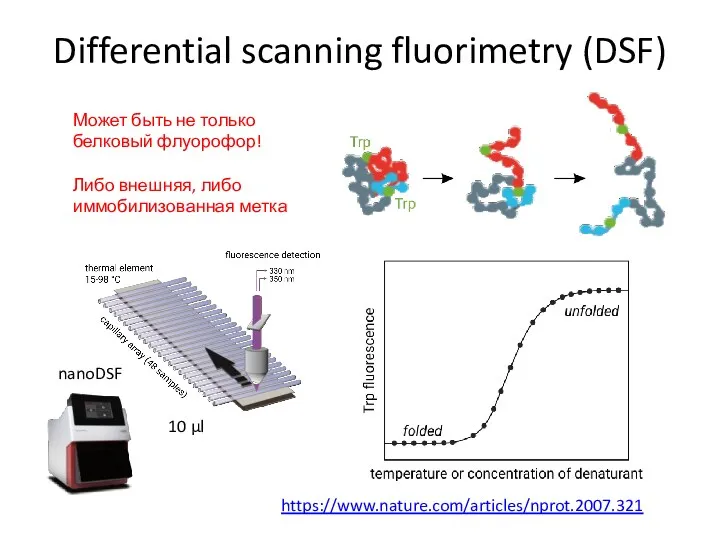
Differential scanning fluorimetry (DSF)
Может быть не только белковый флуорофор!
Либо внешняя, либо
Differential scanning fluorimetry (DSF)
Может быть не только белковый флуорофор!
Либо внешняя, либо
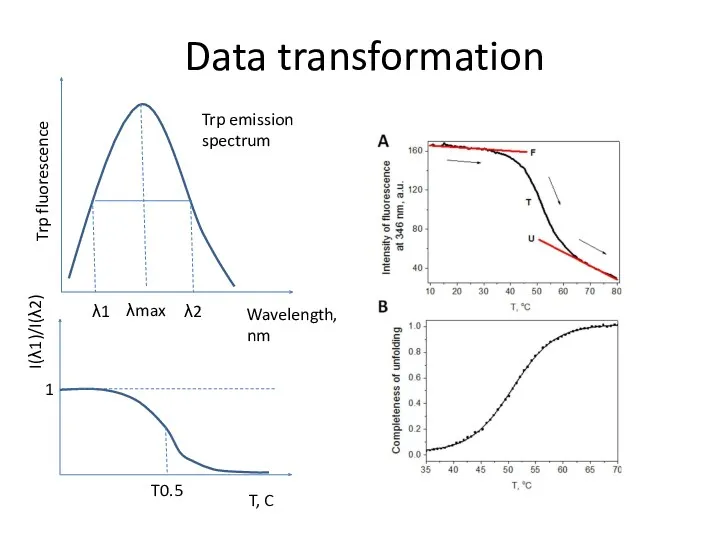
Data transformation
Trp fluorescence
Wavelength, nm
λ1
λ2
λmax
I(λ1)/I(λ2)
T, C
Trp emission spectrum
T0.5
1
Data transformation
Trp fluorescence
Wavelength, nm
λ1
λ2
λmax
I(λ1)/I(λ2)
T, C
Trp emission spectrum
T0.5
1
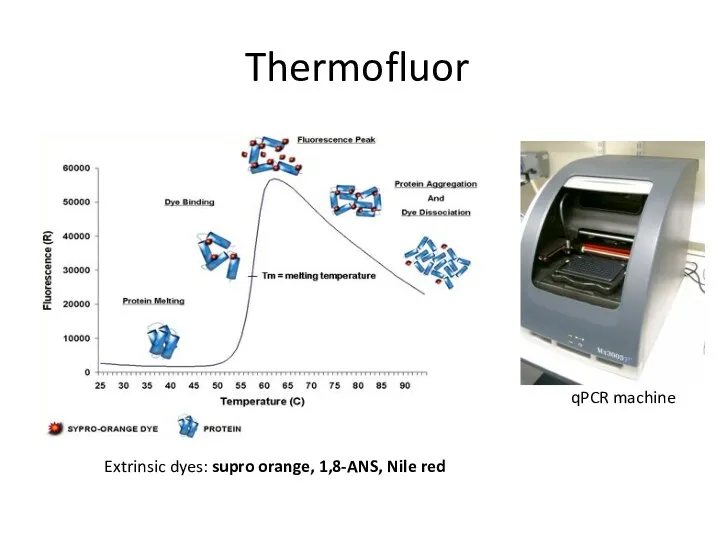
Thermofluor
Extrinsic dyes: supro orange, 1,8-ANS, Nile red
qPCR machine
Thermofluor
Extrinsic dyes: supro orange, 1,8-ANS, Nile red
qPCR machine
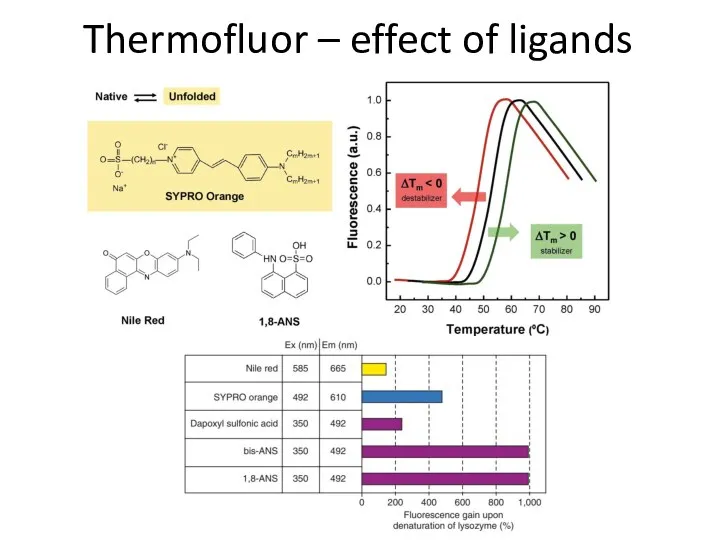
Thermofluor – effect of ligands
Thermofluor – effect of ligands
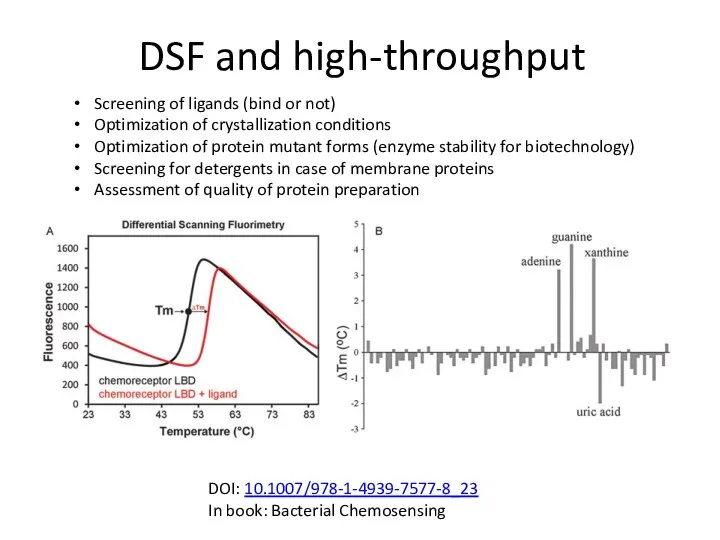
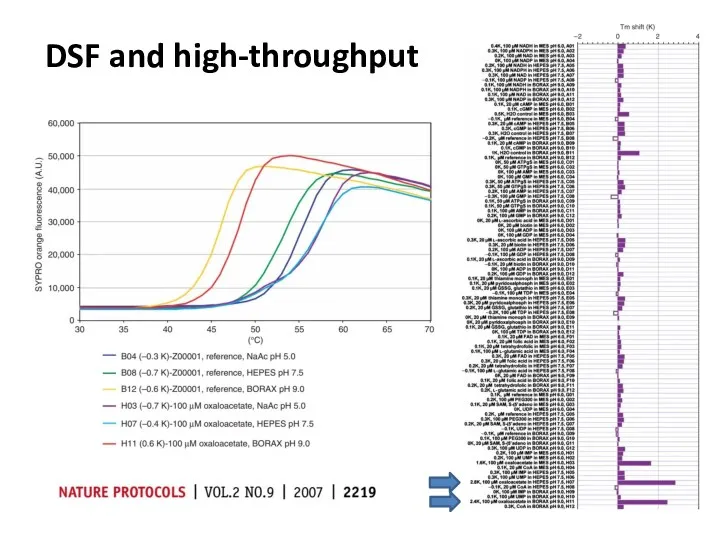
DSF and high-throughput
DOI: 10.1007/978-1-4939-7577-8_23
In book: Bacterial Chemosensing
Screening of ligands (bind or not)
Optimization
DSF and high-throughput
DOI: 10.1007/978-1-4939-7577-8_23
In book: Bacterial Chemosensing
Screening of ligands (bind or not)
Optimization
DSF and high-throughput
DSF and high-throughput
Дифференциальная сканирующая калориметрия (ДСК, DSC)
Дифференциальная сканирующая калориметрия (ДСК, DSC)
Теплота и калория
Количество энергии, которое теряет или получает тело в течение
Теплота и калория
Количество энергии, которое теряет или получает тело в течение
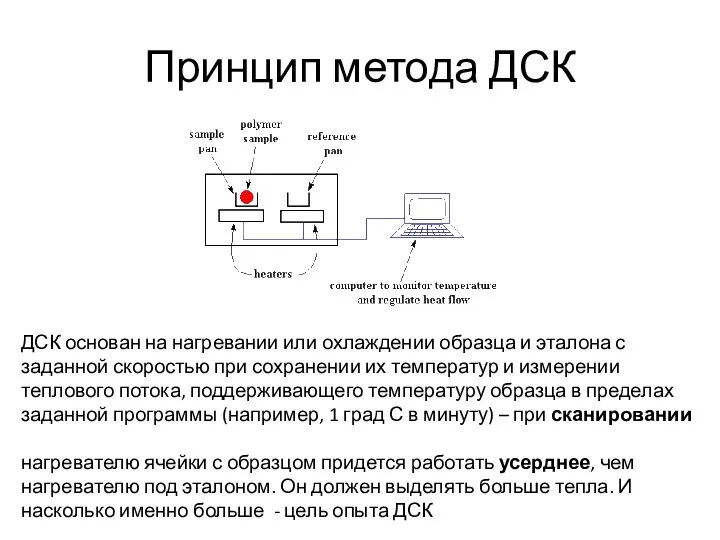
Принцип метода ДСК
ДСК основан на нагревании или охлаждении образца и эталона
Принцип метода ДСК
ДСК основан на нагревании или охлаждении образца и эталона
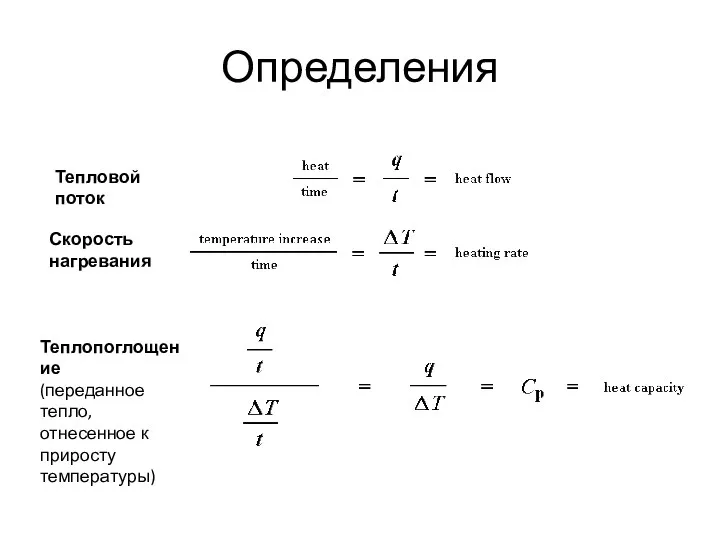
Определения
Тепловой поток
Скорость нагревания
Теплопоглощение
(переданное тепло, отнесенное к приросту температуры)
Определения
Тепловой поток
Скорость нагревания
Теплопоглощение
(переданное тепло, отнесенное к приросту температуры)
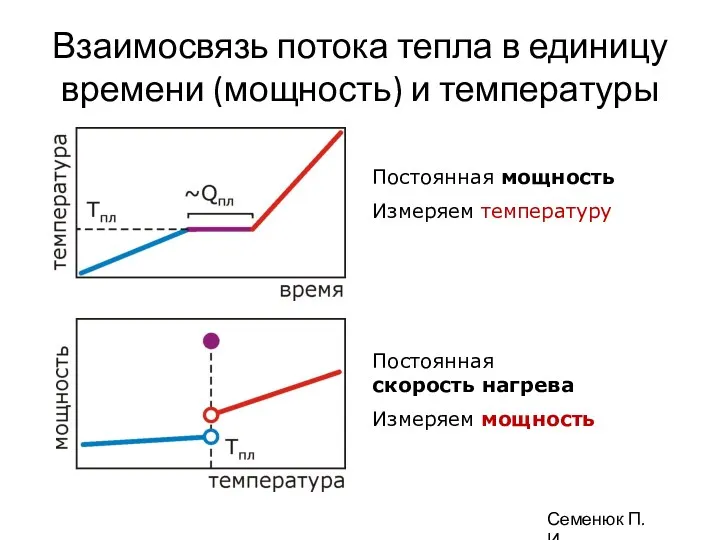
Взаимосвязь потока тепла в единицу времени (мощность) и температуры
Постоянная мощность
Измеряем температуру
Постоянная
скорость
Взаимосвязь потока тепла в единицу времени (мощность) и температуры
Постоянная мощность
Измеряем температуру
Постоянная скорость
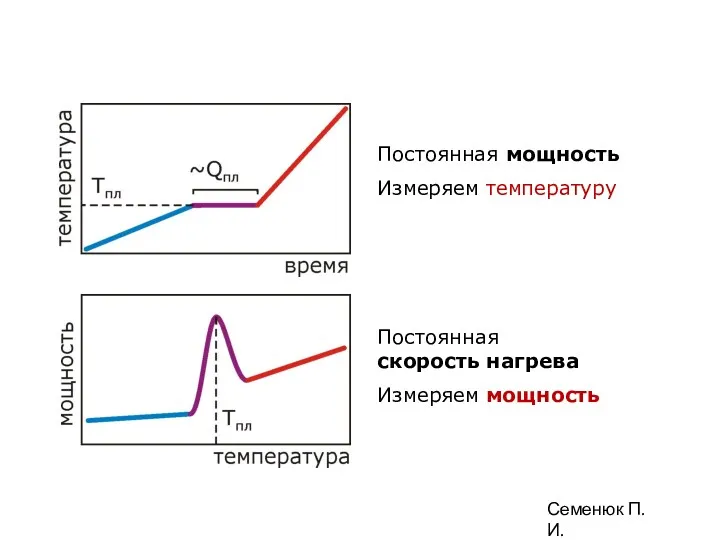
Постоянная мощность
Измеряем температуру
Постоянная
скорость нагрева
Измеряем мощность
Семенюк П.И.
Постоянная мощность
Измеряем температуру
Постоянная
скорость нагрева
Измеряем мощность
Семенюк П.И.
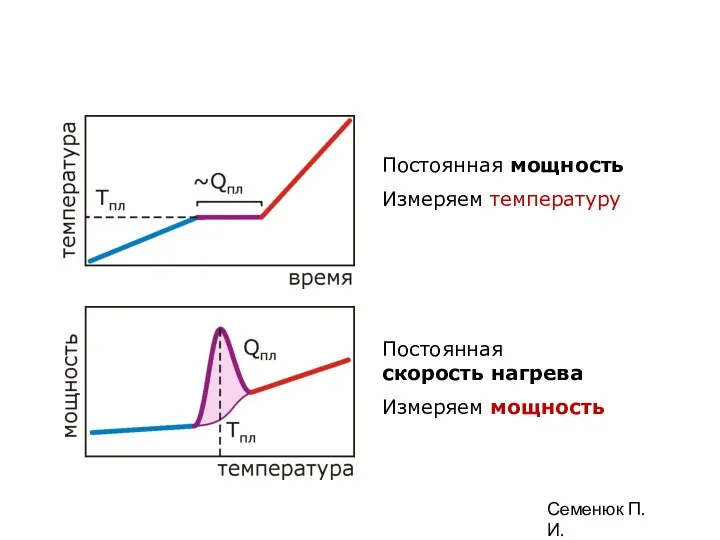
Постоянная мощность
Измеряем температуру
Постоянная
скорость нагрева
Измеряем мощность
Семенюк П.И.
Постоянная мощность
Измеряем температуру
Постоянная
скорость нагрева
Измеряем мощность
Семенюк П.И.
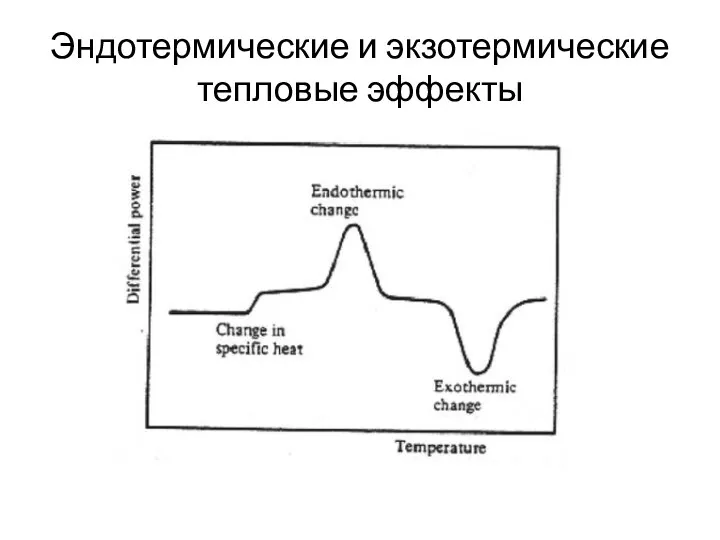
Эндотермические и экзотермические тепловые эффекты
Эндотермические и экзотермические тепловые эффекты
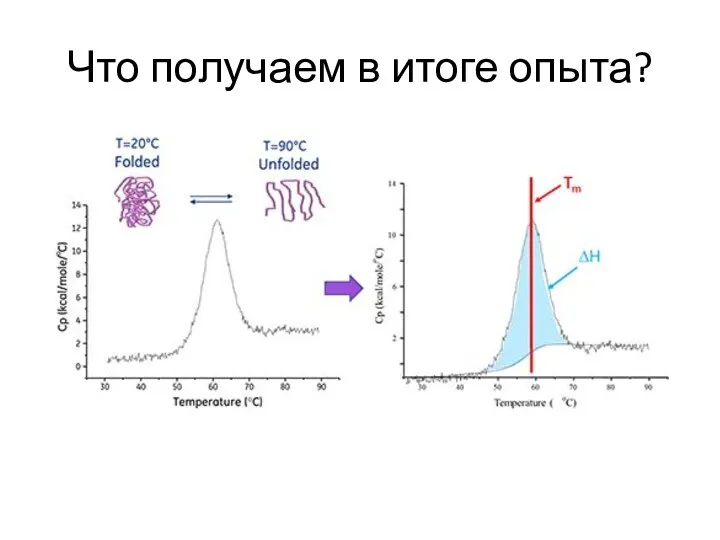
Что получаем в итоге опыта?
Что получаем в итоге опыта?
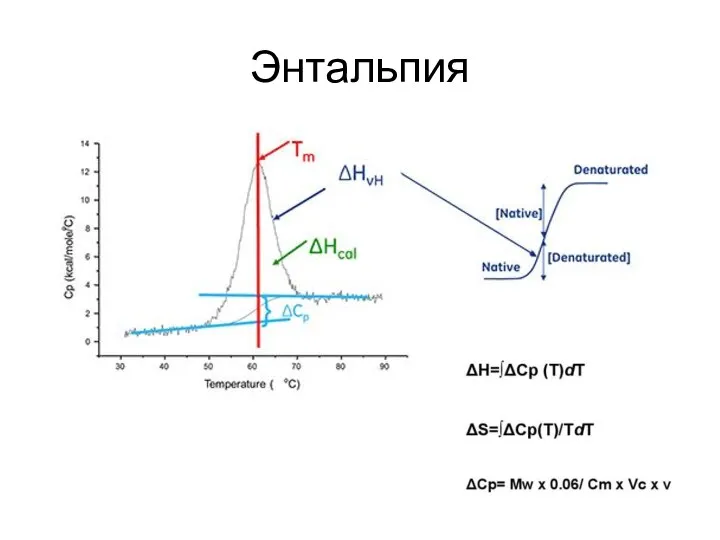
Энтальпия
Энтальпия
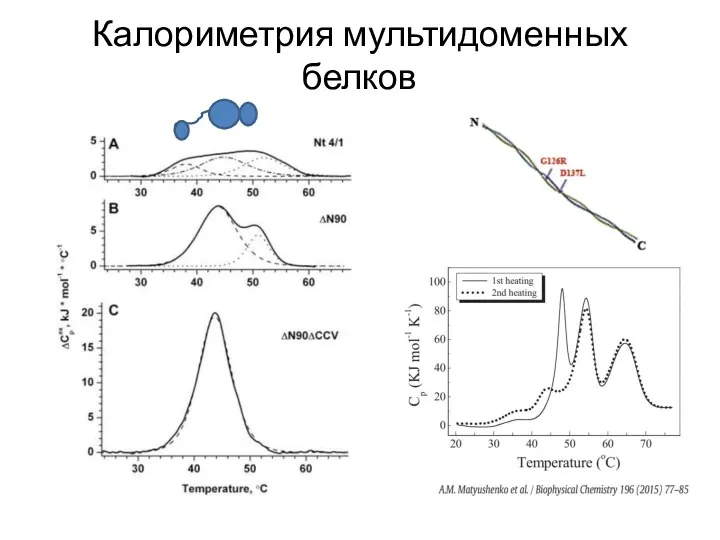
Калориметрия мультидоменных белков
Калориметрия мультидоменных белков
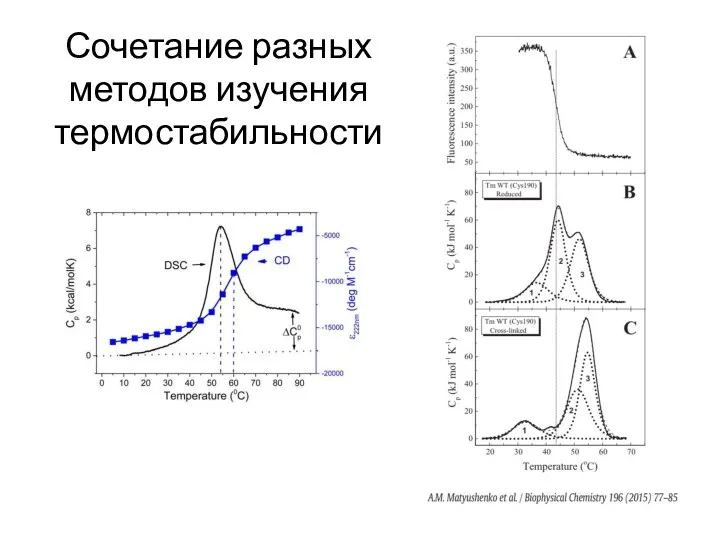
Сочетание разных методов изучения термостабильности
Сочетание разных методов изучения термостабильности
 Нанокаталіз. Активність каталізатора
 Закономерности изменения свойств химических элементов
 Инструментальные методы исследования органических веществ
 Alkynes
 Мұнайды өңдеудің химиялық процестерінің теориялық негіздері
 Сера. Аллотропные модификации
 Атомы и молекулы. Простые и сложные вещества (8 класс)
 Функціональні матеріали для високоенергетичної електроніки. (Лекція 2)
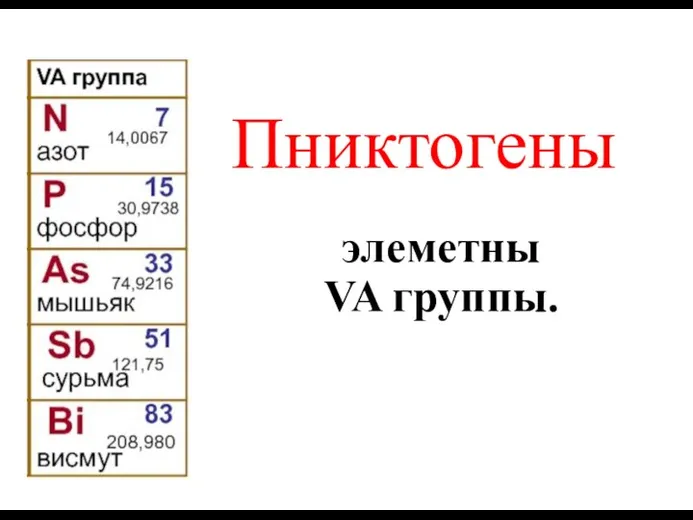 Пниктогены элеметны VA группы
 Концентраційні межі поширення полум'я. Лекція 7
 Эмульсиялардың тұрақтылығына полиэтиленгликоль-баз композицияларының әсері
 Об изучении окислительно-восстановительных реакций в школьном курсе химии. Степени окисления атомов и формулы веществ
 Ионы. Определение кислотности раствора
 Алюминий
 Органические вещества. Валентность. Теория химического строения
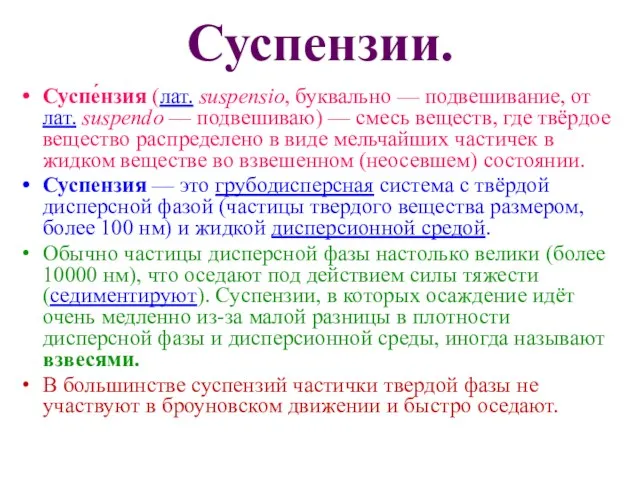 Суспензии: получение, свойства
 Знаки химических элементов. Периодическая система химических элементов
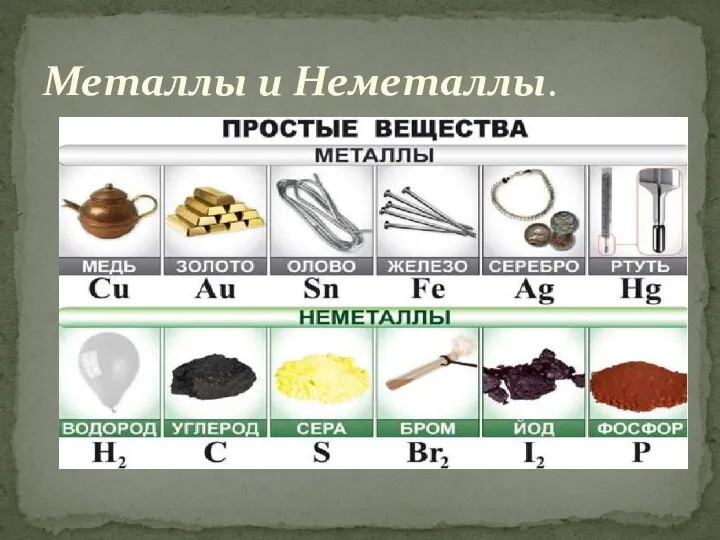 Металлы и неметаллы
 Галогены. Физические свойства галогенов
 Платина. Физические и химические свойства
 Гомополисахариды (углеводы растений)
 Аллотропные модификации алмаза
 Атом. Модели строения атома
 Амфотерные оксиды и гидроксиды. 8 класс
 Біріншілік алкилсульфаттар және алкилэтоксисульфаттарды алу
 Кремний и его соединения
 Ансамбль пор в реальном твердом теле
 Карбоновые кислоты