- Analyzing financial statements: analysis techniques

Содержание
- 2. Liquidity Ratios Liquidity reflects the ability of a company to meet its short-term obligations using assets
- 3. Liquidity Ratios Current assets are often referred to as working capital because these assets represent the
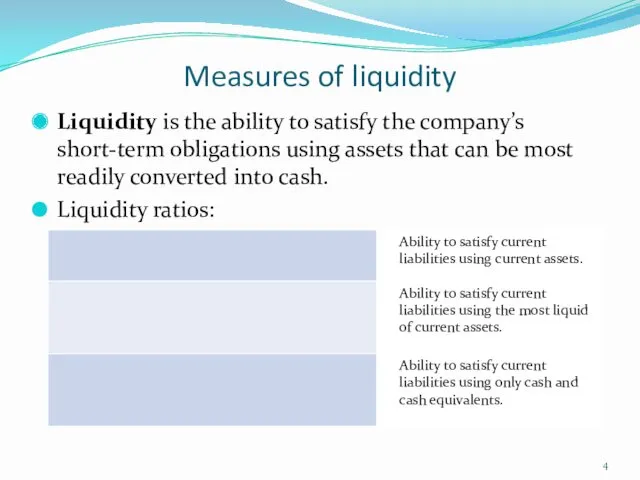
- 4. Measures of liquidity Liquidity is the ability to satisfy the company’s short-term obligations using assets that
- 5. Measures of liquidity Generally, the larger these liquidity ratios, the better the ability of the company
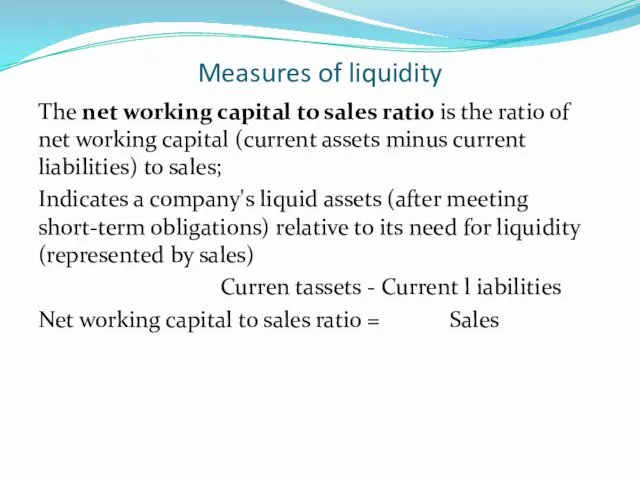
- 6. Measures of liquidity The net working capital to sales ratio is the ratio of net working
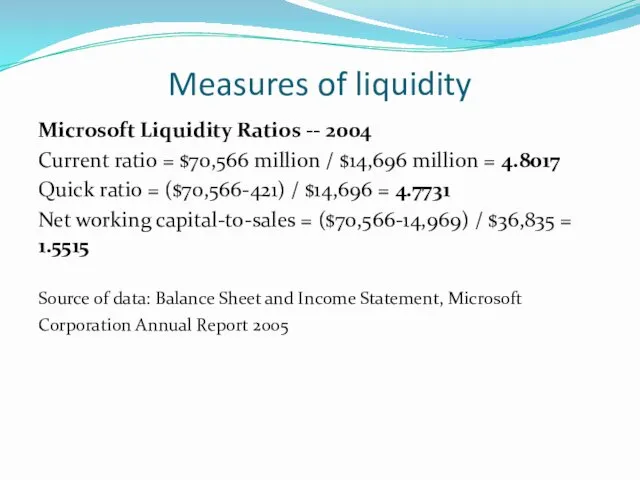
- 7. Measures of liquidity Microsoft Liquidity Ratios -- 2004 Current ratio = $70,566 million / $14,696 million
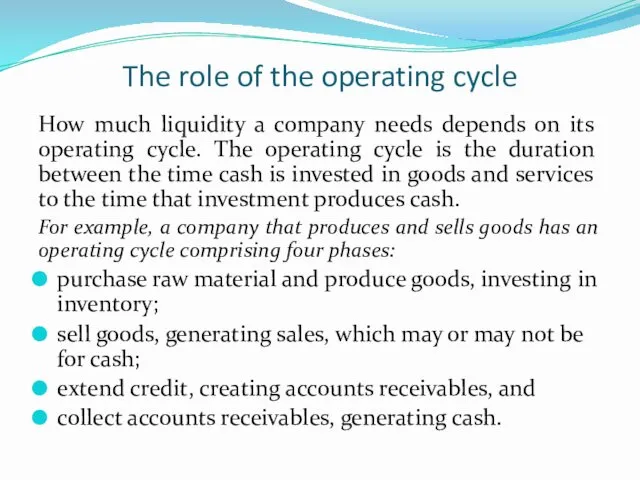
- 9. The role of the operating cycle How much liquidity a company needs depends on its operating
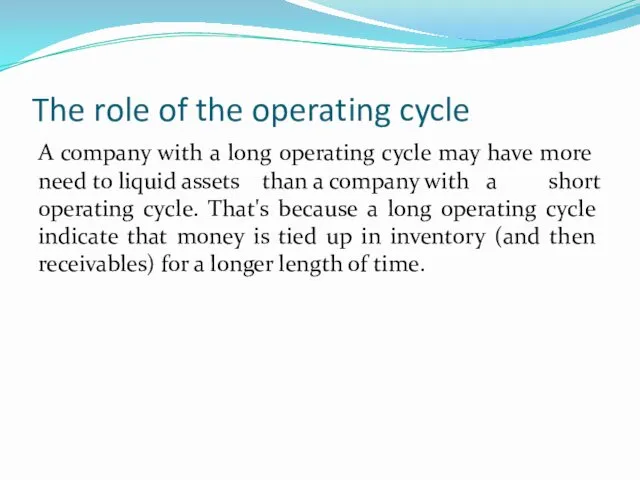
- 10. The role of the operating cycle A company with a long operating cycle may have more
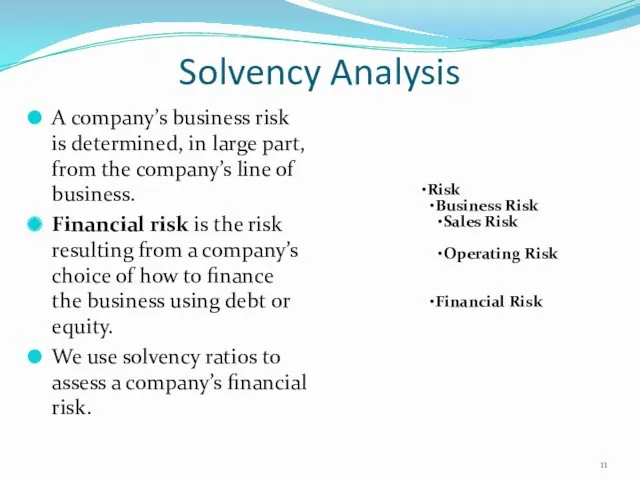
- 11. Solvency Analysis A company’s business risk is determined, in large part, from the company’s line of
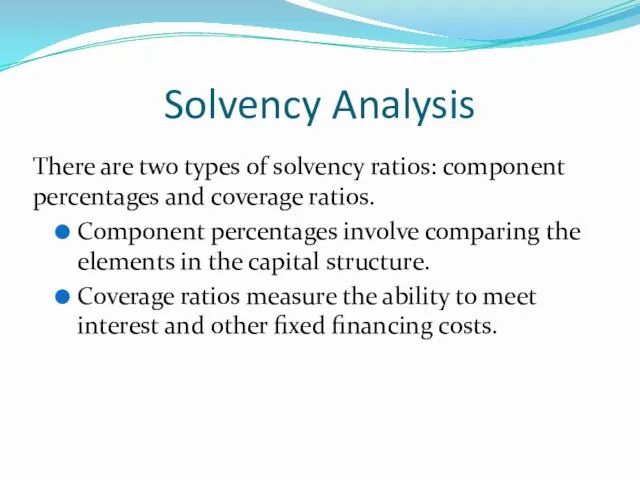
- 12. Solvency Analysis There are two types of solvency ratios: component percentages and coverage ratios. Component percentages
- 14. Скачать презентацию
Liquidity Ratios
Liquidity reflects the ability of a company to meet its
Liquidity Ratios
Liquidity reflects the ability of a company to meet its
Liquidity Ratios
Current assets are often referred to as working capital because
Liquidity Ratios
Current assets are often referred to as working capital because
Measures of liquidity
Liquidity is the ability to satisfy the company’s short-term
Measures of liquidity
Liquidity is the ability to satisfy the company’s short-term
Measures of liquidity
Generally, the larger these liquidity ratios, the better the
Measures of liquidity
Generally, the larger these liquidity ratios, the better the
Measures of liquidity
The net working capital to sales ratio is the
Measures of liquidity
The net working capital to sales ratio is the
Measures of liquidity
Microsoft Liquidity Ratios -- 2004
Current ratio = $70,566
Measures of liquidity
Microsoft Liquidity Ratios -- 2004
Current ratio = $70,566
The role of the operating cycle
How much liquidity a company needs
The role of the operating cycle
How much liquidity a company needs
The role of the operating cycle
A company with a long operating
The role of the operating cycle
A company with a long operating
Solvency Analysis
A company’s business risk is determined, in large part, from
Solvency Analysis
A company’s business risk is determined, in large part, from
Solvency Analysis
There are two types of solvency ratios: component percentages and
Solvency Analysis
There are two types of solvency ratios: component percentages and
Похожие презентации
 Министерство финансов Калининградской области Программа Повышение финансовой грамотности населения
 Налоговая система в РФ
 Развитие дискаунтеров на розничном рынке (зарубежная практика)
 Fitting the Pieces Together
 Управление денежными средствами
 Loans and Credits
 Понятие долгосрочных инвестиций и капитального строительства. Участники капитального строительства
 Оборотные средства: состав и классификация
 Цели, функции, основные направления и процедуры внутреннего аудита цикла затрат
 Развитие финансово-кредитных отношений в XVIII веке. (Тема 5)
 Методологические принципы федерального статистического наблюдения за затратами на производство и реализацию товаров
 Понятие риск-аппетита и толерантности к риску, основные отличия использования
 Правовое регулирование расчетов
 Особенности оценки рыночной стоимости коммерческого банка
 Анализ финансового состояния ООО Весна и разработка мероприятий по его улучшению
 Принципы организации финансов организаций (предприятий)
 Introduction to business. Lecture 3
 Фото валют разных стран
 Международные стандарты финансовой отчетности
 Развитие некоммерческого сектора в Самарской области на основе современных тенденций
 Памятка для клиентов ВСП
 Экологическое право. Плата за природные ресурсы в России
 Меншікті капиталды қаржылық талдау. Лекция 6
 Финансовый сервис. Ипотека. Финансирование бизнеса
 Основы аудита
 Налоговая система России
 Программы: международная кредитная мобильность и совместные магистерские степени (Key Action 1). Возможности для Беларуси