- Capital Budgeting and Risk

Содержание
- 2. Topics Covered Company and Project Costs of Capital Measuring the Cost of Equity Capital Structure and
- 3. Company Cost of Capital A firm’s value can be stated as the sum of the value
- 4. Company Cost of Capital
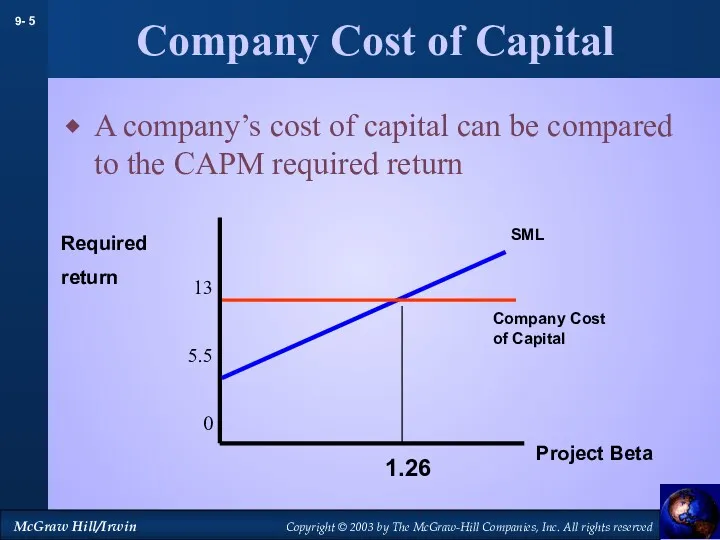
- 5. Company Cost of Capital A company’s cost of capital can be compared to the CAPM required
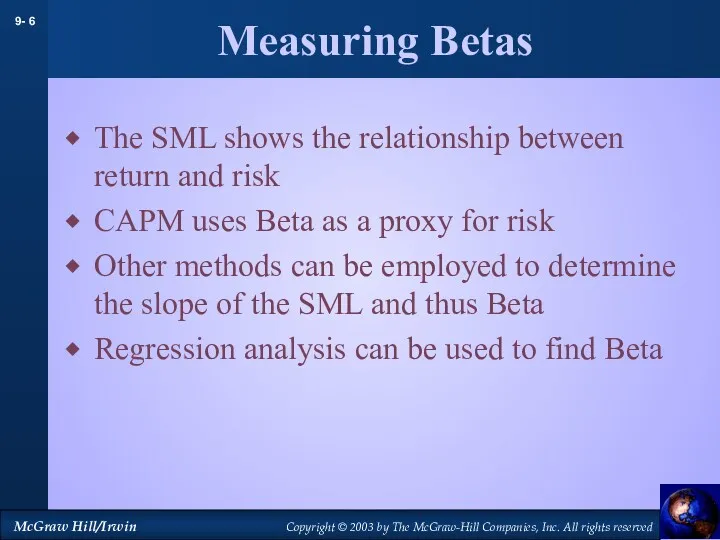
- 6. Measuring Betas The SML shows the relationship between return and risk CAPM uses Beta as a
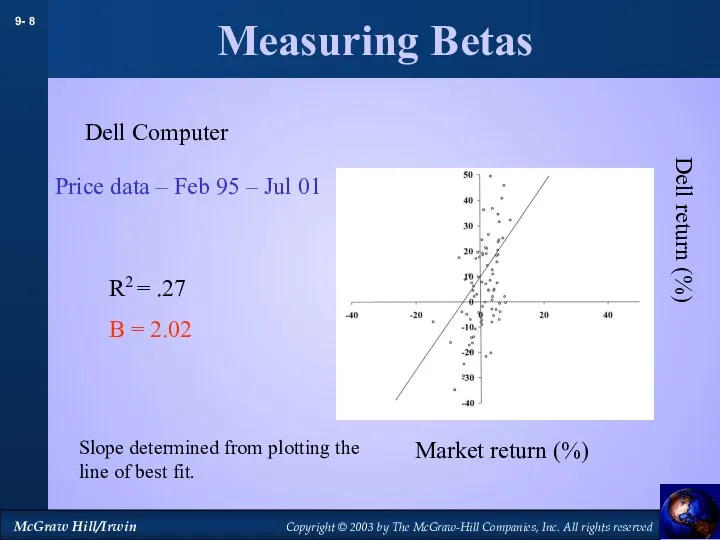
- 7. Measuring Betas Dell Computer Slope determined from plotting the line of best fit. Price data –
- 8. Measuring Betas Dell Computer Slope determined from plotting the line of best fit. Price data –
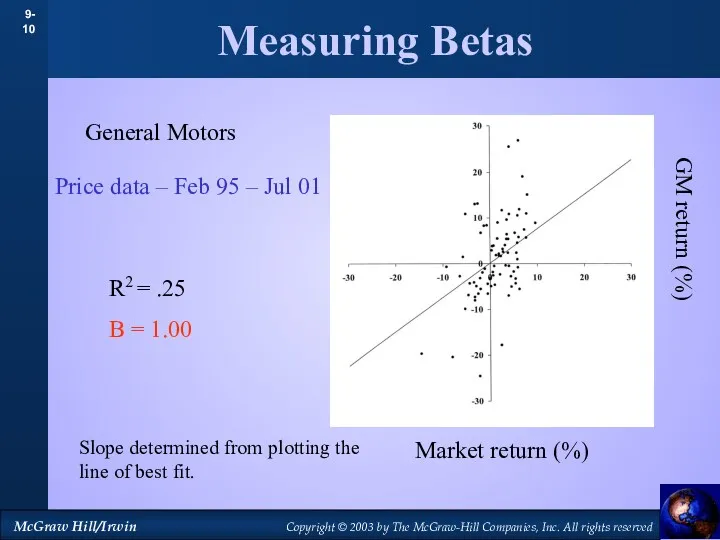
- 9. Measuring Betas General Motors Slope determined from plotting the line of best fit. Price data –
- 10. Measuring Betas General Motors Slope determined from plotting the line of best fit. Price data –
- 11. Measuring Betas Exxon Mobil Slope determined from plotting the line of best fit. Price data –
- 12. Measuring Betas Exxon Mobil Slope determined from plotting the line of best fit. Price data –
- 13. Beta Stability % IN SAME % WITHIN ONE RISK CLASS 5 CLASS 5 CLASS YEARS LATER
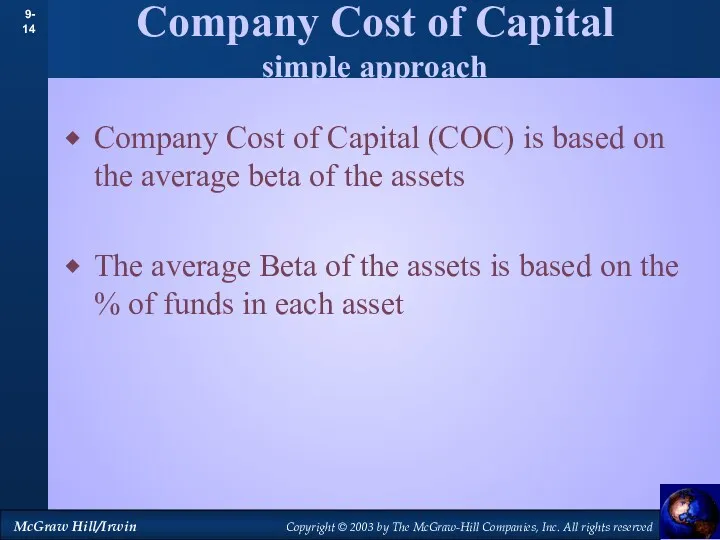
- 14. Company Cost of Capital simple approach Company Cost of Capital (COC) is based on the average
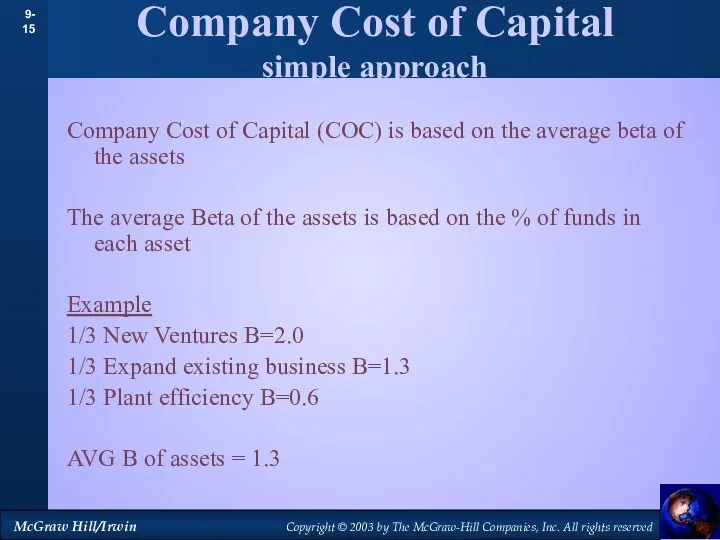
- 15. Company Cost of Capital simple approach Company Cost of Capital (COC) is based on the average
- 16. Capital Structure - the mix of debt & equity within a company Expand CAPM to include
- 17. Capital Structure & COC COC = rportfolio = rassets rassets = WACC = rdebt (D) +
- 18. Capital Structure & COC Expected return (%) Bdebt Bassets Bequity Rrdebt=8 Rassets=12.2 Requity=15 Expected Returns and
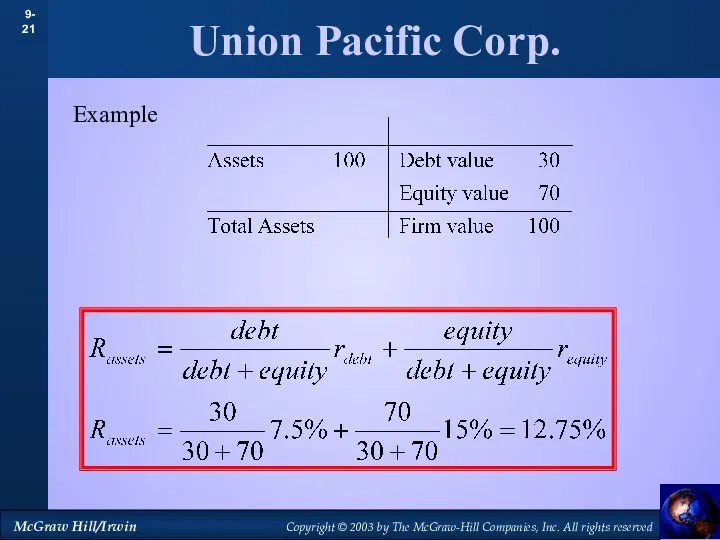
- 19. Union Pacific Corp. Requity = Return on Stock = 15% Rdebt = YTM on bonds =
- 20. Union Pacific Corp.
- 21. Union Pacific Corp. Example
- 22. International Risk Source: The Brattle Group, Inc. σ Ratio - Ratio of standard deviations, country index
- 23. Asset Betas
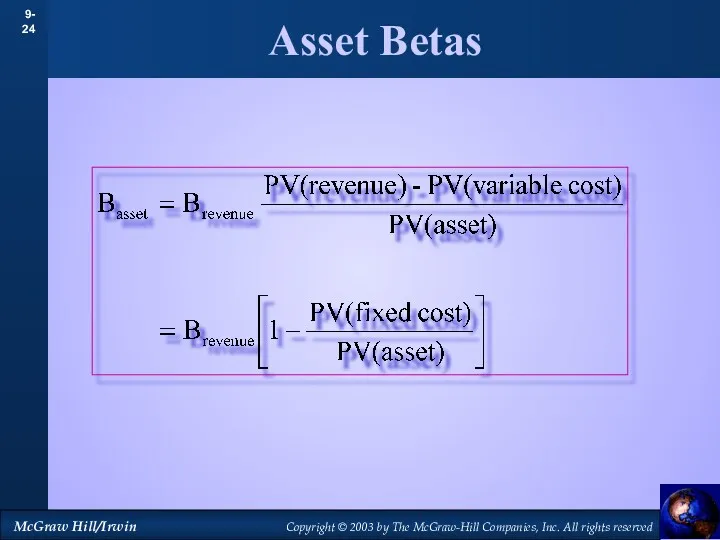
- 24. Asset Betas
- 25. Risk,DCF and CEQ
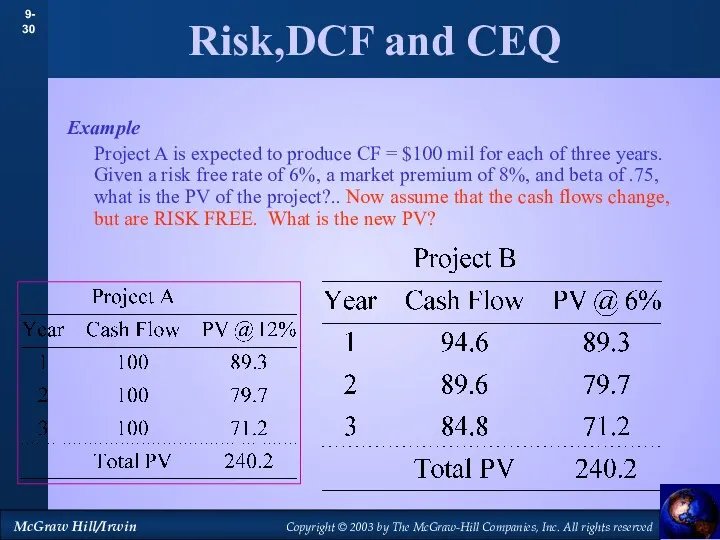
- 26. Risk,DCF and CEQ Example Project A is expected to produce CF = $100 mil for each
- 27. Risk,DCF and CEQ Example Project A is expected to produce CF = $100 mil for each
- 28. Risk,DCF and CEQ Example Project A is expected to produce CF = $100 mil for each
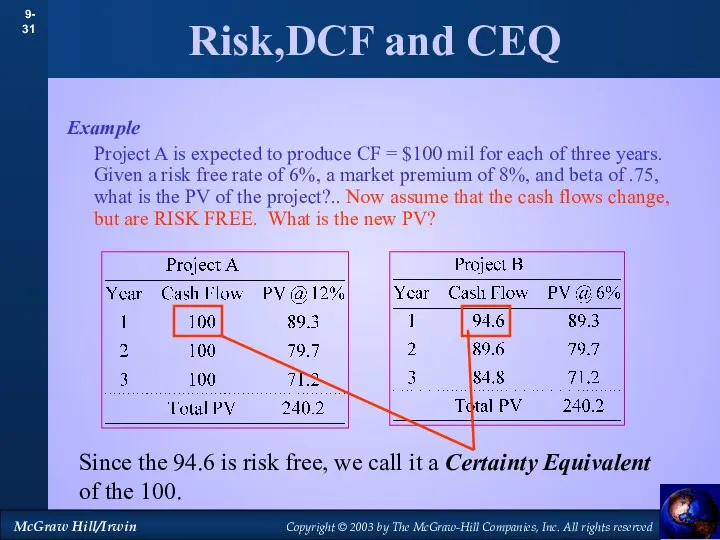
- 29. Risk,DCF and CEQ Example Project A is expected to produce CF = $100 mil for each
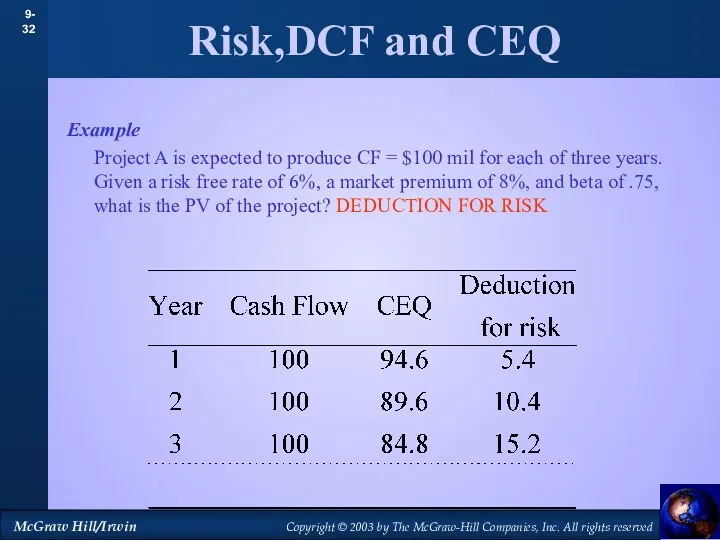
- 30. Risk,DCF and CEQ Example Project A is expected to produce CF = $100 mil for each
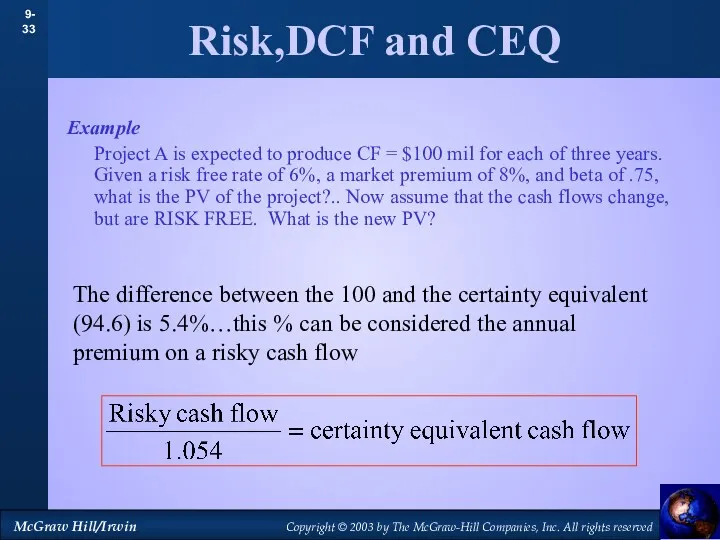
- 31. Risk,DCF and CEQ Example Project A is expected to produce CF = $100 mil for each
- 32. Risk,DCF and CEQ Example Project A is expected to produce CF = $100 mil for each
- 33. Risk,DCF and CEQ Example Project A is expected to produce CF = $100 mil for each
- 35. Скачать презентацию

Topics Covered
Company and Project Costs of Capital
Measuring the Cost of Equity
Capital
Topics Covered
Company and Project Costs of Capital
Measuring the Cost of Equity
Capital
Company Cost of Capital
A firm’s value can be stated as the
Company Cost of Capital
A firm’s value can be stated as the

Company Cost of Capital
Company Cost of Capital
Company Cost of Capital
A company’s cost of capital can be compared
Company Cost of Capital
A company’s cost of capital can be compared
Measuring Betas
The SML shows the relationship between return and risk
CAPM uses
Measuring Betas
The SML shows the relationship between return and risk
CAPM uses

Measuring Betas
Dell Computer
Slope determined from plotting the line of best
Measuring Betas
Dell Computer
Slope determined from plotting the line of best
Measuring Betas
Dell Computer
Slope determined from plotting the line of best
Measuring Betas
Dell Computer
Slope determined from plotting the line of best

Measuring Betas
General Motors
Slope determined from plotting the line of best
Measuring Betas
General Motors
Slope determined from plotting the line of best
Measuring Betas
General Motors
Slope determined from plotting the line of best
Measuring Betas
General Motors
Slope determined from plotting the line of best

Measuring Betas
Exxon Mobil
Slope determined from plotting the line of best
Measuring Betas
Exxon Mobil
Slope determined from plotting the line of best

Measuring Betas
Exxon Mobil
Slope determined from plotting the line of best
Measuring Betas
Exxon Mobil
Slope determined from plotting the line of best
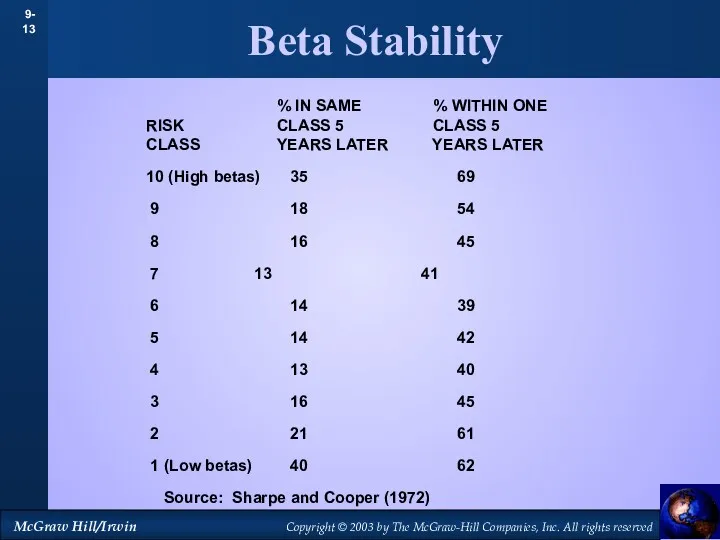
Beta Stability
% IN SAME % WITHIN ONE
RISK CLASS 5
Beta Stability
% IN SAME % WITHIN ONE
RISK CLASS 5
Company Cost of Capital
simple approach
Company Cost of Capital (COC) is based
Company Cost of Capital
simple approach
Company Cost of Capital (COC) is based
Company Cost of Capital
simple approach
Company Cost of Capital (COC) is based
Company Cost of Capital
simple approach
Company Cost of Capital (COC) is based
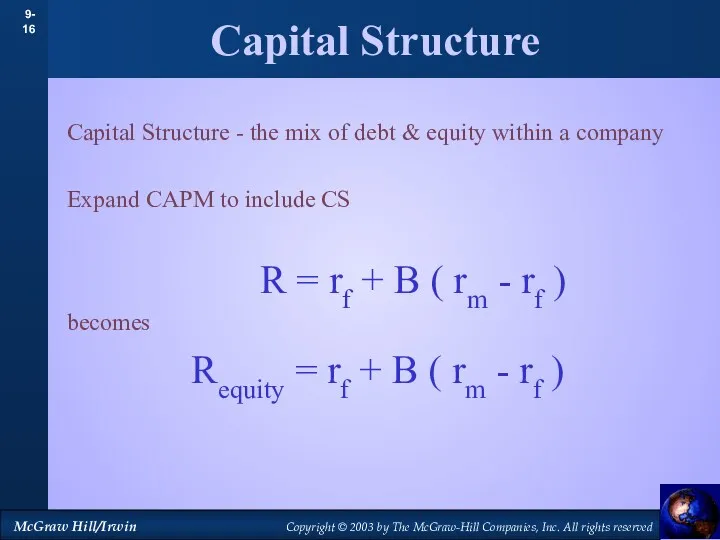
Capital Structure - the mix of debt & equity within a
Capital Structure - the mix of debt & equity within a
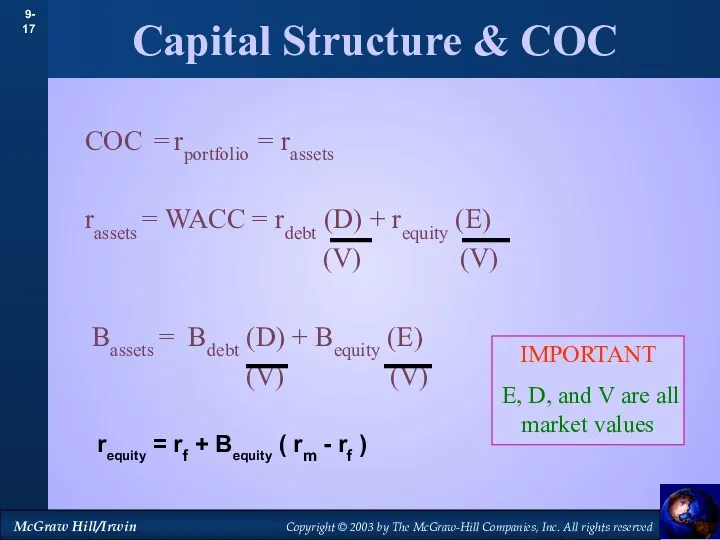
Capital Structure & COC
COC = rportfolio = rassets
rassets = WACC =
Capital Structure & COC
COC = rportfolio = rassets
rassets = WACC =

Capital Structure & COC
Expected return (%)
Bdebt
Bassets
Bequity
Rrdebt=8
Rassets=12.2
Requity=15
Expected Returns and Betas prior to
Capital Structure & COC
Expected return (%)
Bdebt
Bassets
Bequity
Rrdebt=8
Rassets=12.2
Requity=15
Expected Returns and Betas prior to
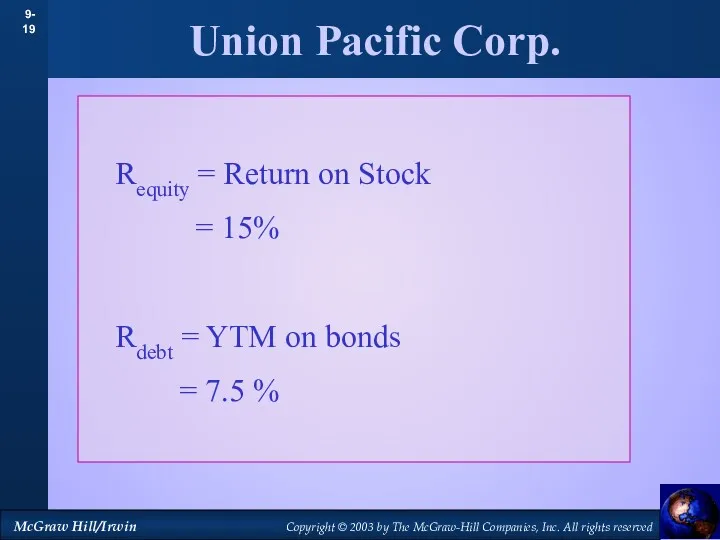
Union Pacific Corp.
Requity = Return on Stock
= 15%
Rdebt = YTM
Union Pacific Corp.
Requity = Return on Stock
= 15%
Rdebt = YTM
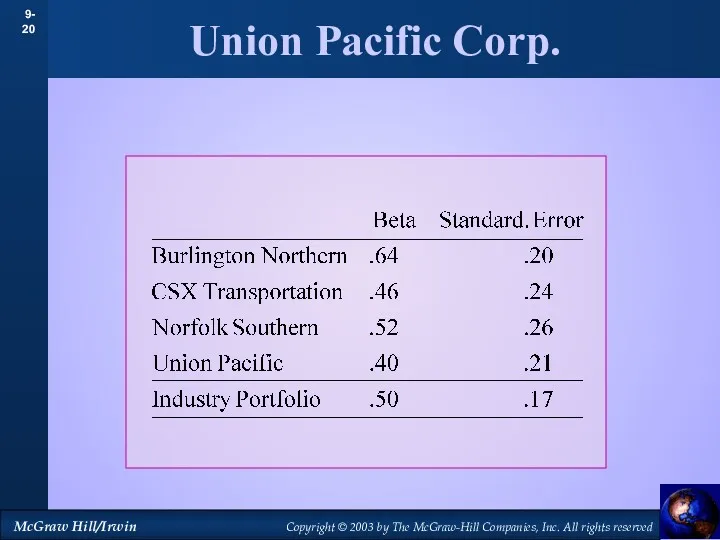
Union Pacific Corp.
Union Pacific Corp.
Union Pacific Corp.
Example
Union Pacific Corp.
Example
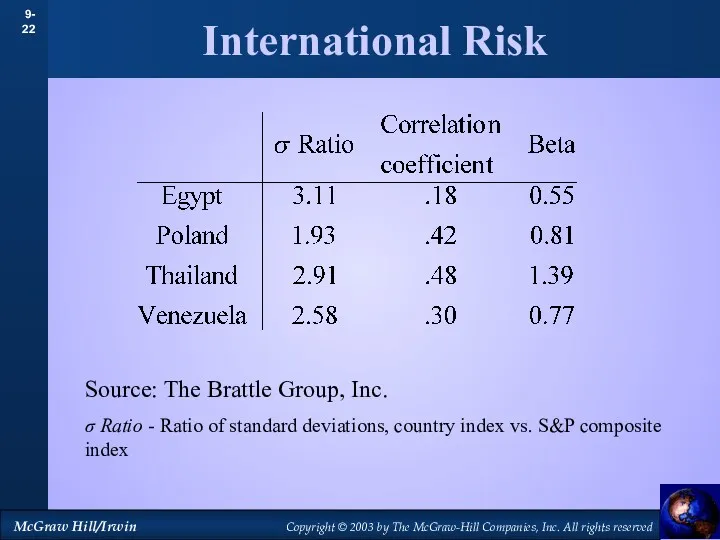
International Risk
Source: The Brattle Group, Inc.
σ Ratio - Ratio of standard
International Risk
Source: The Brattle Group, Inc.
σ Ratio - Ratio of standard
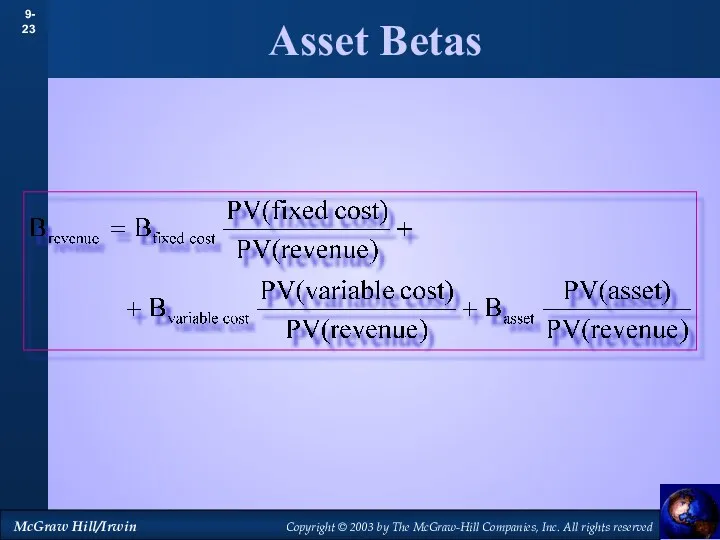
Asset Betas
Asset Betas
Asset Betas
Asset Betas
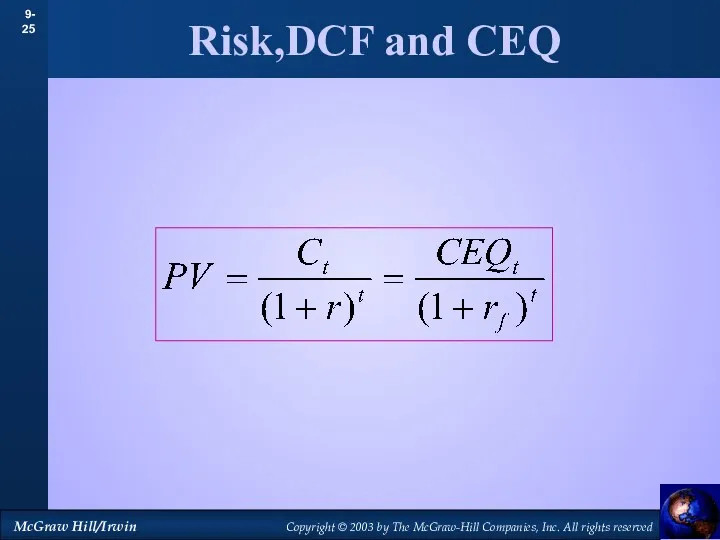
Risk,DCF and CEQ
Risk,DCF and CEQ
Risk,DCF and CEQ
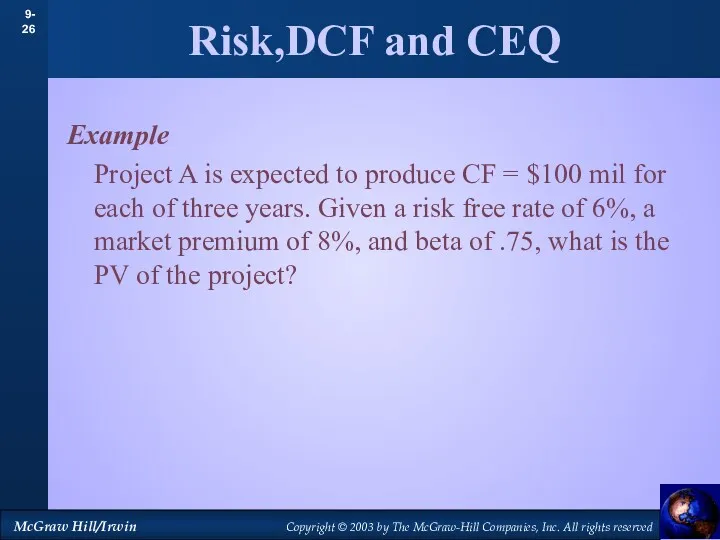
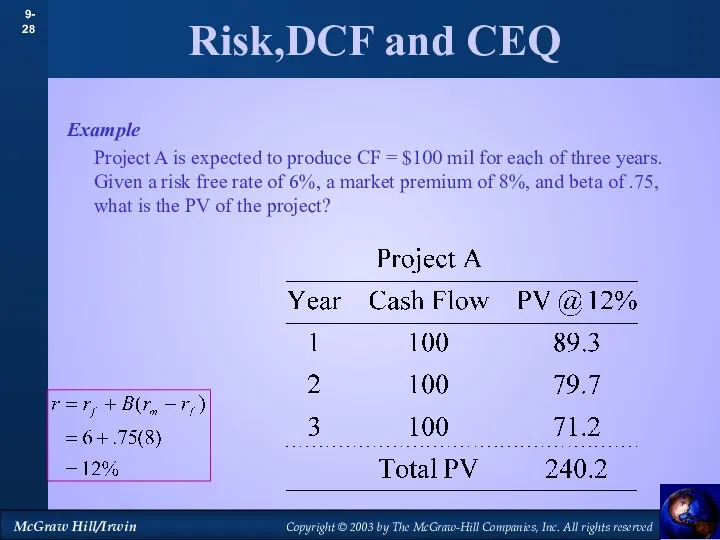
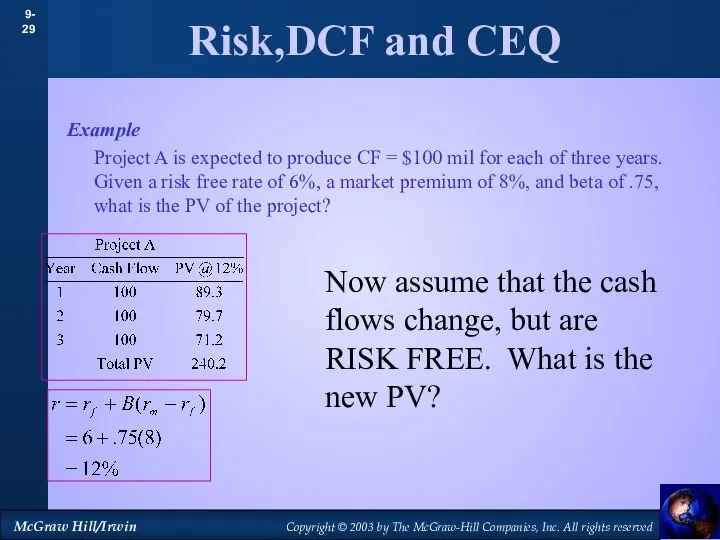
Example
Project A is expected to produce CF = $100
Risk,DCF and CEQ
Example
Project A is expected to produce CF = $100

Risk,DCF and CEQ
Example
Project A is expected to produce CF = $100
Risk,DCF and CEQ
Example
Project A is expected to produce CF = $100
Risk,DCF and CEQ
Example
Project A is expected to produce CF = $100
Risk,DCF and CEQ
Example
Project A is expected to produce CF = $100
Risk,DCF and CEQ
Example
Project A is expected to produce CF = $100
Risk,DCF and CEQ
Example
Project A is expected to produce CF = $100
Risk,DCF and CEQ
Example
Project A is expected to produce CF = $100
Risk,DCF and CEQ
Example
Project A is expected to produce CF = $100
Risk,DCF and CEQ
Example
Project A is expected to produce CF = $100
Risk,DCF and CEQ
Example
Project A is expected to produce CF = $100
Risk,DCF and CEQ
Example
Project A is expected to produce CF = $100
Risk,DCF and CEQ
Example
Project A is expected to produce CF = $100
Risk,DCF and CEQ
Example
Project A is expected to produce CF = $100
Risk,DCF and CEQ
Example
Project A is expected to produce CF = $100
 Тау самал'' тұрғын үй кешенінің электрэнергетикасы шығынын төмендетуді есептеу мен саралау
 Акцизы. Плательщики акциза
 Фондовый рынок
 Налоги и налогообложение
 Кредиты и рассрочки
 Бюджетирование проекта. Основы фандрайзинга
 Анализ имущественного потенциала
 Инвестиционная деятельность организации
 Учет выпуска и продажи готовой продукции
 The theory of exchange rate determination
 Cодержание электронной коммерции и электронного бизнеса
 Учёт материально-производственных запасов
 Поняття та економічна сутність інвестування
 Финансы государственного сектора экономики: понятие и структура
 Администрация сельского поседения Сосновка. Об исполнении бюджета за 1 квартал 2023 г
 Международный стандарт аудита 220. Контроль качества при проведении аудита финансовой отчетности
 Понятие финансов и финансовой деятельности государства
 Единый налог на вменённый доход для отдельных видов деятельности (ЕНВД)
 расходы
 Налоги и налогообложение
 Почта Банк для СНТ
 Система права социального обеспечения. Общее понятие отрасли
 Затраты предприятия
 Государственный кредит (государственные и муниципальные заимствования)
 Валютный рынок FOREX. Технический анализ на рынке FOREX
 Операции коммерческого банка с пластиковыми картами и их роль в обеспечении комплексного обслуживания клиентов
 Доходы, расходы и прибыль организации
 Комплексная оценка эффективности финансовохозяйственной деятельности предприятия