- Investment criteria (lecture 5)

Содержание
- 2. Lecture 5. Investment criteria
- 3. How should a firm make an investment decision What assets do we buy? What is the
- 4. Capital Budgeting: The process of planning for purchases of long-term assets. Example: Suppose our firm must
- 5. Decision-making Criteria in Capital Budgeting How do we decide if a capital investment project should be
- 6. Decision-making Criteria in Capital Budgeting The ideal evaluation method should: include all cash flows that occur
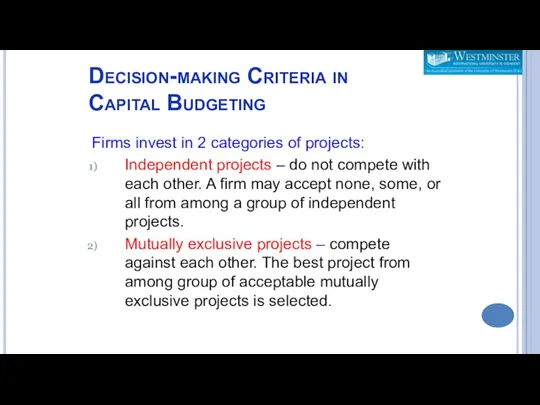
- 7. Decision-making Criteria in Capital Budgeting Firms invest in 2 categories of projects: Independent projects – do
- 8. Techniques in Capital Budgeting Payback period Discounted Payback Period Net Present Value (NPV) Profitability Index (PI)
- 9. 1) Payback Period The payback method simply measures how long (in years and/or months) it takes
- 10. How long will it take for the project to generate enough cash to pay for itself?
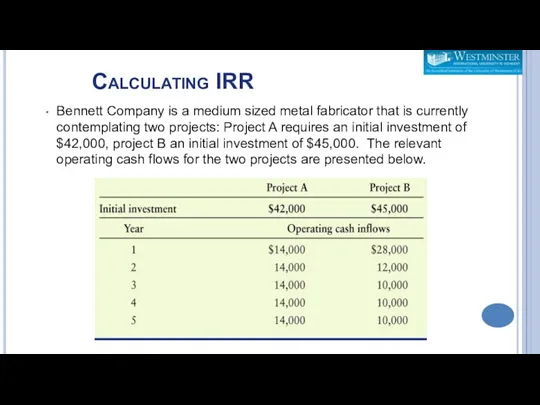
- 11. Bennett Company is a medium sized metal fabricator that is currently contemplating two projects: Project A
- 12. Example (cont.)
- 13. Payback Period Project A Year Cash flow 1 $14,000 2 $14,000 3 $14,000 4 $14,000 5
- 14. Payback Period Project B Year Cash flow 1 $28,000 2 $12,000 3 $10,000 4 $10,000 5
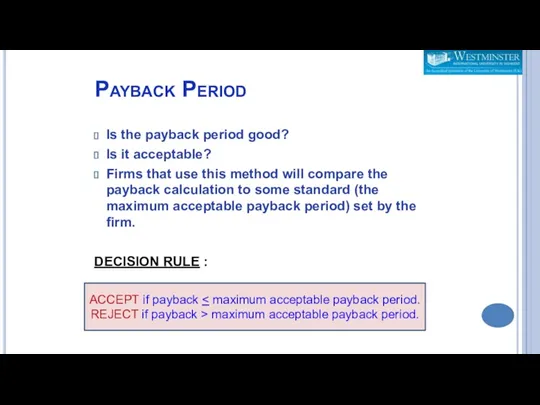
- 15. Payback Period Is the payback period good? Is it acceptable? Firms that use this method will
- 16. Pros and Cons of Payback Periods The payback method is widely used by large firms to
- 17. Pros and Cons of Payback Periods (cont.) One major weakness of the payback method is that
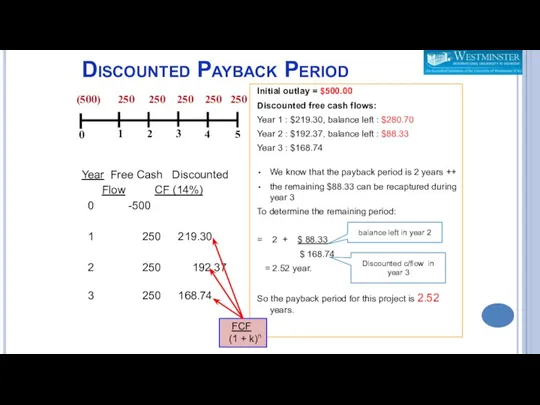
- 18. 2) Discounted Payback Period The number of years needed to recover initial cash outlay from the
- 19. Discounted Payback Period Year Free Cash Discounted Flow CF (14%) 0 -500 1 250 219.30 2
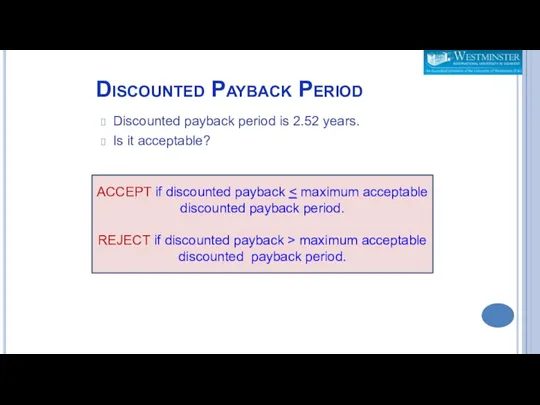
- 20. Discounted Payback Period Discounted payback period is 2.52 years. Is it acceptable? ACCEPT if discounted payback
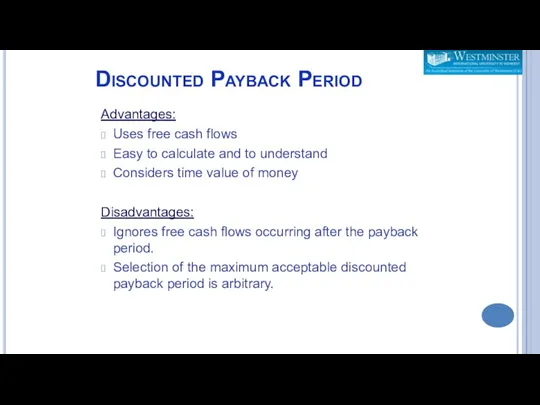
- 21. Discounted Payback Period Advantages: Uses free cash flows Easy to calculate and to understand Considers time
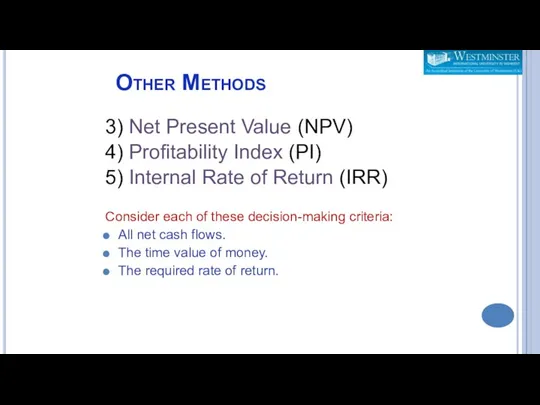
- 22. Other Methods 3) Net Present Value (NPV) 4) Profitability Index (PI) 5) Internal Rate of Return
- 23. 3) Net Present Value (NPV) Gives an absolute dollar value for a project by taking the
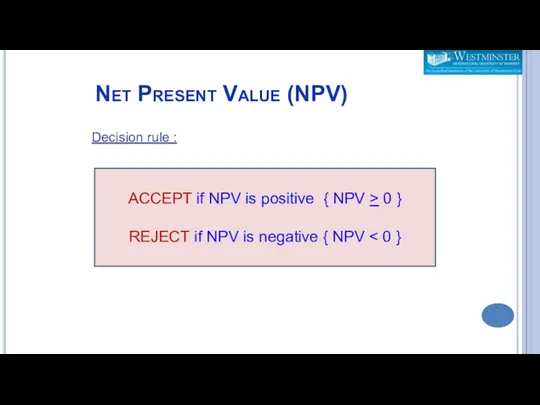
- 24. Net Present Value (NPV) Decision rule : ACCEPT if NPV is positive { NPV > 0
- 25. Find the PV for every cash flows discounted @ the investors required rate of return Sum
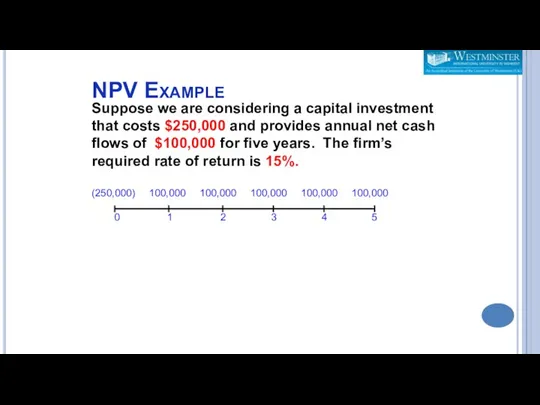
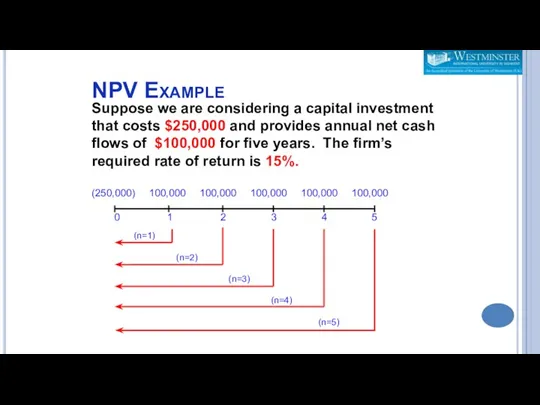
- 26. NPV Example Suppose we are considering a capital investment that costs $250,000 and provides annual net
- 27. NPV Example Suppose we are considering a capital investment that costs $250,000 and provides annual net
- 28. NPV = 100,000 100,000 100,000 (1.15)1 (1.15)2 (1.15)3 100,000 100,000 (1.15)4 (1.15)5 = 335215.50 – 250,000
- 29. n = 5 k = 15% PMT = 100,000 PV of cash flows = 100,000 (PVIFA15%,5)
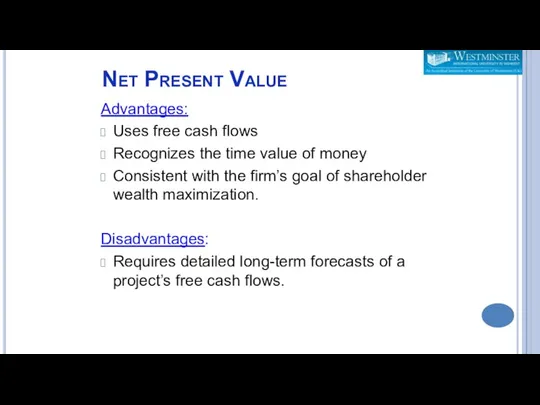
- 30. Net Present Value Advantages: Uses free cash flows Recognizes the time value of money Consistent with
- 31. Also known as profit and cost ratio, i.e benefit/costs Compares the benefits and costs of a
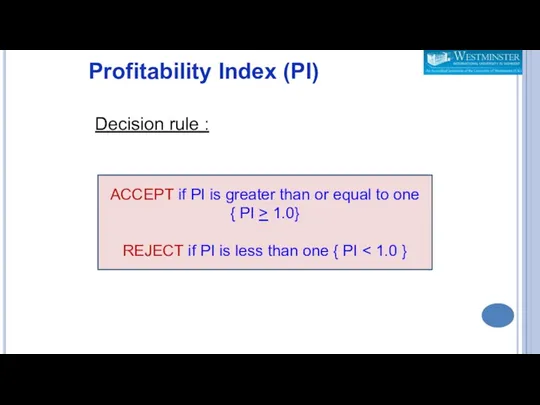
- 32. Profitability Index (PI) Decision rule : ACCEPT if PI is greater than or equal to one
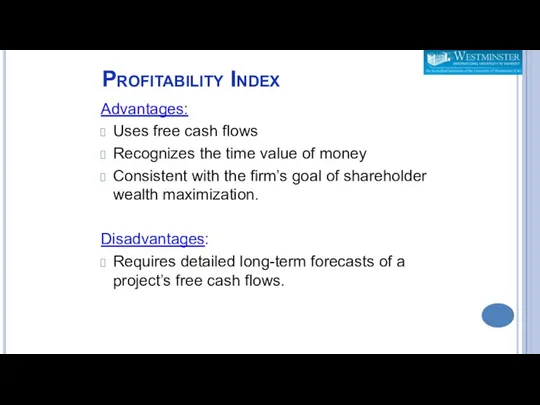
- 33. Profitability Index Advantages: Uses free cash flows Recognizes the time value of money Consistent with the
- 34. Emerald Corp. is considering an investment with a cost of $350,000 and future benefits of $100,000
- 35. The discount rate that equates the present value of the project’s future free cash flows with
- 36. IRR is the rate of return that makes the PV of the cash flows equal to
- 37. Calculating IRR Bennett Company is a medium sized metal fabricator that is currently contemplating two projects:
- 38. Solution: -$42,000 $14,000 $14,000 $14,000 $14,000 $14,000 -$45,000 $28,000 $12,000 $10,000 $10,000 $10,000 $45,000 NPVB= $
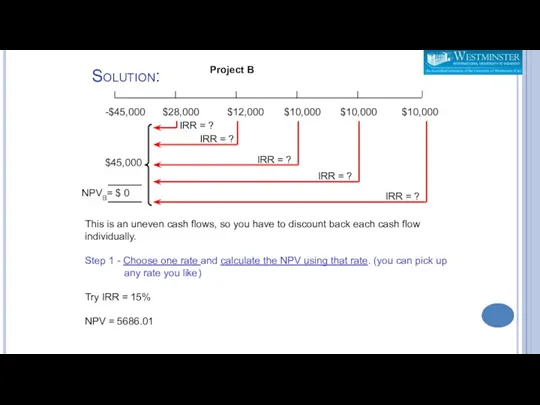
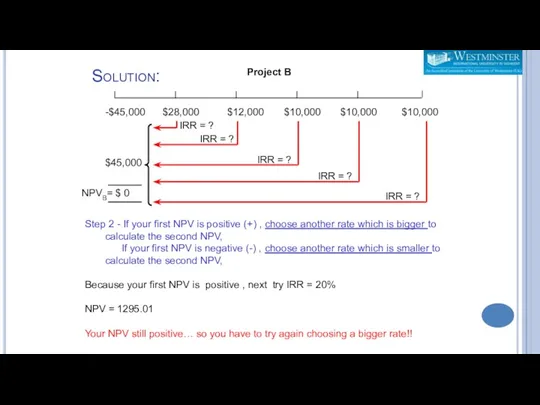
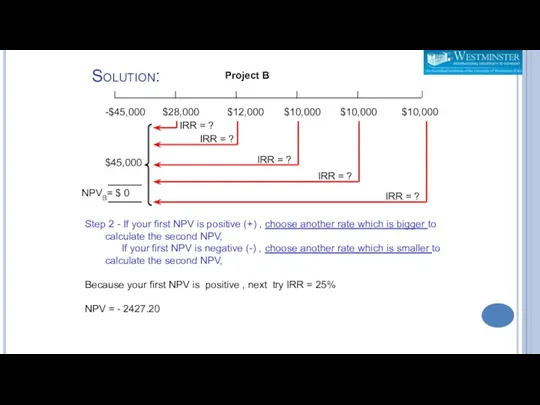
- 39. Method: trial and error Choose one rate and calculate the NPV using that rate. If your
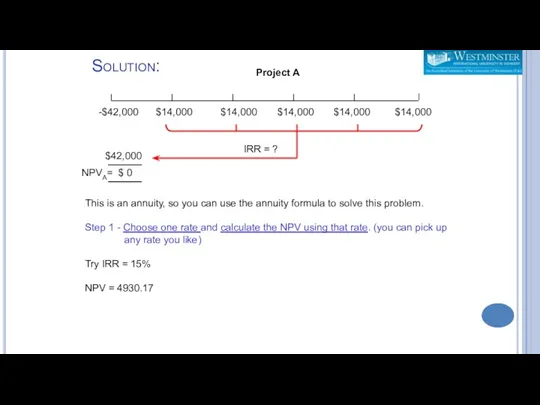
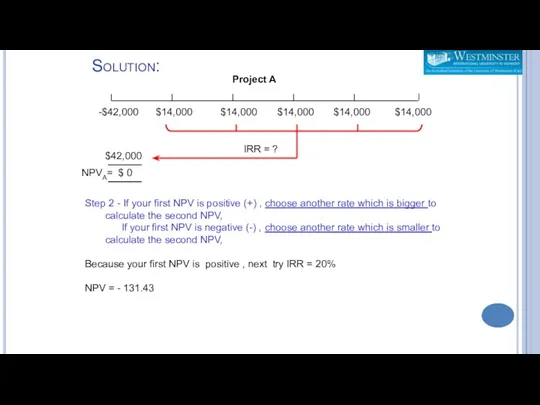
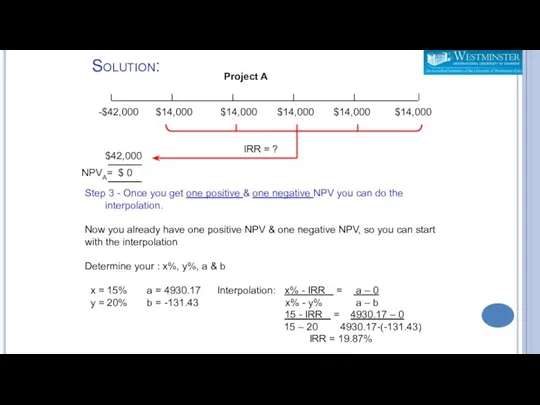
- 40. Solution: -$42,000 $14,000 $14,000 $14,000 $14,000 $14,000 NPVA= $ 0 $42,000 IRR = ? Project A
- 41. Solution: -$42,000 $14,000 $14,000 $14,000 $14,000 $14,000 NPVA= $ 0 $42,000 IRR = ? Project A
- 42. Solution: -$42,000 $14,000 $14,000 $14,000 $14,000 $14,000 NPVA= $ 0 $42,000 IRR = ? Project A
- 43. Solution: -$45,000 $28,000 $12,000 $10,000 $10,000 $10,000 $45,000 NPVB= $ 0 IRR = ? IRR =
- 44. Solution: -$45,000 $28,000 $12,000 $10,000 $10,000 $10,000 $45,000 NPVB= $ 0 IRR = ? IRR =
- 45. Solution: -$45,000 $28,000 $12,000 $10,000 $10,000 $10,000 $45,000 NPVB= $ 0 IRR = ? IRR =
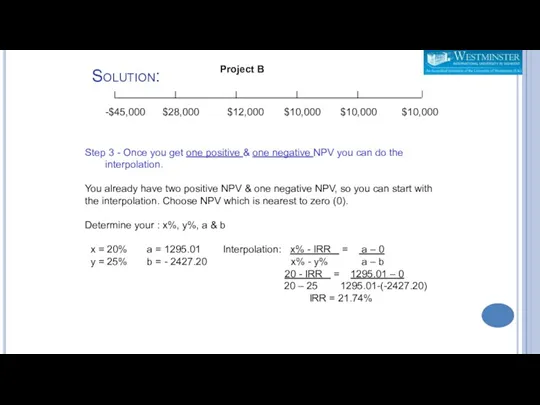
- 46. Solution: -$45,000 $28,000 $12,000 $10,000 $10,000 $10,000 Project B Step 3 - Once you get one
- 47. Internal Rate of Return Advantages: Uses free cash flows Recognizes the time value of money Consistent
- 48. IRR is a good decision-making tool as long as cash flows are conventional. (- + +
- 49. Modified Internal Rate of Return (MIRR) IRR assumes that all cash flows are reinvested at the
- 50. Modified Internal Rate of Return (MIRR)
- 52. Скачать презентацию

Lecture 5. Investment criteria
Lecture 5. Investment criteria
How should a firm make an investment decision
What assets do we
How should a firm make an investment decision
What assets do we
Capital Budgeting:
The process of planning for purchases of long-term assets.
Example:
Capital Budgeting:
The process of planning for purchases of long-term assets.
Example:
Decision-making Criteria in Capital Budgeting
How do we decide if a capital
Decision-making Criteria in Capital Budgeting
How do we decide if a capital
Decision-making Criteria in Capital Budgeting
The ideal evaluation method should:
include all cash
Decision-making Criteria in Capital Budgeting
The ideal evaluation method should:
include all cash
Decision-making Criteria in Capital Budgeting
Firms invest in 2 categories of projects:
Independent
Decision-making Criteria in Capital Budgeting
Firms invest in 2 categories of projects:
Independent
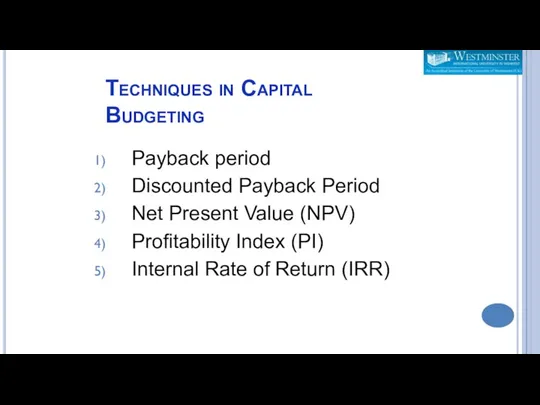
Techniques in Capital Budgeting
Payback period
Discounted Payback Period
Net Present Value (NPV)
Profitability Index
Techniques in Capital Budgeting
Payback period
Discounted Payback Period
Net Present Value (NPV)
Profitability Index
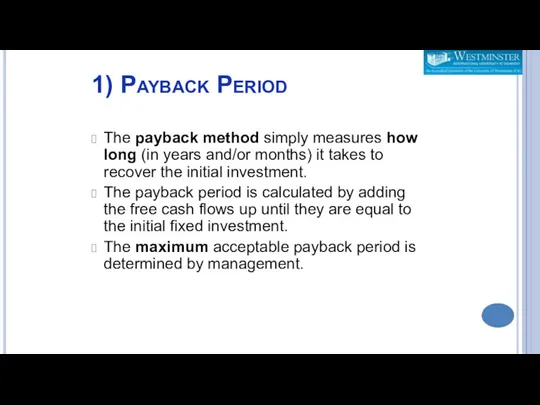
1) Payback Period
The payback method simply measures how long (in years
1) Payback Period
The payback method simply measures how long (in years
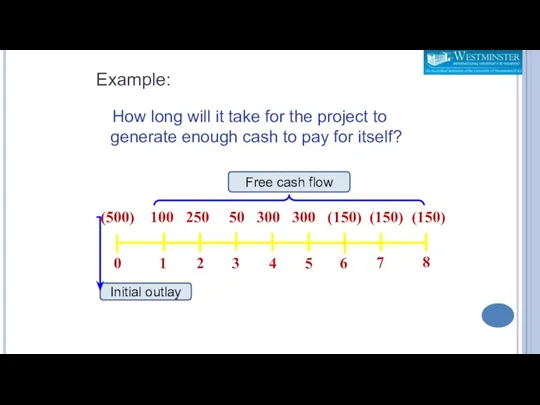
How long will it take for the project to generate
How long will it take for the project to generate
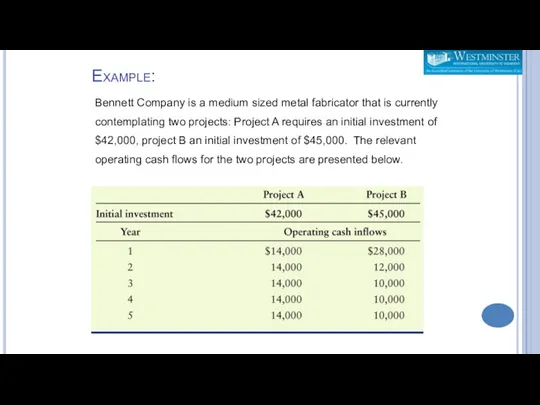
Bennett Company is a medium sized metal fabricator that is currently
Bennett Company is a medium sized metal fabricator that is currently
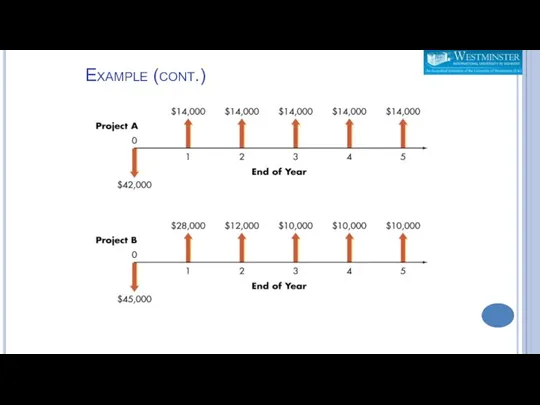
Example (cont.)
Example (cont.)
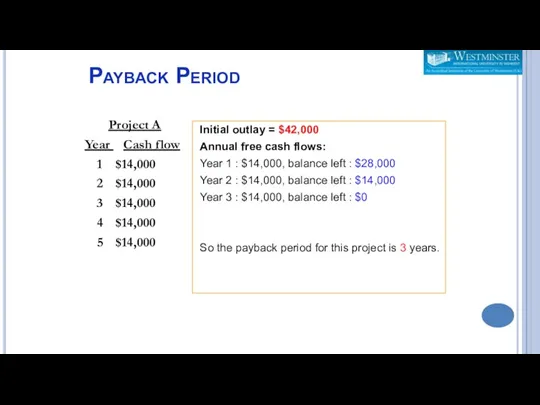
Payback Period
Project A
Year Cash flow
1 $14,000
2 $14,000
3 $14,000
4 $14,000
5 $14,000
Initial
Payback Period
Project A
Year Cash flow
1 $14,000
2 $14,000
3 $14,000
4 $14,000
5 $14,000
Initial
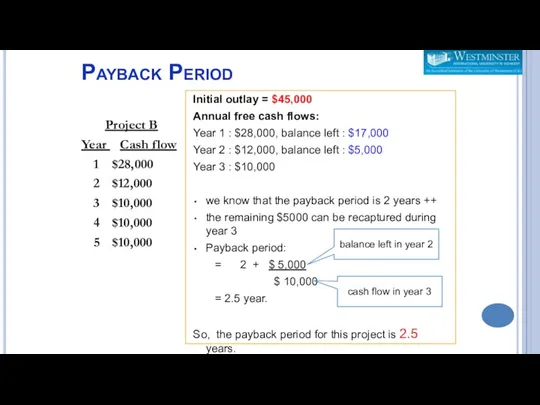
Payback Period
Project B
Year Cash flow
1 $28,000
2 $12,000
3 $10,000
4 $10,000
5 $10,000
Initial
Payback Period
Project B
Year Cash flow
1 $28,000
2 $12,000
3 $10,000
4 $10,000
5 $10,000
Initial
Payback Period
Is the payback period good?
Is it acceptable?
Firms that use this
Payback Period
Is the payback period good?
Is it acceptable?
Firms that use this
Pros and Cons of Payback Periods
The payback method is widely used
Pros and Cons of Payback Periods
The payback method is widely used
Pros and Cons
of Payback Periods (cont.)
One major weakness of the
Pros and Cons
of Payback Periods (cont.)
One major weakness of the
2) Discounted Payback Period
The number of years needed to recover initial
2) Discounted Payback Period
The number of years needed to recover initial
Discounted Payback Period
Year Free Cash Discounted
Flow CF (14%)
Discounted Payback Period
Year Free Cash Discounted
Flow CF (14%)
Discounted Payback Period
Discounted payback period is 2.52 years.
Is it acceptable?
ACCEPT if
Discounted Payback Period
Discounted payback period is 2.52 years.
Is it acceptable?
ACCEPT if
Discounted Payback Period
Advantages:
Uses free cash flows
Easy to calculate and to understand
Considers
Discounted Payback Period
Advantages:
Uses free cash flows
Easy to calculate and to understand
Considers
Other Methods
3) Net Present Value (NPV)
4) Profitability Index (PI)
5) Internal Rate
Other Methods
3) Net Present Value (NPV)
4) Profitability Index (PI)
5) Internal Rate
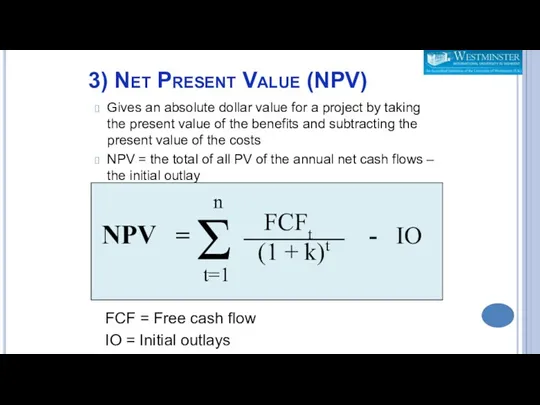
3) Net Present Value (NPV)
Gives an absolute dollar value for a
3) Net Present Value (NPV)
Gives an absolute dollar value for a
Net Present Value (NPV)
Decision rule :
ACCEPT if NPV is positive {
Net Present Value (NPV)
Decision rule :
ACCEPT if NPV is positive {
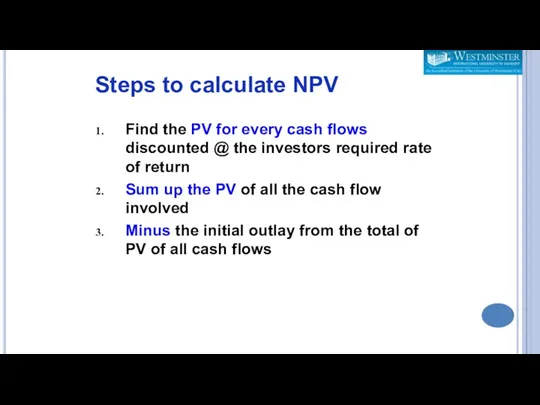
Find the PV for every cash flows discounted @ the investors
Find the PV for every cash flows discounted @ the investors
NPV Example
Suppose we are considering a capital investment that costs $250,000
NPV Example
Suppose we are considering a capital investment that costs $250,000
NPV Example
Suppose we are considering a capital investment that costs $250,000
NPV Example
Suppose we are considering a capital investment that costs $250,000
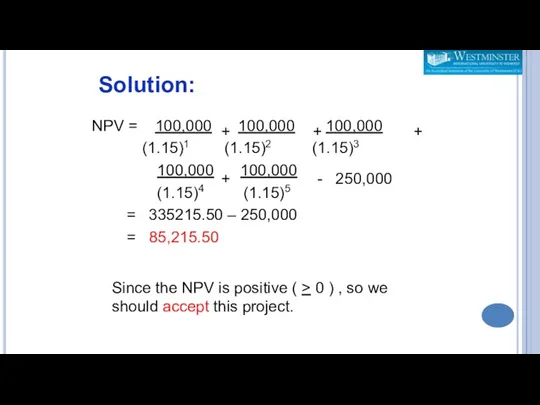
NPV = 100,000 100,000 100,000
(1.15)1 (1.15)2 (1.15)3
100,000
NPV = 100,000 100,000 100,000
(1.15)1 (1.15)2 (1.15)3
100,000
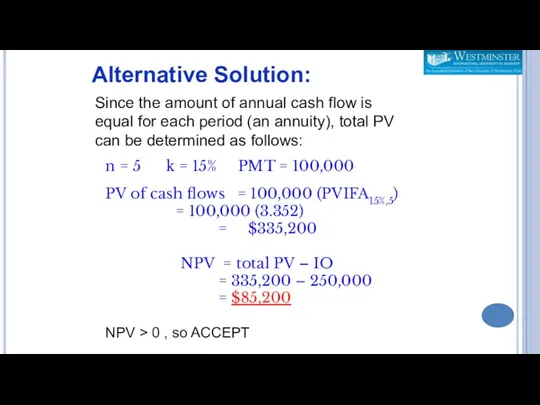
n = 5 k = 15% PMT = 100,000
PV of cash
n = 5 k = 15% PMT = 100,000
PV of cash
Net Present Value
Advantages:
Uses free cash flows
Recognizes the time value of money
Consistent
Net Present Value
Advantages:
Uses free cash flows
Recognizes the time value of money
Consistent
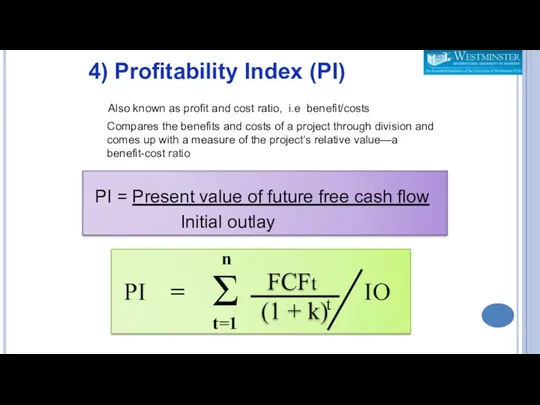
Also known as profit and cost ratio, i.e benefit/costs
Compares the
Also known as profit and cost ratio, i.e benefit/costs
Compares the
Profitability Index (PI)
Decision rule :
ACCEPT if PI is greater than or
Profitability Index (PI)
Decision rule :
ACCEPT if PI is greater than or
Profitability Index
Advantages:
Uses free cash flows
Recognizes the time value of money
Consistent with
Profitability Index
Advantages:
Uses free cash flows
Recognizes the time value of money
Consistent with
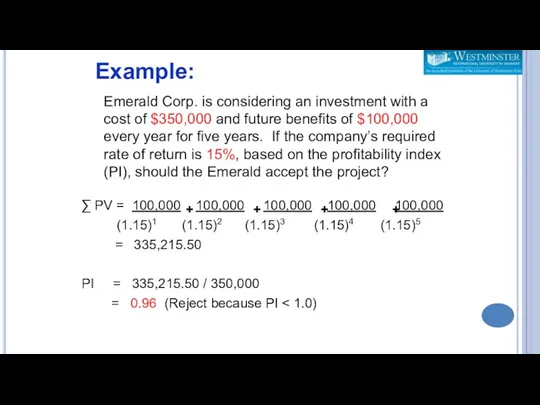
Emerald Corp. is considering an investment with a cost of $350,000
Emerald Corp. is considering an investment with a cost of $350,000
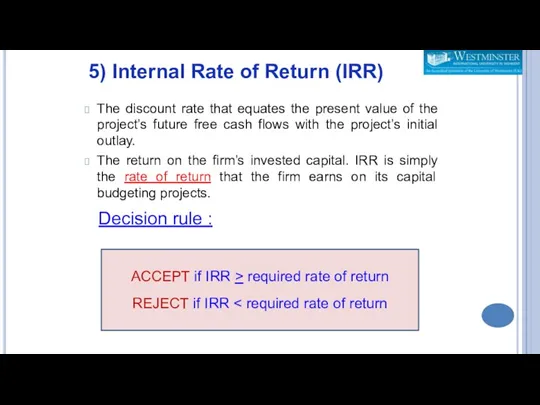
The discount rate that equates the present value of the project’s
The discount rate that equates the present value of the project’s
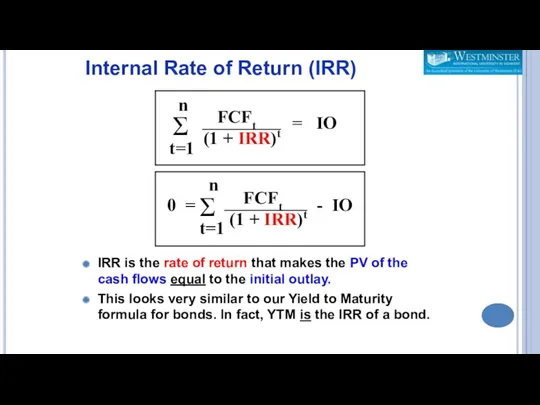
IRR is the rate of return that makes the PV of
IRR is the rate of return that makes the PV of
Calculating IRR
Bennett Company is a medium sized metal fabricator that is
Calculating IRR
Bennett Company is a medium sized metal fabricator that is
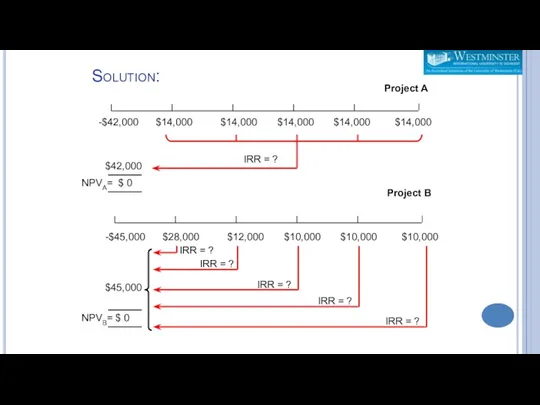
Solution:
-$42,000 $14,000 $14,000 $14,000 $14,000 $14,000
-$45,000 $28,000 $12,000 $10,000 $10,000 $10,000
$45,000
NPVB=
Solution:
-$42,000 $14,000 $14,000 $14,000 $14,000 $14,000
-$45,000 $28,000 $12,000 $10,000 $10,000 $10,000
$45,000
NPVB=
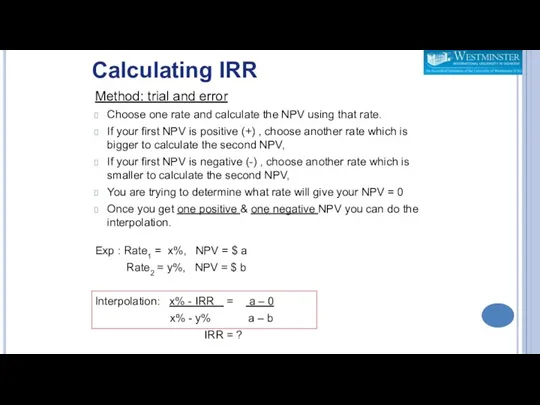
Method: trial and error
Choose one rate and calculate the NPV using
Method: trial and error
Choose one rate and calculate the NPV using
Solution:
-$42,000 $14,000 $14,000 $14,000 $14,000 $14,000
NPVA= $ 0
$42,000
IRR = ?
Project A
This
Solution:
-$42,000 $14,000 $14,000 $14,000 $14,000 $14,000
NPVA= $ 0
$42,000
IRR = ?
Project A
This
Solution:
-$42,000 $14,000 $14,000 $14,000 $14,000 $14,000
NPVA= $ 0
$42,000
IRR = ?
Project A
Step
Solution:
-$42,000 $14,000 $14,000 $14,000 $14,000 $14,000
NPVA= $ 0
$42,000
IRR = ?
Project A
Step
Solution:
-$42,000 $14,000 $14,000 $14,000 $14,000 $14,000
NPVA= $ 0
$42,000
IRR = ?
Project A
Step
Solution:
-$42,000 $14,000 $14,000 $14,000 $14,000 $14,000
NPVA= $ 0
$42,000
IRR = ?
Project A
Step
Solution:
-$45,000 $28,000 $12,000 $10,000 $10,000 $10,000
$45,000
NPVB= $ 0
IRR = ?
IRR =
Solution:
-$45,000 $28,000 $12,000 $10,000 $10,000 $10,000
$45,000
NPVB= $ 0
IRR = ?
IRR =
Solution:
-$45,000 $28,000 $12,000 $10,000 $10,000 $10,000
$45,000
NPVB= $ 0
IRR = ?
IRR =
Solution:
-$45,000 $28,000 $12,000 $10,000 $10,000 $10,000
$45,000
NPVB= $ 0
IRR = ?
IRR =
Solution:
-$45,000 $28,000 $12,000 $10,000 $10,000 $10,000
$45,000
NPVB= $ 0
IRR = ?
IRR =
Solution:
-$45,000 $28,000 $12,000 $10,000 $10,000 $10,000
$45,000
NPVB= $ 0
IRR = ?
IRR =
Solution:
-$45,000 $28,000 $12,000 $10,000 $10,000 $10,000
Project B
Step 3 - Once you
Solution:
-$45,000 $28,000 $12,000 $10,000 $10,000 $10,000
Project B
Step 3 - Once you
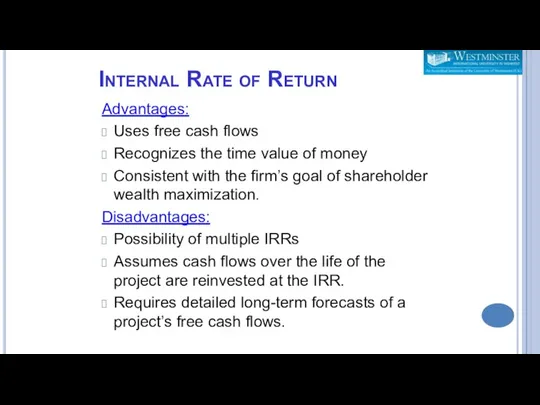
Internal Rate of Return
Advantages:
Uses free cash flows
Recognizes the time value of
Internal Rate of Return
Advantages:
Uses free cash flows
Recognizes the time value of
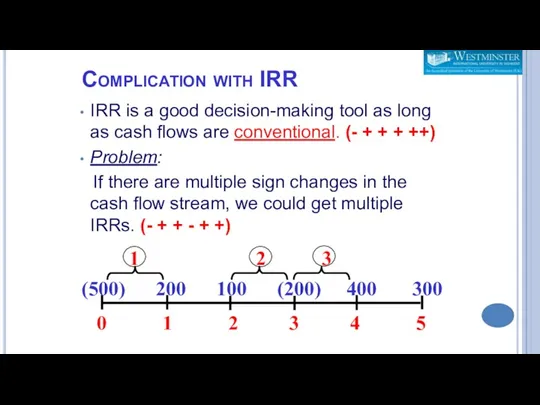
IRR is a good decision-making tool as long as cash flows
IRR is a good decision-making tool as long as cash flows
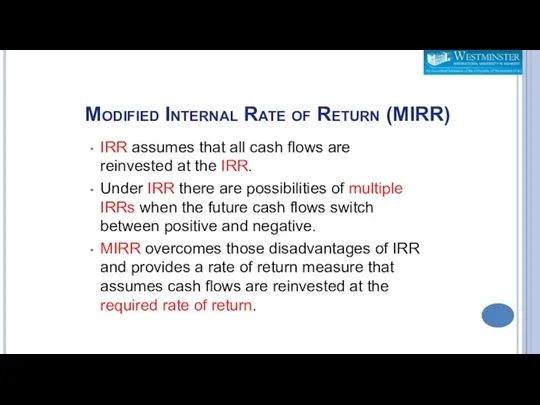
Modified Internal Rate of Return (MIRR)
IRR assumes that all cash flows
Modified Internal Rate of Return (MIRR)
IRR assumes that all cash flows
Modified Internal Rate of Return (MIRR)
Modified Internal Rate of Return (MIRR)
 Актуальные проблемы налогового контроля в РФ
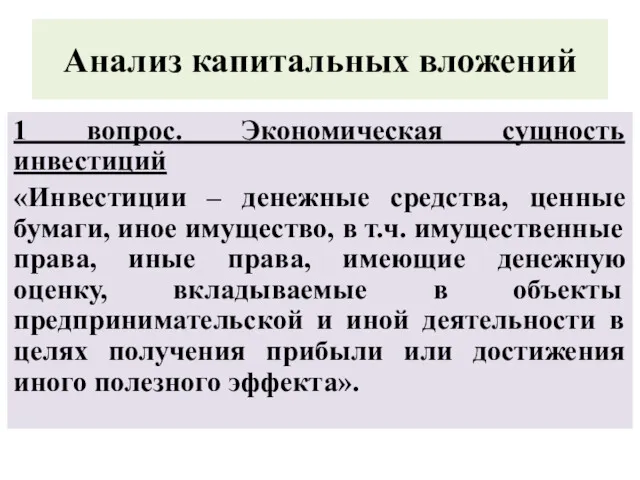 Анализ капитальных вложений
 Банк қызметінің құқықтық негіздері
 Методика SIGMA
 Фонд развития промышленности Республики Карелия
 Бизнес-планирование инновационных проектов
 Лекция 16. Японские свечи
 Доходность и риск финансовой операции
 Денежная система
 Оценка гудвилла
 Изменения в налоговом законодательстве с 2023 года: Введение Единого налогового платежа
 Аналіз джерел формування капіталу. Лекція 5
 Управление стоимостью компании
 Вклад Альянса ФМС УрФО в развитие местных сообществ
 Оборотные средства гостиничного предприятия
 Налог на доходы физических лиц (НДФЛ)
 Семейный бюджет
 Концептуальні основи оподаткування
 Фінансові посередники. Сутність фінансових посередників та їх функції. Суб'єкти банківської системи. (Тема 3)
 Сущность портфеля ценных бумаг и портфельного инвестирования. (Тема 1)
 Activity-Based Costing and Activity-Based Management
 Президентские гранты для ННО
 Салық салу саласындағы мемлекеттік басқару түсінігі,маңызы,міндеттері
 Региональная бюджетная система
 Налог на добавленную стоимость
 Такафул – исламское страхование
 ТОО КазМунайГаз-Сервис. Активы компании
 Фінансові інвестиції