- State Support Shipbuilding in Ukraine

Содержание
- 2. 1. Prerequisites for the development of shipbuilding in Ukraine 3 2. A Brief Overview Of The
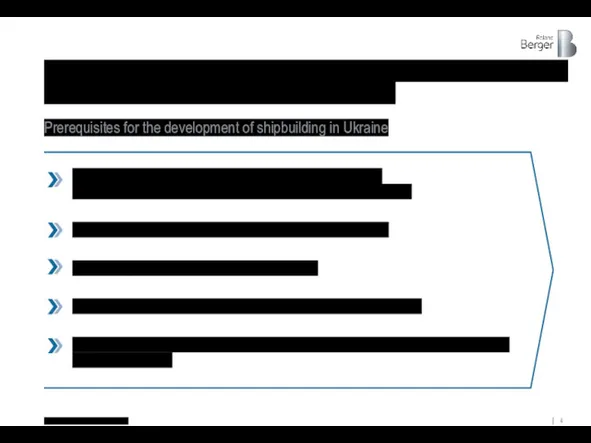
- 3. 1. Prerequisites for the development of shipbuilding in Ukraine
- 4. Access to the largest navigable rivers in Eastern Europe (Dnieper and Danube), as well as access
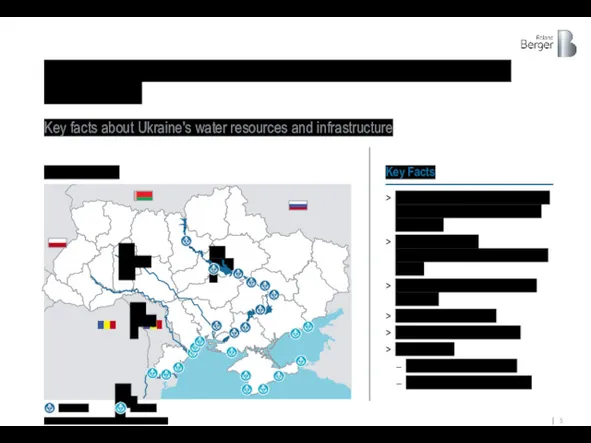
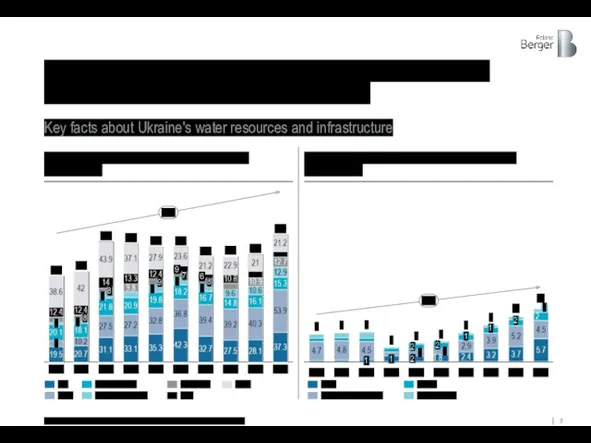
- 5. Ukraine has rich water resources, developed sea and river port infrastructure Key facts about Ukraine's water
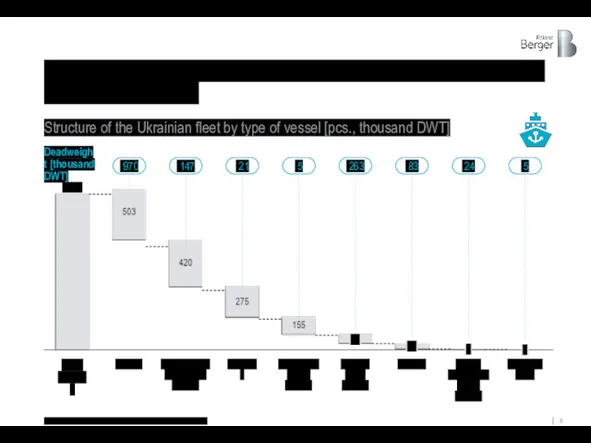
- 6. Modern Ukrainian companies have a developed fleet of commercial and auxiliary vessels Source: Register Book of
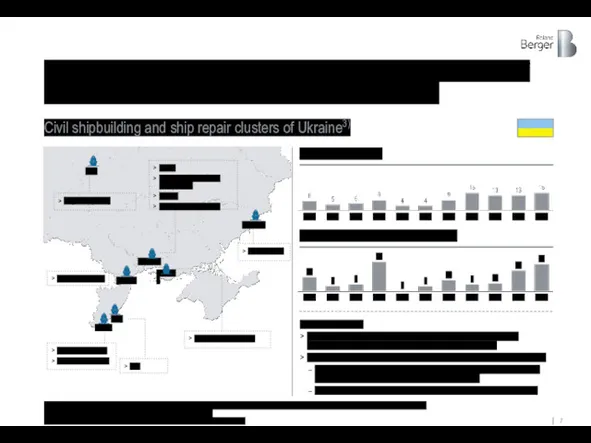
- 7. The country has 10 large and medium-sized shipyards capable of building and repairing a wide range
- 8. The country is increasing export cargo turnover through port infrastructure and waterborne transportation Key facts about
- 9. And in comparison in freight transport with other countries, Ukraine has a great potential for the
- 10. Further development of shipbuilding can be one of the pillars of support for sustainable economic development
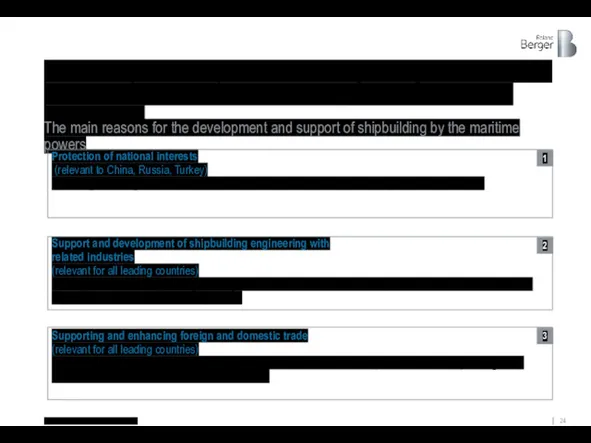
- 11. 2. A Brief Overview Of The Reasons For The Development And Support Of The Shipbuilding Industry
- 12. Reason groups Description, examples Applicability to Ukraine Strategic Ensuring the independence of transport, food, energy and
- 13. For example, despite the fact that in recent years Asian countries have begun to play a
- 14. ХХ – number of active shipyards ... European countries retain production capacity in shipbuilding to ensure
- 15. The number of employees in the shipbuilding industry of the largest EU countries remains practically unchanged
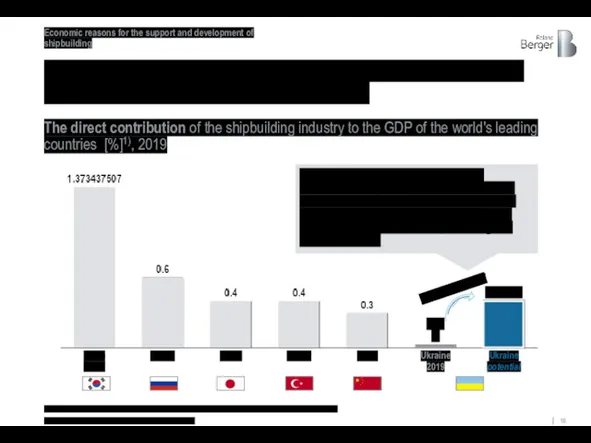
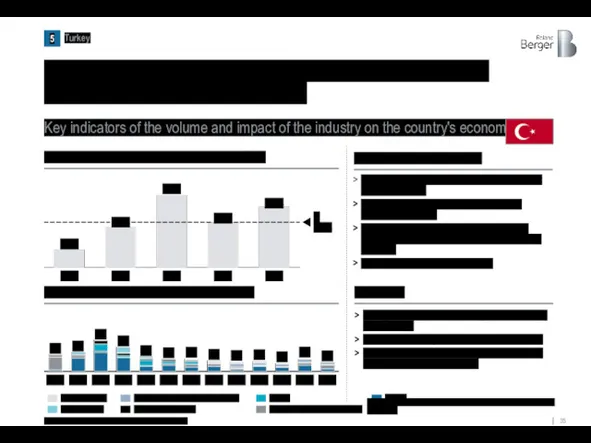
- 16. Turkey Russia South Korea Japan China Ukraine 2019 Ukraine potential 0.03% 0.3-0.6% The potential direct contribution
- 17. With a systematic approach to the development of the supplier industry, more than 85% of the
- 18. from 2 to 5 And the multiplicative effect of shipbuilding on the number of employees in
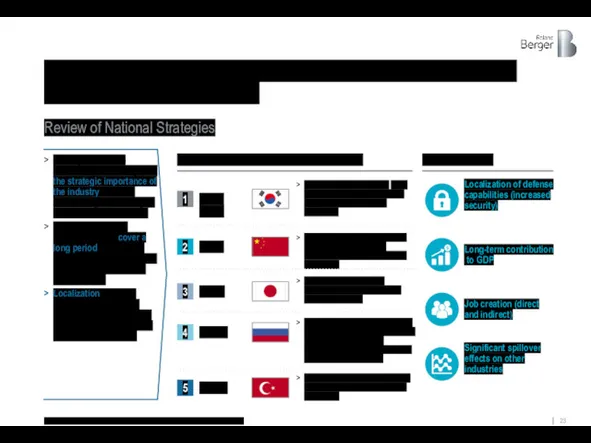
- 19. Sets clear goals and indicators, deadlines for achieving goals, defines responsible agencies Leading countries in shipbuilding
- 20. And the existence of long-term national support programs is a key factor in the development of
- 21. Reference Materials On Leading Countries In Shipbuilding
- 22. China, South Korea and Japan are in the world's top three in terms of total DWT
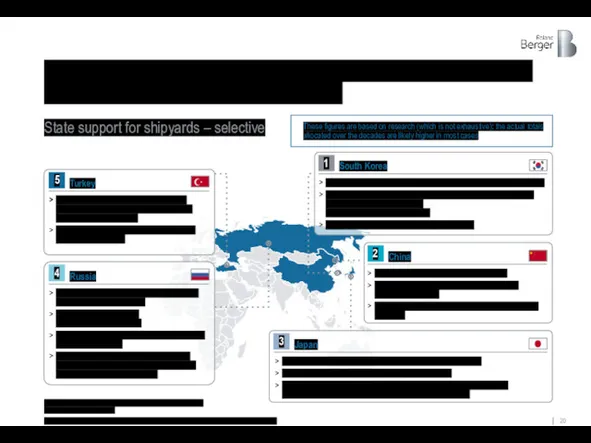
- 23. All leading countries have shipbuilding strategies to improve the competitiveness of shipyards Source: Roland Berger, OECD,
- 24. This industry is a priority for all shipbuilding leading countries since it protects national interests and
- 25. In South Korea, for example, shipbuilding is a strategic industry with a significant contribution to the
- 26. Many factors contribute to the success of Korean shipyards in the global market Success Factors in
- 27. Since 2010, China, along with South Korea, has secured its place among the world's largest shipbuilders
- 28. Source: NBS, Total quarterly investment Quarterly investments in Chinese shipyards [million USD] The growth of entry
- 29. Rapid growth in production capacity has in turn supported China's trade expansion 30 0 20 15
- 30. Thanks to the industry's stable support, Japan has remained one of the most powerful shipbuilding powers
- 31. By supporting R&D in the industry, the Japanese government has ensured a significant increase in productivity
- 32. The Japanese government has introduced a set of credit and grant instruments for the development of
- 33. Shipbuilding is one of the strategic industries of Russia in recent decades Key measures and initiatives
- 34. Today, the industry includes 180 active shipyards employing about 190,000 people. Overview of key industry indicators
- 35. Since 2000, Turkey has been systematically developing and supporting the shipbuilding industry Key results Turkey was
- 36. Turkey's shipbuilding capacity has almost quadrupled during this period 400 1,600 1,200 200 1,400 600 800
- 37. Also, Turkey was among the leading countries in ship repairs Source: Republic of Turkey - Ministry
- 38. 3. The region market, the potential for Ukraine
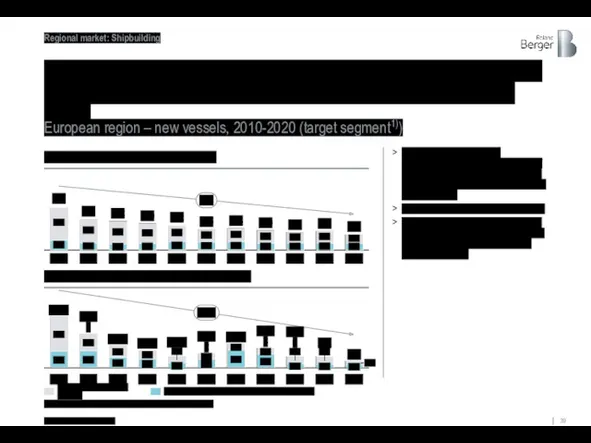
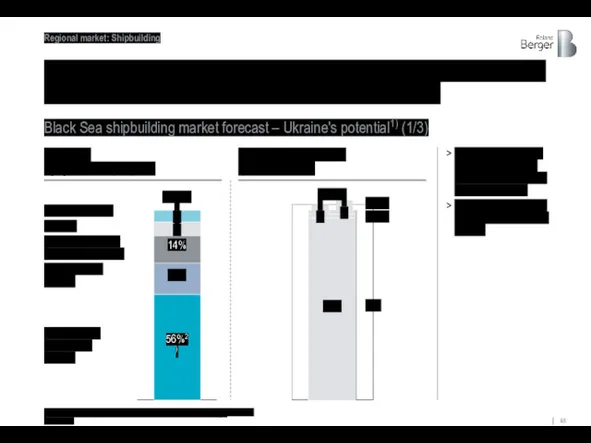
- 39. As the market for new shipbuilding declines, the Black Sea region's contribution to European shipbuilding has
- 40. Most of the orders of the Black Sea region today come from foreign customers Black Sea
- 41. 67 48 Bulk carriers1) Tankers Container ships Other/Special (non-cargo) vessels2) Turkey and Romania have produced significantly
- 42. 3 24 77 11 2 3 6 39 105 37 13 45 241 312 312 1,900
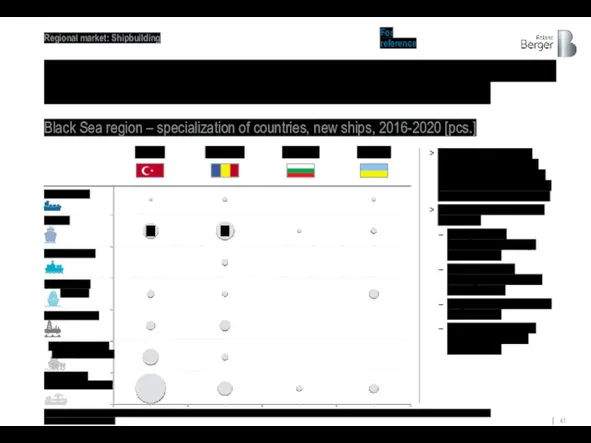
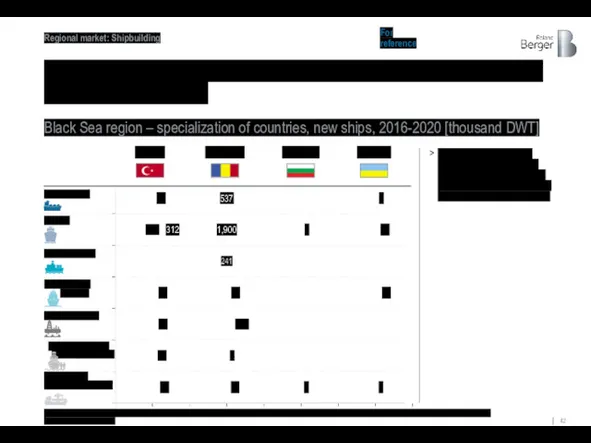
- 43. And all countries in the region, including Ukraine, are capable of producing a very wide range
- 44. The production capacity of Ukrainian shipyards today is ~196 thousand CGT, and the maximum deadweight up
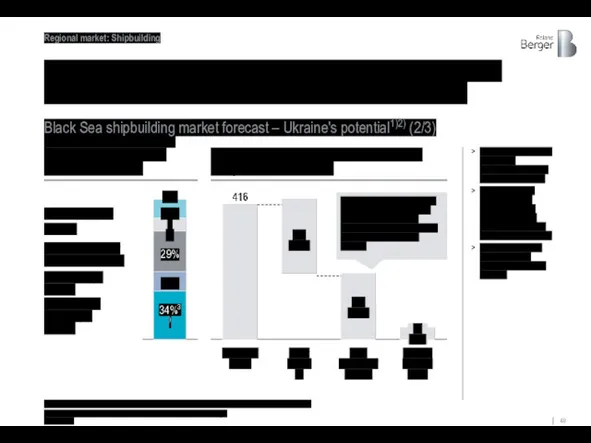
- 45. Since 2000, Turkey has tripled its shipbuilding capacity, Romania and Bulgaria have doubled their capacities Black
- 46. Despite such significant capacity, the Black Sea region is significantly underutilized 13% 19% 1,429 1,429 Romania
- 47. The forecast volume of construction of new ships in the Black Sea region in terms of
- 48. Ukrainian shipyards are technically able to produce the entire range of vessels under the planned Orderbook
- 49. The production capacity of Ukrainian shipyards approximately corresponds to half of the market of the Black
- 50. Given the available capacity, Ukraine's maximum potential for new construction is $500-600 million per year. 800
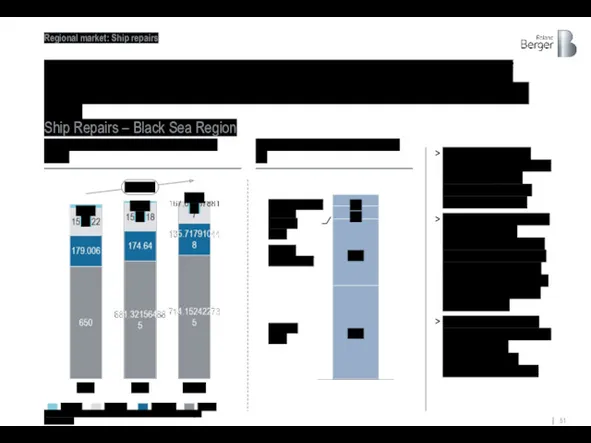
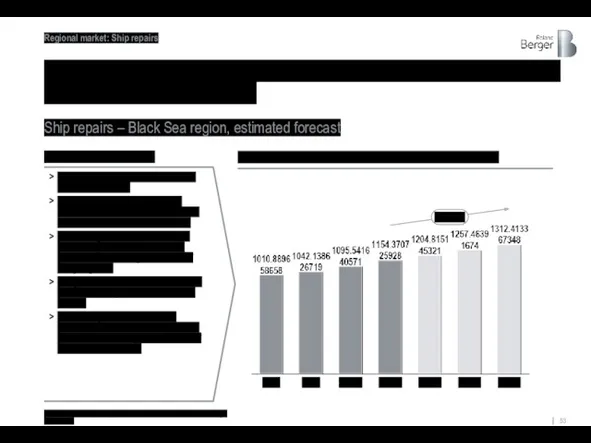
- 51. Ship repair market of the Black Sea region shows the growth of approx. 5% per year,
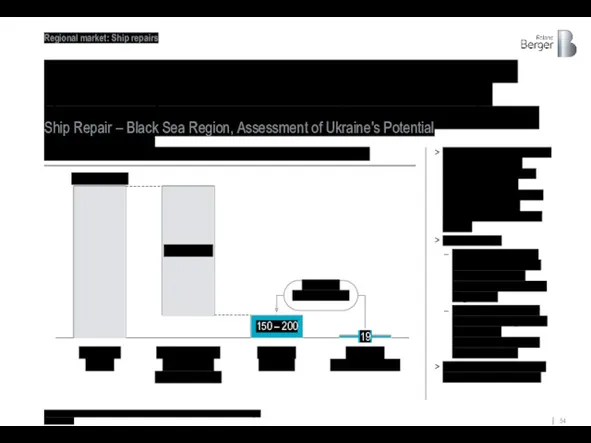
- 52. Two-thirds of ship repairs in Ukraine are carried out on the facilities of Ilyichevsk Shipyard and
- 53. The ship repair market in the Black Sea region is expected to grow by an average
- 54. Due to the factor of remoteness, as well as the fact that only the Ilyichevsk Shipyard
- 56. Скачать презентацию

1. Prerequisites for the development of shipbuilding in Ukraine 3
2. A Brief Overview Of
1. Prerequisites for the development of shipbuilding in Ukraine 3
2. A Brief Overview Of

1. Prerequisites for the development of shipbuilding in Ukraine
1. Prerequisites for the development of shipbuilding in Ukraine
Access to the largest navigable rivers in Eastern Europe
(Dnieper and
Access to the largest navigable rivers in Eastern Europe (Dnieper and
Ukraine has rich water resources, developed sea and river port infrastructure
Key
Ukraine has rich water resources, developed sea and river port infrastructure
Key
Modern Ukrainian companies have a developed fleet of commercial and auxiliary
Modern Ukrainian companies have a developed fleet of commercial and auxiliary
The country has 10 large and medium-sized shipyards capable of building
The country has 10 large and medium-sized shipyards capable of building
The country is increasing export cargo turnover through port infrastructure and
The country is increasing export cargo turnover through port infrastructure and
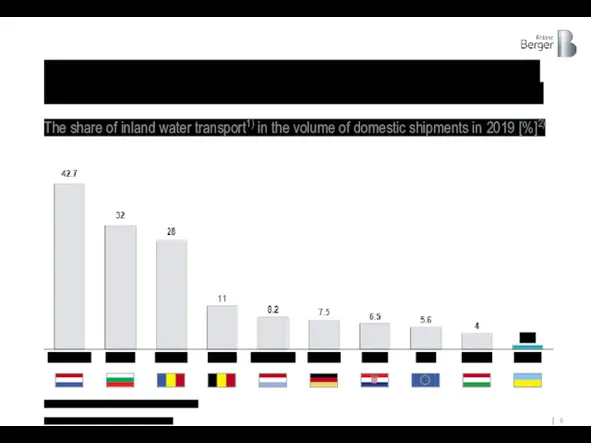
And in comparison in freight transport with other countries, Ukraine has
And in comparison in freight transport with other countries, Ukraine has
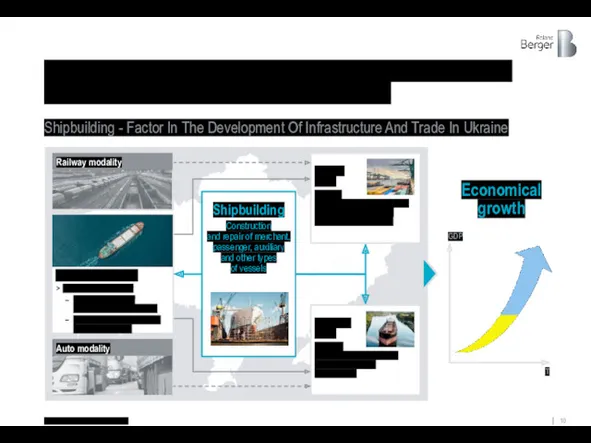
Further development of shipbuilding can be one of the pillars of
Further development of shipbuilding can be one of the pillars of

2. A Brief Overview Of The Reasons For The Development And Support
2. A Brief Overview Of The Reasons For The Development And Support

Reason groups
Description, examples
Applicability
to Ukraine
Strategic
Ensuring the independence of transport, food, energy
Reason groups
Description, examples
Applicability
to Ukraine
Strategic
Ensuring the independence of transport, food, energy
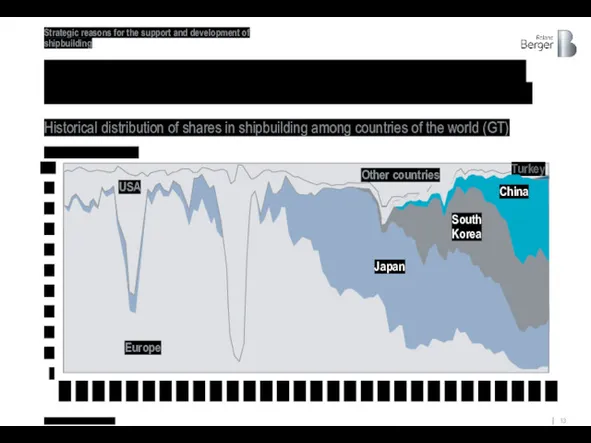
For example, despite the fact that in recent years Asian countries
For example, despite the fact that in recent years Asian countries
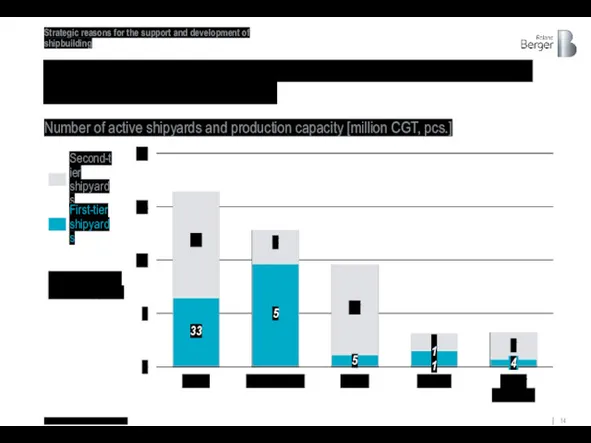
ХХ – number of active shipyards
... European countries retain production capacity
ХХ – number of active shipyards
... European countries retain production capacity
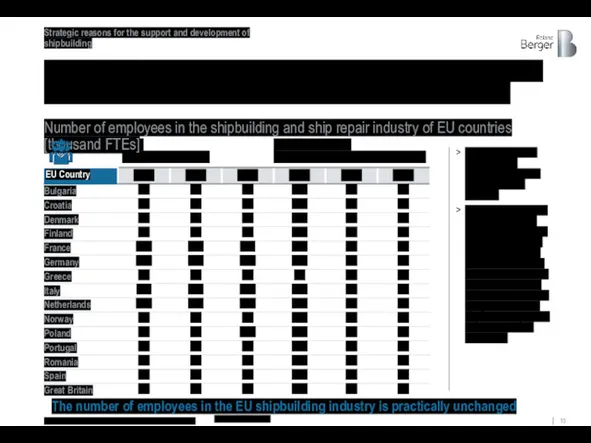
The number of employees in the shipbuilding industry of the largest
The number of employees in the shipbuilding industry of the largest
Turkey
Russia
South Korea
Japan
China
Ukraine
2019
Ukraine
potential
0.03%
0.3-0.6%
The potential direct contribution of shipbuilding to the GDP
Turkey
Russia
South Korea
Japan
China
Ukraine
2019
Ukraine
potential
0.03%
0.3-0.6%
The potential direct contribution of shipbuilding to the GDP
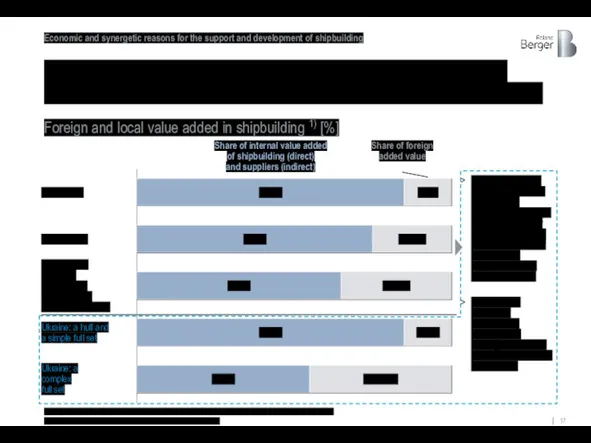
With a systematic approach to the development of the supplier industry,
With a systematic approach to the development of the supplier industry,
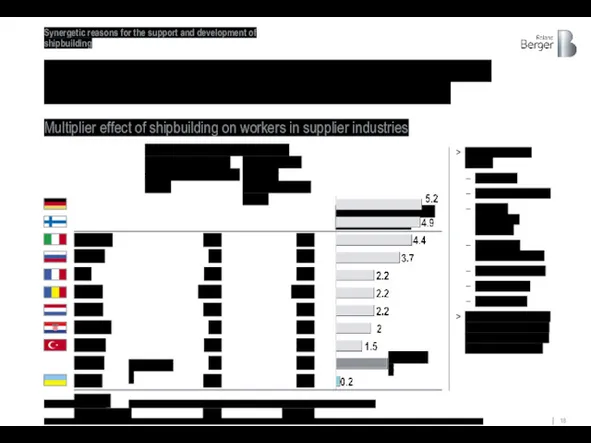
from 2 to 5
And the multiplicative effect of shipbuilding on the
from 2 to 5
And the multiplicative effect of shipbuilding on the
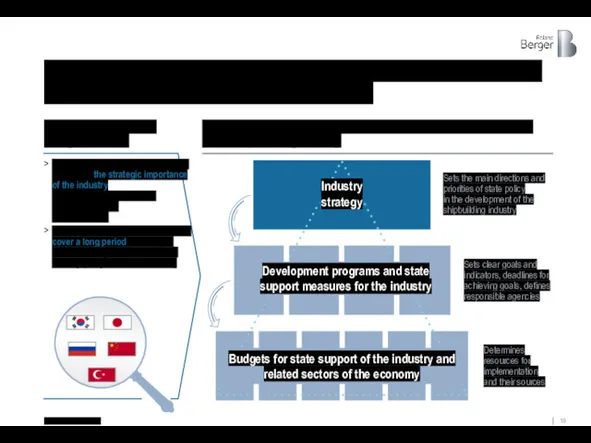
Sets clear goals and indicators, deadlines for achieving goals, defines responsible
Sets clear goals and indicators, deadlines for achieving goals, defines responsible
And the existence of long-term national support programs is a key
And the existence of long-term national support programs is a key

Reference Materials On Leading Countries In Shipbuilding
Reference Materials On Leading Countries In Shipbuilding
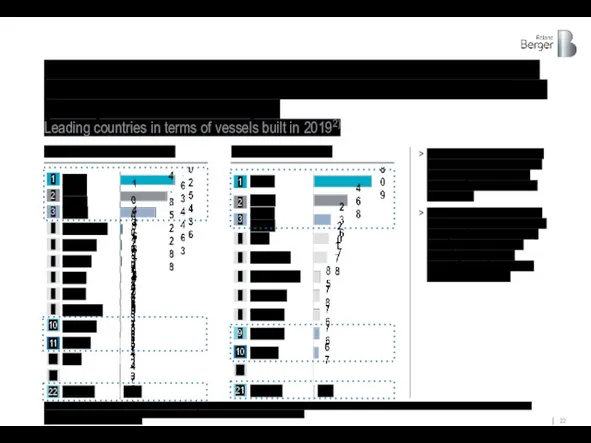
China, South Korea and Japan are in the world's top three
China, South Korea and Japan are in the world's top three
All leading countries have shipbuilding strategies to improve the competitiveness of
All leading countries have shipbuilding strategies to improve the competitiveness of
This industry is a priority for all shipbuilding leading countries since
This industry is a priority for all shipbuilding leading countries since
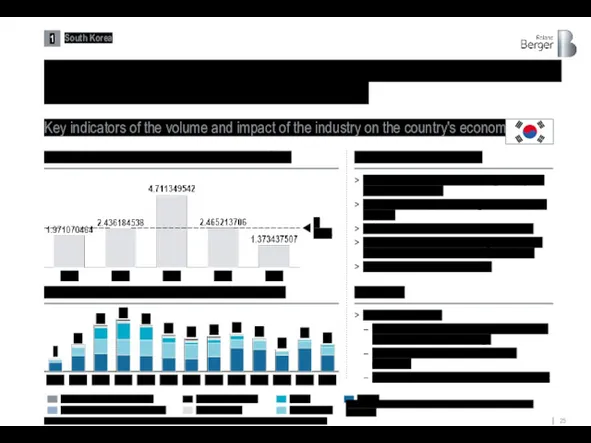
In South Korea, for example, shipbuilding is a strategic industry with
In South Korea, for example, shipbuilding is a strategic industry with
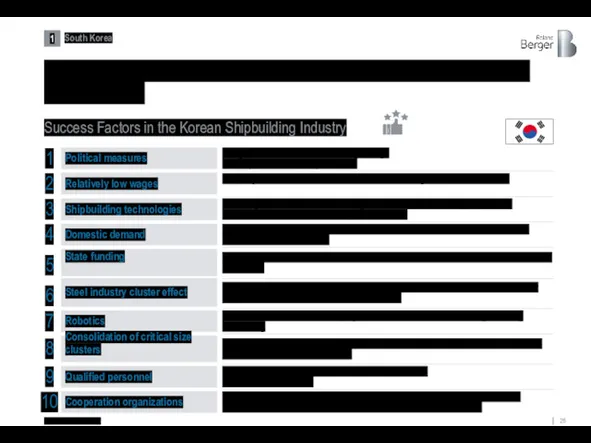
Many factors contribute to the success of Korean shipyards in the
Many factors contribute to the success of Korean shipyards in the
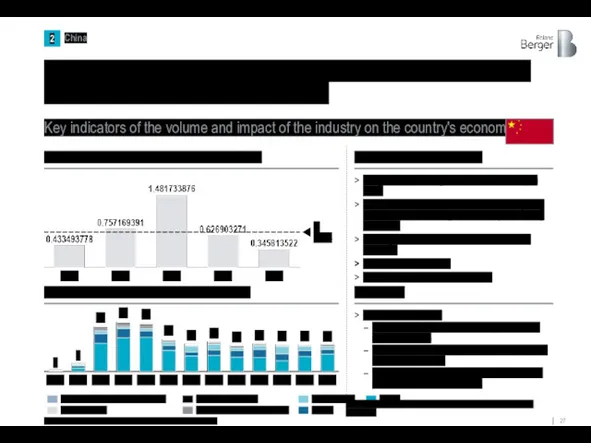
Since 2010, China, along with South Korea, has secured its place
Since 2010, China, along with South Korea, has secured its place
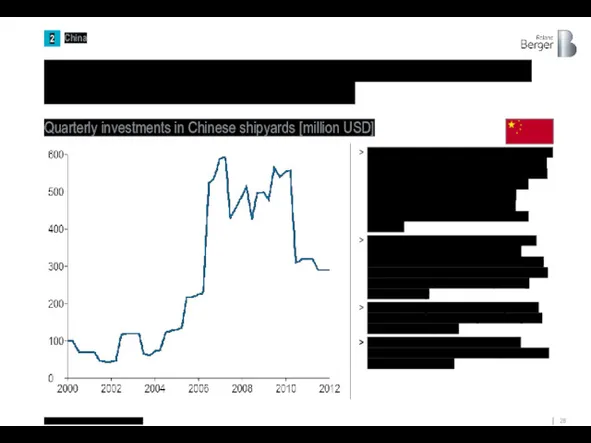
Source: NBS, Total quarterly investment
Quarterly investments in Chinese shipyards [million USD]
The
Source: NBS, Total quarterly investment
Quarterly investments in Chinese shipyards [million USD]
The
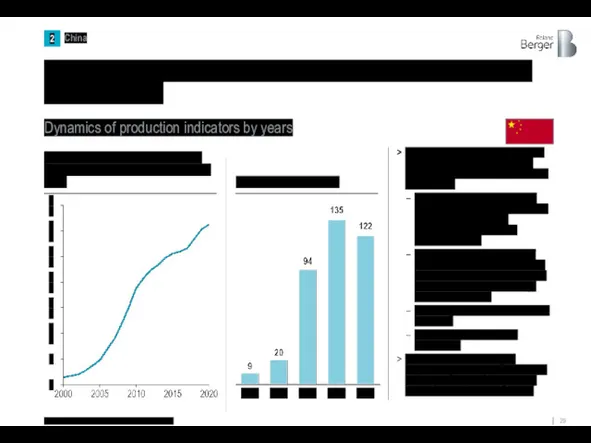
Rapid growth in production capacity has in turn supported China's trade
Rapid growth in production capacity has in turn supported China's trade
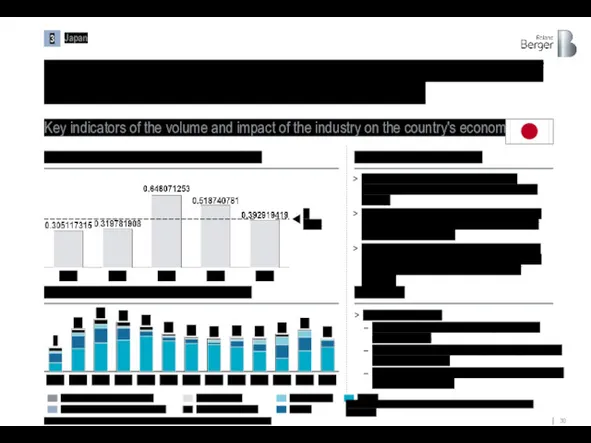
Thanks to the industry's stable support, Japan has remained one of
Thanks to the industry's stable support, Japan has remained one of
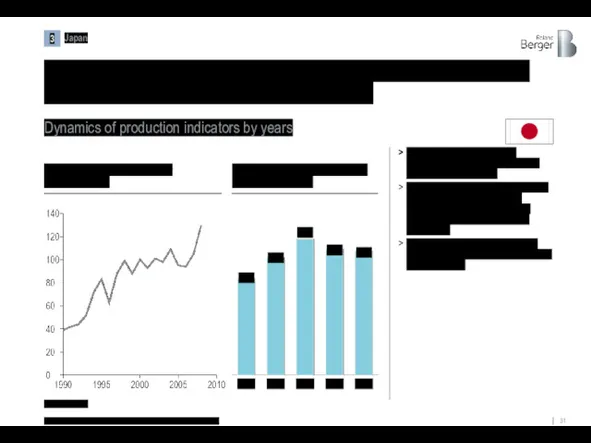
By supporting R&D in the industry, the Japanese government has ensured
By supporting R&D in the industry, the Japanese government has ensured
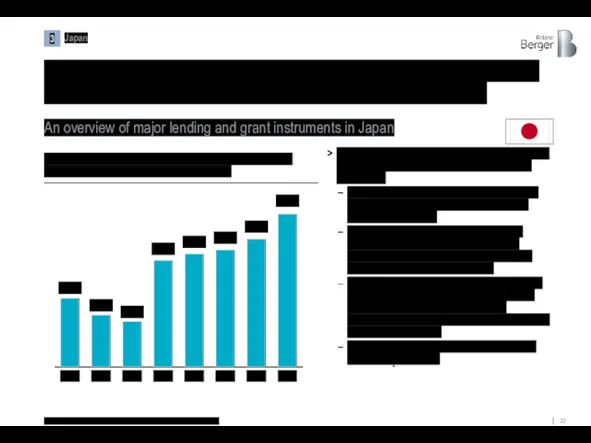
The Japanese government has introduced a set of credit and grant
The Japanese government has introduced a set of credit and grant
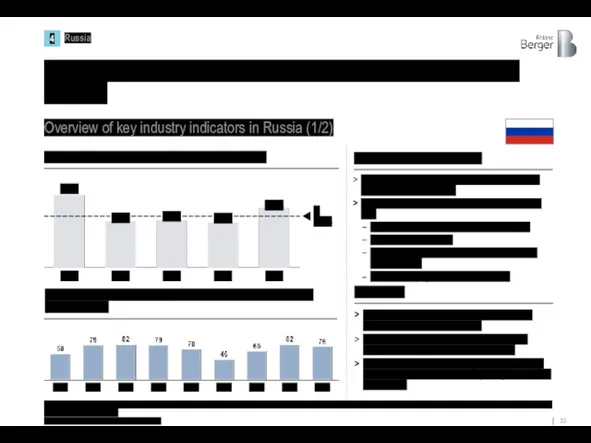
Shipbuilding is one of the strategic industries of Russia in recent
Shipbuilding is one of the strategic industries of Russia in recent
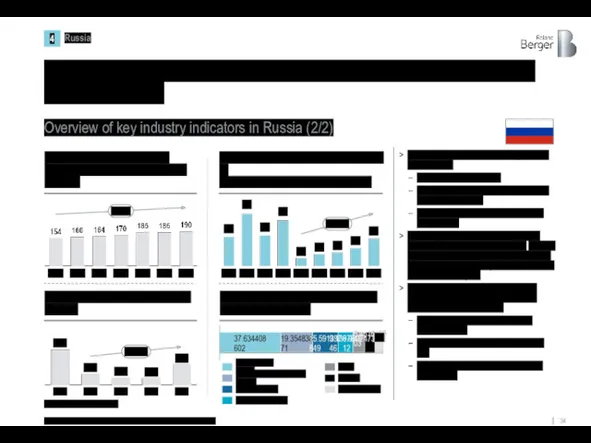
Today, the industry includes 180 active shipyards employing about 190,000 people.
Overview
Today, the industry includes 180 active shipyards employing about 190,000 people.
Overview
Since 2000, Turkey has been systematically developing and supporting the shipbuilding
Since 2000, Turkey has been systematically developing and supporting the shipbuilding
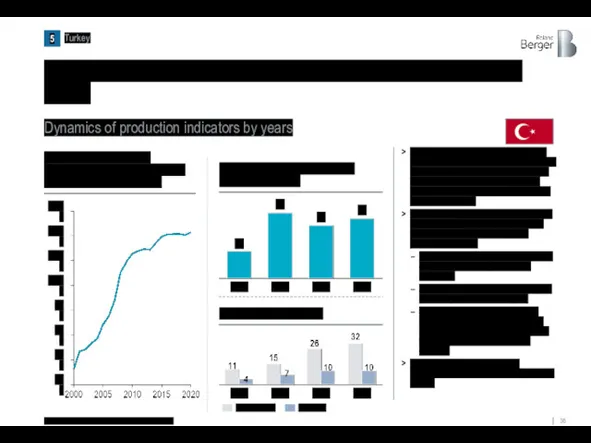
Turkey's shipbuilding capacity has almost quadrupled during this period
400
1,600
1,200
200
1,400
600
800
1,000
2003
2008
34
2019
2017
28
14
31
Dynamics of production
Turkey's shipbuilding capacity has almost quadrupled during this period
400
1,600
1,200
200
1,400
600
800
1,000
2003
2008
34
2019
2017
28
14
31
Dynamics of production
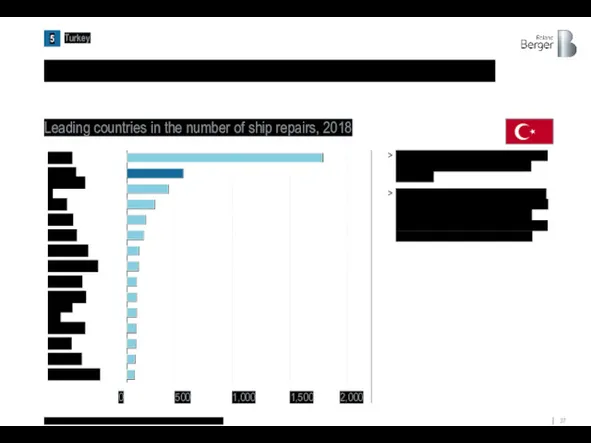
Also, Turkey was among the leading countries in ship repairs
Source: Republic
Also, Turkey was among the leading countries in ship repairs
Source: Republic

3. The region market, the potential for
Ukraine
3. The region market, the potential for
Ukraine
As the market for new shipbuilding declines, the Black Sea region's
As the market for new shipbuilding declines, the Black Sea region's
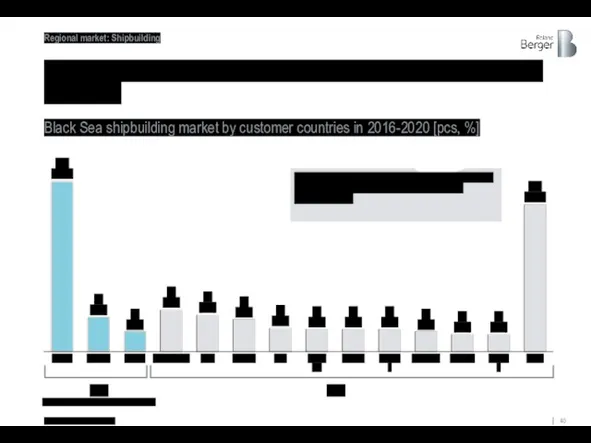
Most of the orders of the Black Sea region today come
Most of the orders of the Black Sea region today come
67
48
Bulk carriers1)
Tankers
Container ships
Other/Special (non-cargo) vessels2)
Turkey and Romania have produced significantly larger
67
48
Bulk carriers1)
Tankers
Container ships
Other/Special (non-cargo) vessels2)
Turkey and Romania have produced significantly larger
3
24
77
11
2
3
6
39
105
37
13
45
241
312
312
1,900
5
22
12
537
Turkey and Romania have produced significantly larger volumes over the past
3
24
77
11
2
3
6
39
105
37
13
45
241
312
312
1,900
5
22
12
537
Turkey and Romania have produced significantly larger volumes over the past
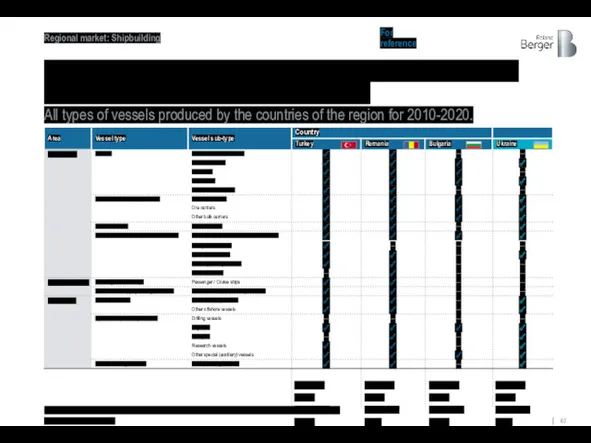
And all countries in the region, including Ukraine, are capable of
And all countries in the region, including Ukraine, are capable of
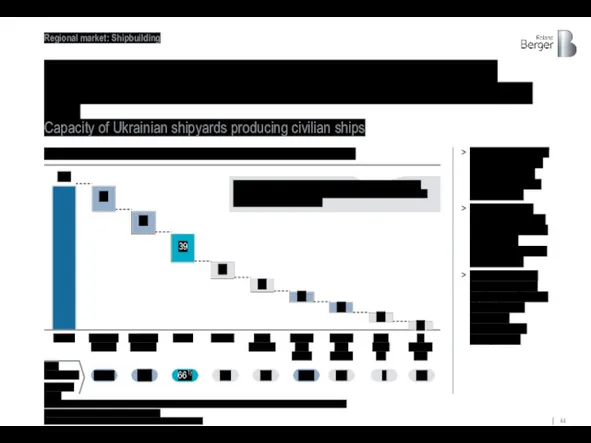
The production capacity of Ukrainian shipyards today is ~196 thousand CGT,
The production capacity of Ukrainian shipyards today is ~196 thousand CGT,
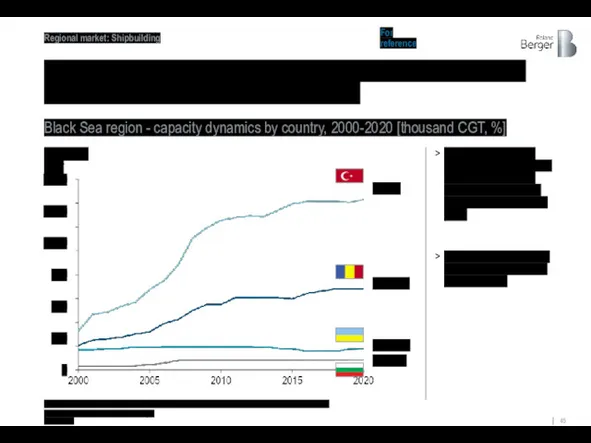
Since 2000, Turkey has tripled its shipbuilding capacity, Romania and Bulgaria
Since 2000, Turkey has tripled its shipbuilding capacity, Romania and Bulgaria
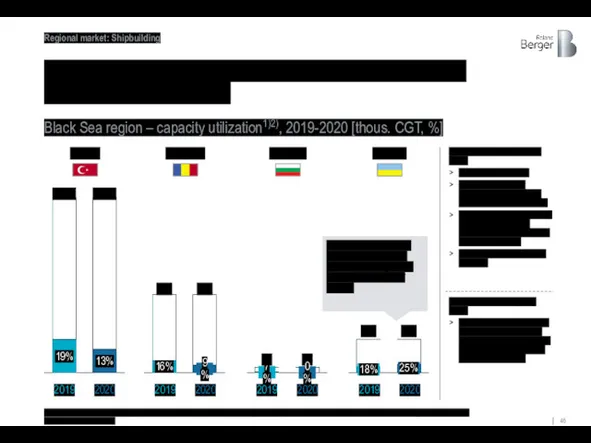
Despite such significant capacity, the Black Sea region is significantly underutilized
13%
19%
1,429
1,429
Romania
Turkey
Bulgaria
Ukraine
18%
25%
196
196
16%
9%
717
717
85
7%
0%
85
Approach
Despite such significant capacity, the Black Sea region is significantly underutilized
13%
19%
1,429
1,429
Romania
Turkey
Bulgaria
Ukraine
18%
25%
196
196
16%
9%
717
717
85
7%
0%
85
Approach
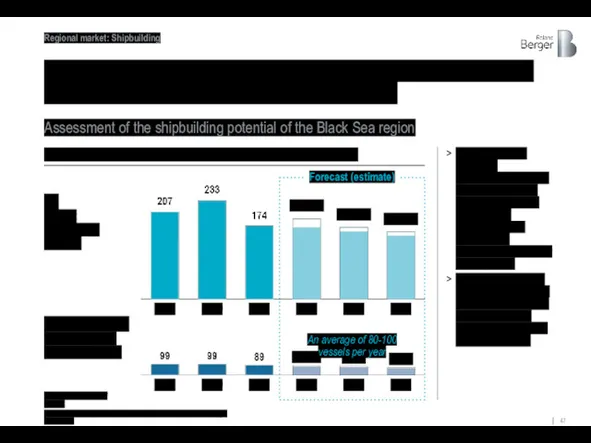
The forecast volume of construction of new ships in the Black
The forecast volume of construction of new ships in the Black
Ukrainian shipyards are technically able to produce the entire range of
Ukrainian shipyards are technically able to produce the entire range of
The production capacity of Ukrainian shipyards approximately corresponds to half of
The production capacity of Ukrainian shipyards approximately corresponds to half of
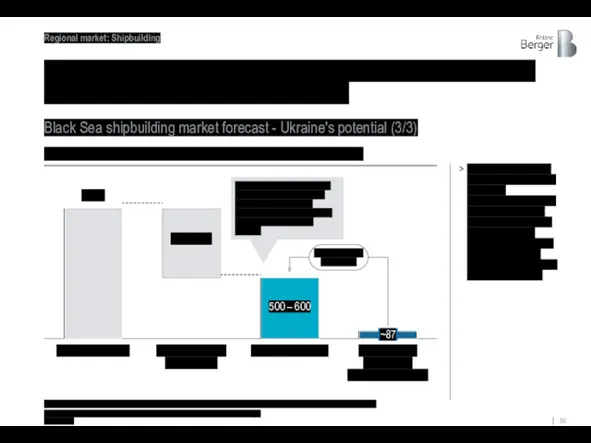
Given the available capacity, Ukraine's maximum potential for new construction is
Given the available capacity, Ukraine's maximum potential for new construction is
Ship repair market of the Black Sea region shows the growth
Ship repair market of the Black Sea region shows the growth

Two-thirds of ship repairs in Ukraine are carried out on the
Two-thirds of ship repairs in Ukraine are carried out on the
The ship repair market in the Black Sea region is expected
The ship repair market in the Black Sea region is expected
Due to the factor of remoteness, as well as the fact
Due to the factor of remoteness, as well as the fact
 Сущность портфеля ценных бумаг и портфельного инвестирования. (Тема 1)
 Основы системы ОМС
 Ссудный капитал и кредит
 Особенности сдачи отчетности за 9 месяцев 2023 года в бюджетной сфере
 Видаткова частина бюджету України
 Финансово-правовые нормы, их особенности, виды и структура
 FEEL THE TASTE. Общество с ограниченной ответственностью
 УСН
УСН Изменения в бухгалтерской (финансовой) отчетности за 2018 год
 Школа ЖКХ. Начисление платы за коммунальные ресурсы, расходуемые на общедомовые нужды. Лекция 5
 Управление личными финансами
 Специальные режимы налогообложения
 Инвестиционная политика предприятия
 Концептуальные основы бухгалтерского учета и отчетности организаций сектора государственного управления
 Федеральный фонды обязательного медицинского страхования
 Финансовые меры поддержки для СМСП по муниципальной программе Развитие и поддержка малого и среднего предпринимательства
 Учет в строительстве. Понятие строительства, его особенности
 Методы учета (калькулирования) затрат
 Ко-бренды. Кобрендовые кредитные карты. Банк Тинькофф
 Состав и содержание финансовых ресурсов страховой компании
 Ценообразование. Тема 7
 Международные стандарты и нормативы регулирования аудиторской деятельности
 Материнский капитал как социальная защита населения
 Медицинское страхование
 Неделя финансовой грамотности для детей и молодежи. 5-7 класс
 Теория о минимумах и максимумах рынка (дополнение к теории Доу)
 Форма №1. Бухгалтерский баланс
 РГС Защита здоровья